Often traders ask the question whether volumes really exist in Forex and how to get them. In this article, we tried to describe the most popular Forex volume indicators, each of which can be downloaded.
- What is volume in Forex?
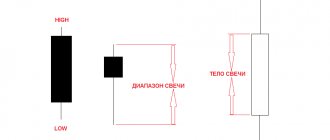
Actual volume
- Tick volume
- Transaction volume
- Why is volume so important in the Forex, stocks or futures markets?
Volume is the “fuel” of markets.
- Volume is also important when observing waves (oscillations or swings)
- Main 4 volume indicators:
Volume indicator ON BALANCE VOLUME (OBV)
Structure and logic of operation of the OBV volume indicator
- How does the AD indicator work?
- Chaikin Money Flow Indicator (CMF) volume indicator
Although the Forex market is an unregulated market and does not have its own headquarters or any one exchange through which all orders pass, volumes on Forex exist and we, traders, can use them. (True, we are not talking about the actual volume, but the tick volume).
In order to thoroughly delve into volumes in the Forex market and understand how volume indicators work, let us first explain what volume is and what volume is offered to traders in the markets.
Volume classification
Depending on how they are displayed on the graph, there are:
- horizontal volume – show information on price levels, displayed in the form histograms on the left side of the terminal. They are valuable because they show really important levels for big players. We’ll talk more about how to use the volume profile a little later, but for now I’ll note that these levels can be used as a kind of watershed. That is, take into account the position of the chart relative to the level;
- vertical volume – data is already displayed below the chart in the form of a histogram, each column of which corresponds to a candle. This type of indicator does not provide information about important levels, that is, what happened inside the candle remains unknown to you and me.
In trading, you can combine both types of volumes or limit yourself to only one of them. I note that in MetaTrader4 things are not very good with this. There is no horizontal volume indicator in the standard set; there are only a couple of tools for displaying vertical volumes.
There is another classification depending on where the data comes from:
- real ones - from the Chicago Stock Exchange. Information on currency futures reflects with a sufficient degree of accuracy the picture of what is happening in the foreign exchange market;
- teak. Let me remind you that a tick means a price change, so the trader will not see real information on concluded contracts, but only number of price changes. In MetaTrader4, all presented values are tick values, for example, on the indicator Volumes the value of each column shows how many times the price changed during the formation of the candle to which this column corresponds.
Even though volume indicators for MT4 provide only tick data, they can be used in your work. If we compare the histograms for real data with CME and tick data in MT4, it turns out that the outlines of both histograms are very similar. We are not interested in the specific volume value on each candle; this information is useless. What is important in the work is the dynamics of changes in volumes , bursts of activity in the market, that is, the outline of the histogram as a whole .
How to trade with the on-balance volume indicator (on-balance volume indicator)
On-Balance Volume (OBV) is an aggregate tool based on volume. Simply put, it's a line.
However, this line is special for several reasons. First, it appears at the bottom of the chart, but it is not an oscillator.
Secondly, it shows the relationship between the number of transactions and price movements. Therefore, it shows volume.
Finally, traders use this line to confirm a trend, or to identify reversals.
— If the OBV indicator rises, the trend is bullish. When it falls, the price must also fall.
Thus, traders look at OBV to be accurate when predicting a safe move. In our case, the movement of a currency pair.
The OBV period can be adjusted. In fact, its calculation method depends on the period under consideration.
To appreciate the power of this volume profile indicator, take a look at its calculation. If the current closing price is higher than the previous one, the current volume is added to the OBV.
If it has not changed, the volume remains unchanged. And it is deducted if the closing occurs lower.
Because of these characteristics, it reflects price action. Therefore, when divergence occurs, it is a powerful reversal signal.
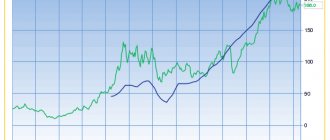
The above example for AUD/USD shows the price increase. But Forex Volume OBV is declining.
Now, this is dangerous territory for bull traders. The market fluctuates.
A close look at the left side of the chart shows that OBV is mimicking price and nothing more, hence the bears will use this opportunity to sell the pair.
Where to get information from?
In MetaTrader4, in the standard set of indicators, the situation with volumes is deplorable; only 4 algorithms are available, and even those allow you to work only with tick data. In addition to MT4, you can work with this information through other terminals.
For example, ATAS has the opportunity to work with a footprint. , cluster analysis of a graph is well implemented in the terminal . The only downside is that the demo is available for a limited time. After it expires, you will have to register your training account again.
For QUIK there are good indicators of horizontal/vertical volumes. on sb-professional.com , however, their terminal is now paid . Among the terminals I would also like to mention NinjaTrader and ToS .
You can also view data on futures volumes here . True, working with information is not particularly convenient, and a time delay .
Cluster Delta was freely available , but since 2013 they have become paid . Moreover, the indicators themselves can be downloaded, but they will only work if you top up your account on clusterdelta.com , otherwise access to the information will be prohibited.
I liked the developments of the Delta Cluster because the trader received everything he needed to work using VSA. There are regular and horizontal volumes, and delta volumes. In principle, if a trader constantly uses VSA in his work, then he can pay for access, but for beginners it is better to experiment in the same MT4. You should not count on the Delta Cluster indicators being hacked. The fact is that access to information from the site . A hacked indicator simply will not have access to it.
If you have just started getting acquainted with volumes, then you can limit yourself to free tools for MT4 or other trading terminals. I will also provide a table with the conditions of major brokers.
| Company | Just2trade | United Traders | BKS | Tinkoff investments |
| Minimum deposit | From $100 | $300 | from 50,000 rub. | Unlimited, you can even buy 1 share, they recommend starting from RUB 30,000. |
| Commission per cycle (buy + sell trade) | 0.006 USD per share (min. 1.5 USD), 0.25 USD for each application. that is, per lap – $3.50 | “Beginner” tariff – $0.02 per share Average $4 per round | At the “Investor” tariff – 0.1% of the transaction amount, at the “Trader” tariff it is reduced to 0.015% | 0.3% for the “Investor” tariff |
| Additional charges | The ROX platform will cost at least $39/month. (for the American market), for an additional $34.50 they connect Canada/TSE, Level II On the over-the-counter market, the additional fee is 0.75% of the transaction volume (minimum $30), in the case of dividends - 3% from the issuer (minimum $3) | On the Day Trader tariff, they charge $60/month for the Aurora platform, free on other plans | If the account has less than 30,000 rubles - 300 rubles/month. for access to QUIK and 200 rub./month. for access to the mobile version of QUIK, | — |
| Account maintenance cost | $5/€5/350 rub. reduced by the amount of the commission paid | — | 0 RUR/ month on the “Investor” tariff. On other tariffs, funds are debited only if there was activity on the account this month | Free for the "Investor" tariff |
| Leverage | for Forex Up to 1 to 500 for stocks up to 1 to 20 (day) to 1 to 5 (night) | 1 to 20 on the Day Trader tariff, this is the maximum leverage (daily) | Calculated for each share, within the range of 1 to 2 – 1 to 5 | Calculated for different instruments, the calculation is linked to the risk rate |
| Margin call | -90% | Standard -30% of the deposit, in technical terms. support can be set -80% | Calculated based on the risk for each security | Depends on the asset |
| Trading terminals | MetaTrader5, ROX | Aurora, Sterling Trader, Fusion, Laser Trader, Volfix.Net, Pair Trader | My broker, QUIK, WebQUIK, mobile QUIK, MetaTrader5 | The purchase of shares is implemented like an online store, professional software is not used |
| Available markets for trading | Forex, American, European and other stock markets, cryptocurrency | American and other stock markets, more than 10,000 assets in total, cryptocurrency | Foreign exchange, stock, commodity markets, there is access to foreign exchanges | American and Russian stock markets |
| License | CySEC | Lightweight license from the Central Bank of the Russian Federation | TSB RF | TSB RF |
| Open an account | Open an account | Open an account | Open an account |
Volume forex
The trading algorithm under consideration was developed to determine the activity of trading participants over a certain period of time. This indicator can be an extremely effective addition to any trading strategy, as it provides the user with an extensive range of information that allows them to accurately determine the most profitable moments for carrying out certain financial transactions. The only thing a trader needs for effective trading is to learn the basic intricacies of working with this indicator.
First, you should pay attention to the installation of this algorithm. Since it is standard for most of the most popular trading platforms, the speculator will not have to waste time downloading and installing it. It will be enough to simply find it in the menu with the tools of the client he has chosen to work with. To get started, simply move the indicator into the workspace.
Directly, the readings provided by the instrument represent the number of trading operations carried out by traders with the selected trading asset. At the same time, the user can independently choose the time period that will be used by the tool for technical analysis.
Brief overview of indicators
In this section, I will very briefly go over the main indicators that everyone can download for free and try in MT4. In principle, they are all the same type, as well as the methods of working with them.
The Volumes indicator is a standard tool from MetaTrader4
It doesn’t have any settings ; you can only change the thickness of the histogram lines and their color. On the chart, the vertical volume indicator is plotted in the “basement”.
The color of the histogram column indicates in which direction there were more ticks (that is, price changes). If the column is red , then when the candle was formed the price went down more often than it went up.
There may be situations when a white candle corresponds to a red column in the indicator window.
Better Volumes
Belongs to the category of custom indicators. The histogram coincides 100% with the histogram of standard Volumes. The main advantage of Better Volumes is that the columns are painted in different colors depending on the market situation , which is why it is called “the best indicator for vertical volumes in MT4”. The screenshot below shows that the histograms match up to a point.
The color breakdown of the histogram columns looks like this:
- red – appears on ascending candle (the body may be black, but with a large shadow below). A prerequisite is a large traded volume . Such signals need to be taken into account if they appear at a peak, often this indicates either an upcoming trend change or the beginning of a corrective movement;
- brown – appears at the end of a downward movement on a candle with a large traded volume and a large range. If the brown histogram column appears at the end of a growing movement, we ignore it;
- green – another powerful reversal signal , corresponds to candles with a relatively small range and large volume. This is a key moment in the development of a trend in Forex, at this time large players leave the market, transferring their positions to small traders;
- The yellow column is an auxiliary signal, corresponding to a very small traded volume. Also appears at the end of trends/corrections. Physical meaning – there are no people willing to buy/sell on the market ;
- blue columns – we don’t pay attention to them, they simply indicate the number of price changes in ticks.
In the indicator settings there is such an item as MAPeriod - moving average period.
A moving average is plotted directly from the histogram in the indicator window; the moving average line can be considered a dynamic level to determine the significance of the volume. If the histogram column is above it , the indicator values are considered to be above average.
VWAP indicator
I will mention it briefly, since the volume in it is used only indirectly, to calculate the position of the lines on the chart. This is not an indicator of futures volumes (or ticks), but a regular moving average , just volume is used in the calculation formula. On each candle, the price is multiplied with volume, and the product of these values is divided by the total volume.
On the chart we get an envelope of lines; they can be used, for example, as a replacement for Bollinger Bands and work to rebound from them. This indicator is available online for both the MetaTrader4 and MT5 terminals.
Indicators for working with horizontal volumes
There are many algorithms of this type on the Internet. Some build a market profile for given periods, others show the overall trading for a selected period of time. I don’t see the point in describing in detail the features of each, so I will give several such algorithms in the form of a list. In principle, they show the same thing , which means they are interchangeable:
- HighVolumeBar – horizontal volumes are built daily. It can be used to determine the most significant levels for the graph, at which the maximum value is observed on the histogram;
- level sensor – suitable for displaying the total trading volume across the entire chart. Just add it to the chart, and a histogram of the entire chart will appear on the left side of the screen. The tool is convenient for determining levels; they can be used, for example, when trend trading. I pay special attention to working with the trend; it is convenient to enter the market at the end of the correction, and this moment can be indicated by the levels on the level sensor. I even devoted a separate material to this method of work - the article on trend trading is entirely devoted to the issue of trading in the direction of market movement;
- level sensor new – the same thing, but the histogram is located in the right corner . Shows the same thing as the previous algorithm class=”aligncenter” width=”1024″ height=”459″[/img]
- market profile trend lines – the market profile is built by day. The main feature is the additional capabilities of the indicator. It highlights on the graph ROS (point of control) – key levels, on which the maximum traded volume was observed. The chart also highlights zones in which maximum volumes were observed, and even plots trend lines. However, the accuracy of their construction leaves much to be desired.
You can count a dozen more indicators of this type. Most show the same thing, and they differ only in additional features, the number of settings, and the location of the histogram.
Do you work a lot and don’t have time properly manage your investment portfolio? Does setting up indicators in the terminal take too much time and effort? For me, investing is my main job 24/7. Use my ready-made analytics and free up time for other pleasant things.
Earn 20% per annum
Trading with the Chaikin volume indicator (chaikin volatility (chv) indicator)
Perhaps the best volume indicator is the Chaikin indicator, created by Marc Chaikin. This is a combination between MACD and momentum oscillator.
More precisely, it measures the momentum of the accumulation/distribution line with the MACD. Traders use it to predict changes in trends.
When momentum changes, this is the first sign of a "swing" in the trend. Thus, if traders know in advance when this will happen, they will place positions accordingly.
Traders use the Chaikin Volume Indicator in both positive and negative territory. The volume indicator strategy is to buy or sell when it crosses from positive to negative or negative to positive territory.
Divergence also works with the Chaikin indicator, however, since we have already shown how divergence works with the Forex volume indicator, we will focus on the crossover strategy.
This is what this indicator looks like on a chart. It is completely different from the Forex volume indicator on the mt4 trading platform.
As explained earlier, the idea is to buy or sell when Chaikin crosses the zero level. But it gives several signals. Many of them are false.
How to apply this information in trading
For convenience, I will divide the use of horizontal and vertical volumes into 2 separate sections, but this does not mean that they should be used separately in trading. You can combine both types of indicators.
Working with the standard Volumes indicator
You can trade using Better Volume signals; in this case, focus on the color of the histogram column, as well as the configuration of the candle on the chart. But the standard Volumes indicator, which displays tick data rather than real market volume, can work quite well.
In any material about VSA, you will come across phrases such as “ significant or large volume.” At the same time, in the window with a histogram there are no criteria that would help rank the data and determine which column of the histogram can be considered large and which is within the normal range.
I recommend applying the level/levels to the indicator yourself . To do this, reduce the scale and draw a horizontal line on the histogram by eye so that most of the columns are under it. This way we will cut off truly significant price fluctuations from ordinary price noise.
When working, pay attention to:
- formation of candles with a small range and large volumes . Major players are exiting the market, so a reversal may be in preparation;
- large volumes at the peak of the trend during which the price failed to move in the direction of the trend. In the example in the screenshot below, the bulls’ attempt to move the chart higher failed, the bears repelled the attack, and the large volume indicates that they are serious about defending this level. The next black candle with a large range and the same value on Volumes confirms this conclusion;
- you can try using Volumes like criterion for the truth of level breakdown. If the breakout is not false, then the indicator should show a sharp increase in the histogram. This criterion can be used, for example, when the chart exits a flat or when trend lines break out.
I recommend combining volumetric indicators with other market analysis techniques and indicators.
For example, if we add MACD to the situation discussed in the screenshot above, we will see that shortly before the breakout there was a divergence in MACD , which increases the likelihood that the breakout is true. I told you more about how to use the MACD indicator earlier.
Using Horizontal Volumes
They are used mainly to determine the POC (point of control) - a straight line is drawn through the maximum value of the histogram and we get the level . As a rule, such levels are always worked out. Not exactly to the point, the price may not reach it a little, cast beyond it, but it still stops there.
As an option, when working intraday, you can build several ROS and trade on a pullback or a breakout of the resulting horizontal channels. The levels are worked out even if a gap appears on the market, the price will still take into account the position of the ROS - the key levels for large players. Read more about what GEP is in a separate article.
Now a small example of using volumes in intraday work :
- add any horizontal volume indicator ;
- now we need to identify range, in which the price moves. We get channel, in which the graph moves most of the time;
- You can trade both on the breakdown of its borders and on the rebound from them. If you don’t be greedy and set a goal at the POC level when rebounding from the channel boundaries, then the percentage of completed trades will increase .
As when trading on a rebound from standard support/resistance levels, I recommend taking into account reversal candlestick patterns , this is an important element in understanding what is happening in the market. The article about analyzing combinations of Japanese candlesticks examines this issue in detail , I recommend that you read it.
Don’t forget that it’s easy to work with such a tool as horizontal/vertical volume using history; you can justify any entry into the market without any problems. The real difficulties begin when you need to predict the behavior of the chart in the near future and determine whether the support/resistance breakdown is true. constant practice can help with this .
Features of using technical tools
All free Forex trading volume indicators for MT4/MT5/Quik and other terminals can be divided into two large groups based on their usage features and construction methods:
1) Those that repeat the price chart with different degrees of smoothing
- Accumulation Distribution or A/D indicator - indicator-Accumulation_Distribution-MT4;
- OBV - .
2) Oscillators that display information in the format of a chart of changes in market sentiment (Klinger indicator, Chaikin oscillator - you can download it from the link)
Regardless of the group and type of instrument, the rules and features of their work are almost the same.
Operating principles of indicators:
- When volumes decrease, we can talk about a decrease in the interest of participants in a currency instrument, which often leads to price consolidation or a quick change in trend direction.
- An increase indicates an increase in interest in the asset, the likelihood of a trend continuation or a sharp change in trend direction.
- When values slowly decline, the price may fluctuate greatly due to the fact that major participants have already left the market and the actions of small traders have a greater influence on the situation than usual.
- The appearance of indicator peaks indicates the likelihood of a trend reversal.
conclusions
Volumes are important in trading; they can be used both as the basis of a trading strategy and as one of the additional filters (for example, assessing the truth of a level breakout). I do not urge you to abandon your own trading methods and immediately start trading only on the basis of VSA, but it is worth taking a closer look at this method of market analysis .
I will end my review here, I hope it was useful for you. Subscribe to my blog updates, this is not the last topic that I would like to discuss with you. See you in touch!
If you find an error in the text, please select a piece of text and press Ctrl+Enter. Thanks for helping my blog get better!
Description of settings
The Volumes indicator is located in the “Volumes” section, the “Indicators” option, the “Insert” menu of the Metatrader 4 trading platform. The settings window does not contain numerical parameters, only the selection of the thickness and color of the histogram bars.
On the Levels tab, a trader can set specific markers to indicate abnormal historical values. As shown above, they can indicate global reversal points for long-term trends in a currency pair.
Tips and tricks for traders
A wide variety of volume indicators opens up wide opportunities for traders and experts in the field of financial market analysis. Professionals advise beginners to carefully study the characteristics and features of the selected instruments before using them, and to begin using them in real trading only after testing on a demo account, so as not to expose their deposit to financial risks.
Rules for volume indicators:
- If volume indicators decrease, this means a decline in interest in the trading asset. Therefore, there are two possible directions for the development of the event: short-term price stabilization or a change in the direction of market quotes.
- An increase in indicator values is a signal of increased demand for an asset or a market reversal.
- In some cases, a gradual decrease in volume values may indicate a sharp change in price.
- After the formation of peaks on the chart, there is a high probability of a market reversal of the impulse or trend.
In trading, it is important to minimize financial risks as much as possible and trade based on the patterns and fundamentals of the market.
Application area
All volume indicators are used to quantify positions at a price level or per unit of time. Special trading strategies have been developed based on horizontal and vertical volumes.
These technical instruments, based on their indicators, determine trading signals for entering and exiting the market. They are widely used during trading and for analytical forecasting of market movements.
In addition, volume indicators can be used in trading as filters to filter out false signals for other instruments.