forexgid 12/10/2020 3212 0
They say that traders make great money on volumes. What do you think, really?
While we were preparing the topic, we came across about half a dozen statements:
- market volumes are working;
- volumes don't work;
- volumes lie;
- Those who say that volumes are lying are lying.
Lots of information. We have found the absolute answer for you. To find out, read on:
It turns out that volumes on the FX market are a hoax?
We asked the same question. And they found the answer in currency futures:
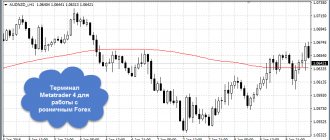
Open TradingView and enter "Euro futures" or copy "6E1!" and paste it into the search. The Eurodollar futures chart will open.
Next, on the top panel near the plus sign, click “Fx”: a list of indicators will open. Enter "Volume" and select it from the list:
Volumes will appear on the chart. Compare them with volumes on the Eurodollar, EUR/USD. Same columns, just different scale.
Trading by volume
Most often, speculators use various graphic patterns, as well as signals from automatic algorithms, such as the moving average MA 200, in their trading strategies to predict potential changes in the market. Of course, these are very effective approaches for conducting trading operations, but they may not always be enough for making a good profit.
Only a considerable number of traders pay due attention to the analysis of such an indicator as trading volume. However, this value is as objective as possible and can describe current activity in the market with extremely high accuracy. It is great for confirming the power of certain value impulses.
In the case of Forex, it should be noted that the user is given the opportunity to analyze only tick volumes, which display the number of impulses completed by value over a certain period of time. This value cannot fully reflect the mood of users, but it can be used in a similar way to real volume, since it behaves approximately the same.
The inability to work with the second is due to the fact that the financial market is decentralized, that is, it does not have any one information center in which all information could be taken into account. That is why the average speculator has access only to the data determined by his trading broker. The latter also have a certain impact on the reliability of the trading volume, since the loans they issue for financial transactions prevent an accurate determination of the value in question.
There are many different methods for using market volume directly when conducting transactions, but for their effective implementation it is necessary to have a general understanding of working with this indicator.
First of all, it should be noted that the market most of the time is in a state of a certain balance between opposing categories of users. Various surges in the price level occur at moments when this balance is upset by one of the parties. As mentioned earlier, if the initiative passes into the hands of buyers, the price begins an upward movement. Otherwise, the price line will correspondingly decrease.
Most of the trading instruments that determine this indicator are displayed in the form of a histogram located at the bottom or side of the working interface. A classic example is the]Volume Profile[/anchor] algorithm. Such a display of readings allows you to monitor as clearly as possible the dynamics in the behavior of value: the emergence and attenuation of strong impulses of its movement.
Volumes: 3 simplest strategies
Let's call the first strategy “Climax”. It indicates a price reversal: either a rollback in a trend, or a top/bottom in a sideways trend:
In the picture we see how, behind high volumes, the climax of the rollback begins each time. The mechanics of price behavior are as follows:
- There is a growing trend;
- It has its own natural kickbacks;
- At the end of each pullback, volumes rise, then there is a climax: volumes peak, the pullback ends, and the trend begins to rise again.
Note: first the volumes reach a maximum, then they begin to decline, and only then do we open a trade. The “climax” strategy does not probe for tops and bottoms: it shows a reversal along the trend.
“Climax” also works in sideways:
Such volumes reflect the psychological pattern of traders: at first they are afraid to enter a trend, then they cannot keep up with it. And they open when big players, on the contrary, exit the market.
Try to connect “Climax”, candlestick and trend analysis. Work with such a combination for at least a week, and you will see: you will have more positive transactions. Try it with a reliable broker AMarkets - what to lose?
Let's sum it up
Forex volume can give us some clues about where the price might go next. However, since we only see volume from one broker, it is difficult to trust the numbers to give us an accurate picture of how much currency is traded in the entire market.
If you want to test a trading strategy that includes volume as a trading signal, be sure to use data from the broker you will be trading with. It is very important.
There are times when volume can signal the possible direction of the market, but for the most part volume is too flat to make any real trading decisions. Check it out and see for yourself.
Attenuation
This is what we will call the second strategy.
The meaning is simple: we find the lowest volumes. They show a pause in the market. After them the trend begins:
“Fading” helps us separate sideways, and perfectly complements technical analysis.
Volumes are falling → we wait for a sideways trend → and find a signal on a lower timeframe for our trade along the trend.
What does trading volume tell us?
If you don't know anything about volume, let's first look at how stock trading volume works because in this market it is much easier for us to explain the concept.
Stock trading volume is simply a measure of how many shares are traded during each candle. For example, in this daily chart, 24,157,000 shares (rounded) were traded over the last day.
This can be key information when trading stocks. But we also need other information.
How many shares are outstanding?
It is very useful to know the total number of shares that are traded on the exchange. This is called a float.
When we check Yahoo Finance, we find that the total number of shares outstanding is 1.33 Billion shares. In stock trading, this is important because it helps us answer the question: “How much volume is there in high volume?”
So, in this example, 24 million shares is not a lot of volume compared to the 1.33 billion shares that are available for trading.
Now, if there was a day when 600 million shares were traded, that's almost half the total number of shares, and that would tell us that something very important is happening to the stock. This brings us to some other clues that trading volume can give us.
Let's look at three main ways to use volume to identify trading opportunities.
Attention: rollback
And the last strategy for today is “Attention: rollback”. As you guessed, she is counter-trend movements:
We have marked record volumes with red arrows. We see that after the candles marked with green arrows, a rollback begins without delay.
How to use the strategy? The price cannot withstand the surge in volumes and goes sideways or rollback. Your task is to wait for the “fading” and find a false breakout of the sideways trend on a lower timeframe. Trade only with the trend.
Volume can show the strength of movement
The general idea is that if you see an increase in volume in a trend, it is likely that you will continue to see price movement in the same direction. This makes sense because as a trend gains momentum, more people need to join in to keep the trend going.
Here is an example of a trend in oil where volume increases with an upward trend. Although these are futures and not stocks, the same principle applies. Once volume begins to dry up, the trend reverses shortly thereafter.
What is Test?
Let's move on to the definition:
A VSA test is a movement caused by market makers to identify whether there is supply/demand in the market that may interfere with their selling or buying campaign.
Let's say market makers want to buy. They push the price down and see if there are a large number of sellers whom they are trying to seduce with this false movement. And if there are no sellers, you can start some kind of large-scale purchasing campaign. Below we will analyze this in graphs, so you will understand everything.
A successful test, that is, a test after which a movement begins in the direction of the market maker’s buying or selling campaign, is characterized by a small volume and a subsequent price rebound in the opposite direction. We are looking for a false movement on a small volume, and then in the opposite direction. Once we receive confirmation that this is a test, we will be able to enter the market and make a profit.
Let's take a look at the graph to make it more clear.
It's not the prettiest graph, but it's there to make the examples more practical. The chart shows a downward trend.
We see that after it has been precisely formed, starting from this point, the question arises, will it continue further?
Nobody knows. Market makers also do not know this, and they want to find out whether it makes sense to continue selling. Maybe the market wants to turn upward and this will bring them a loss.
And around here, they start a small purchasing campaign:
Simply put, they want to push the market up in order to see if there are any large number of sellers who will happily accept this momentum and continue to move up.
If this happens, then market makers in this case should not open any large number of sales, and it is best for them to start purchasing together with the crowd. They check whether there are people willing to buy and give a small impetus:
The level that was formed earlier was specially broken in order to activate the orders of those who placed limit orders and to show that this is an upward impulse, let's guys buy if you really have such a desire. This is testing to see if there is demand in the market.
There were no people willing to buy and we saw the following downward candles:
Since the volume of purchases was small, we conclude that this was testing, and not some kind of incipient upward movement. Further, we see confirmation of our theory in the form of candles with a downward direction. We know for sure that this is testing and it was quite possible to start selling. The most important thing is to understand the essence of this setup. Market makers check to see if there is a force in the market that can counter them. If there is no such force, then they begin to move in the direction they intended.
Trading by volumes and levels
The normal situation for financial markets is the advancing nature of the movement of trading volume. In this case, its limit points are generated earlier than the minimums and maximums of the value. In the picture below you can see that at point A the volume indicator reaches its peak value, and the price line updates its extremes to point C. An important point: at this point the level of activity of speculators is much lower than before.
Also in this case, you can see that at point B there is already a clear discrepancy between the level of volume and cost, that is, the first decreases, and the second increases. This indicates that buyers have lost activity in this asset, and the current trend is moving by inertia and is approaching its end.
An alternative Masterforex-V method for analyzing the levels of a large accumulation of orders in the Forex market
1. What do the levels of a large accumulation of orders look like on the Forex market from Masterforex-V . Example H4 for GBPCHF, whose futures quotes have never been provided by the American CME exchange
Fig.2. GBP/CHF chart with levels of large clusters of orders
- GBPCHF is in a flat (see NOT correct fan of average MFs);
- key level of order accumulation for changing the trend to bullish 1.3117;
- On November 8, GBPCHF tested this level (reached the auxiliary 1.3163) and consolidated BELOW it + see divergence for Zotik JSC on November 8;
- there were 3 possible targets for a powerful fall, from one of which (1.2696) he bounced off, the rest he punched without a rebound.
EURJPY: also figure out on your own what targets “to the south” the euro yen is moving towards, where a reversal upward can occur and to what targets in the “north” it will rush.
Fig.3. EUR/JPY chart with levels of large clusters of orders
GBPUSD. Compare our GBP/USD analysis. and the American CME exchange. Are you sure that the accumulation of Masterforex-V orders is not enough for you?
Fig.4. GBP/USD chart with levels of large clusters of orders
As the Academy traders joke, “only through the accumulation of orders on Forex from the MF, you can understand what futures and market currency pairs are doing and what they will do.”
Trading by VSA volumes
In the image below you can see a situation in which the price line moved down for a certain time, and then suddenly jumped up after a change in trading volumes. This is a clear example of the culmination of a sell trade. Most often, the reason for this situation is the publication of thematic news, which prompts the majority of speculators to leave trading in the current conditions.
After a sharp collapse in value, the remaining traders begin to massively purchase the asset at the minimum cost, which is why it begins to increase sharply. Most often, this fact is used as a prerequisite for a further trend reversal, or as a signal about an imminent update of the minimum value values. What exactly to choose directly depends on the conditions in which the speculator conducts trading operations (time period and valuable asset).
For sales accompanied by a large value of volume, a subsequent normal phenomenon will be a parallel upward movement of value and a decrease in the activity of traders. This situation is a prerequisite for an upward movement of the trend, favorable for entering the purchase of currency.
In the picture below you can see that the unstable movement of the price line after the signal described above continues with the subsequent verification of the new minimum generated on the chart. This test will be successful provided that users show low interest in the asset. In this case, there is a certain balance in the market between opposing categories of trading participants. Thanks to this signal, a trader can open a trading order at the very beginning of a powerful movement of the price line.
It should be noted that high trading volume indicators in most cases warn of powerful and prolonged value movements in the future. The image below shows an example of how this pattern works. In this case, the price has dropped significantly, and the trading volume, on the contrary, has reached its maximum. Under such conditions, we can say that soon the mood of market makers will change dramatically.
How to enter the market?
But in order for us to consider this setup as an entry opportunity, there must be strength in the market. If we're going to end up shopping. Or it’s a weakness if we are going to sell in the end.
There was a clear downward trend on the chart. There was weakness in the background here, so it was quite possible to enter into sales based on this setup.
Let's look at another example on the M15:
We have seen a strong surge, so we can assume that the trend is going up. But will it continue?
After the horizontal movement on the chart it was not clear:
The market could very well crash because it was creating a double top. Therefore, the question arises: Does it make sense for market makers to continue buying, or is it not worth it?
And they conduct a test - a false downward movement:
It looks like a correction on an upward trend, but note that we have a small volume:
The end of the correction is realized by low volume, and it continues to fall. And after that, an upward candle appears. Note that the candle must be of normal size in order to enter the market. If the candle is small, then it is better to wait and see how the chart behaves in order to enter the market in the future.
As with all VSA setups, we look at effort and result. If there is no result, then something is wrong here. And this is not what we initially expected. After we receive confirmation, we can enter the market. We place a stop loss below this peak of the depression and enter into purchases. Let's look again at what happened here. There was strength in the background. The trend was heading up. And then there was a lull. Next, the market makers drew us a test to find out if there were anyone willing to sell in the market.
To do this, we drove the price down a little:
We drove it beyond the level that was previously formed by local minimum points:
The task of market makers is to show those wishing to sell that the price has broken through the level and thereby encourage them to sell. If those who want to sell begin to actively participate in trading, then market makers understand that it will not be profitable to sell now.
Testing on an uptrend is characterized by breaking through previous local lows. And only after we have broken through some significant line can we begin to consider entering the market, realizing that this was definitely a test, and not some kind of candle in the wrong direction.
After we break through the level and a candle forms in the opposite direction, a small volume prevails:
At this small breakout of the level we can consider an entry.
What's worth noting?
If you are in doubt whether this is a test or something else, then it is best not to enter at all. Because determining the test requires a certain skill and experience. If you cannot see at the moment or are guessing what is happening on the chart, then it is better to ignore and see what happens next. You will always have time to enter the market. He won't run away from you.
In addition, power is mandatory for consideration of purchases. This could be an upward trend or prerequisites for it. Or a downward trend, or prerequisites for a downward movement. Moreover, the end of the correction, if it is some kind of large correction, may be in a large volume. But here we will already have a culmination of buying/selling.
We look at small spikes, which, nevertheless, try to attract the attention of buyers or sellers, usually breaking through levels. And in this way, market makers check whether there is resistance in the market to their purchasing or selling campaigns.
Here's another good example:
Here we had a triple top. We see a downward movement, but it is unclear whether it will continue downward or the market will turn around and go up:
Again, we see that the market makers push the price up a little and a pin bar like this appears:
It breaks through the previous level formed by a local minimum:
The level is broken. According to price action, we are ready to enter via the pin bar to continue the trend. And, at the same time, this was testing by market makers. We can determine this from the below average volume:
And then the reversal happens:
Here the candle might seem too small, so you could wait for a later candle to enter. Let’s say we could wait for 2 more candles down:
The stop loss would be located just above the tail of this candle:
We have separate lessons on how to get out of such setups. There are many exit options every time. Choose what suits you best. You can exit at the nearest resistance support level or multiply your stop loss by two.
If, for example, we do this on this candle, then we set the stop loss above the high point:
After it, we could really confirm for ourselves that this was a test. The candle broke the level and gave a signal that it was time for everyone to buy. There were no takers and the market makers continued the sales program.
You can measure the stop loss, multiply by two and exit the market somewhere here:
You could have waited and made a little more profit. In fact, there are many exit options. We discussed them in a separate lesson from the series on price action, which is called: “Exit Strategies”.