Hello, fellow Forex traders!
Many of us disdain the classic indicators available by default in the trading terminal. But in vain. Do you know how they got there, why they actually became classics? Because they work. They worked great many years ago, which is why they became famous, and they still work now.
And today we will talk about perhaps the most famous oscillator, the Stochastic Oscillator. We will talk about how this indicator was created, what it means, as well as application strategies, many of which you are unlikely to have heard of)
Stochastic - all about the Stochastic forex indicator
How does the stochastic indicator work?
The author of the stochastic indicator, George Lane, once said: “The stochastic measures the momentum of the price. If you imagine a rocket flying in the air, then before it starts falling down, its speed will decrease. A change in momentum always precedes a change in price.”
Compared to some of the more complex technical indicators, the formula used to calculate the stochastic oscillator is quite simple.
If you open the Stochastic settings in any charting platform, such as MetaTrader, you will see that the indicator draws two separate lines representing the %K and %D period values, which are calculated using the following formula:
- %K = (Closing Price - Lowest Price) / (Highest Price - Lowest Price) * 100
- %D = 3-day moving average relative to %K
Where:
- Lowest price = lowest price value for a certain period.
- Highest price = highest price value for a certain period.
By default, stochastic in MetaTrader calculates 5 periods. However, most traders calculate stochastics based on 14 periods, which could be, for example, 14 days on a daily chart or 14 hours on an hourly chart.
It is also worth considering the volatility of the trading instrument. Since volatility varies depending on which currency pair you are trading, you can try to adjust the period settings to improve the effectiveness of the stochastic signal based on price movements.
For starters, you can use the 14-period setting. However, if you already have some trading experience, it would be a good idea to spend some time testing your chosen trading instrument and try to find the optimal time period for calculating stochastic values.
History of creation
The stochastic oscillator was developed in the late 1950s by George Lane, president of the Investment Educators Corporation. All calculations had to be done manually, and a group of traders developed formulas for the oscillators, sequentially giving them the names %A, %B, %C, etc. Only three turned out to be functional: %K, %D and %R. According to legend, one of the Poles who helped Lane in some way had a friend, an old immigrant from Czechoslovakia. He told him in his broken English about the formula they used in Czechoslovakia to figure out how much limestone needed to be added when smelting iron ore to make steel. They took this formula, adapted it to their own purposes, and began to play with it. And so the stochastic was born.
The first two curves (%K and %D) are known as Lane stochastics, and the last one (%R) is named after Larry Williams. Another variant of the origin of the names of the lines of the stochastic indicator: %D - from the word deviation, %K - from the name Kelly (the middle name of George Lane).
George Lane intended to become a doctor, like his father. One day he accidentally visited the stock exchange and what he saw interested him very much. In the late 1950s, Lane bought himself a $25 membership on the Chicago Open Board of Trade, now known as the MidAmerica Commodity Exchange, and began trading grains. Later, George Lane becomes president of Investment Educators Inc and invents stochastic, an indicator widely used throughout the world. George Lane died on July 7, 2004.
Difference between fast and slow stochastic
When stochastic was first invented, it was calculated using the formula we discussed above. However, the original stochastic formula seemed too simple for some stock and commodity traders, so they applied an additional three-period moving average to further slow down the indicator's reaction.
You can see in the figure that there is a Slowdown input field that shows a value of 3. This value is an additional moving average applied to the stochastic oscillator. This allows you to make it a little less sensitive to price changes, which improves the quality of the stochastic oscillator signals.
When you use an additional moving average to slow down the original stochastic formula, the stochastic is called slow. By default, the MetaTrader 4 trading platform displays a slow stochastic based on an additional 3-period moving average. According to the original formula, stochastic is called fast.
To calculate fast stochastics using MetaTrader 4 and other charting software, you need to set the slowdown value to 1.
Options and Settings
Here, in order not to get confused in the settings, you need to remember about three versions of stochastic: Full (full), Fast (fast) and Slow (slow).
For example, you will see the following parameters: 5, 3, 3. The first and last digits will be identical for all versions, but the second one will only be for Full. Let's look at what they mean using standard settings as an example:
- 5 is the period for the %K line. It is also called the fast or main stochastic line;
- 3 is a value that is only available in the full version of the stochastic. It gives smoothing qualities to the %K line, making it smoother, without unnecessary noise. Compare two stochastics - the upper one has smoothing, but the lower one does not, with the same other parameters:
- 3 is the period of the %D line, which is a simple moving average of %K. It is also known as the signal or slow stochastic line.
Most recommended settings for intraday trading converge on the standard ones: 5, 3, 3. Or around them, for example, 7, 3, 3.
For hourly (H1, H4) and daily timeframes, the parameters are longer 9-21, 3, 3. Weekly charts for positional traders can even include settings of 21, 7, 7.
The lower the settings, the more signals stochastic will send, of which there will be many false ones. It all depends on your trading style.
Below is an example: three stochastics on one chart with parameters 5, 3, 3 top, 14, 3, 3 middle and 21, 7, 7 bottom. As you can see, the lower one reacts only to the most significant price fluctuations.
Regarding the change in overbought/oversold levels from 80/20 to 70/30. Such strategies are described, but there are fewer of them and changes in such a plan have less impact on trading results.
So, a short summary of the settings:
- The best market for stochastic: stock market, Forex, derivatives market;
- The best instruments: stocks, futures, currency pairs and others;
- Recommended timeframe: from minute and hourly to daily and weekly. George Lane used a daily and weekly schedule.
- The most recommended parameters: from 10, 3, 3 to 21, 14, 14.
Determining overbought and oversold conditions using stochastics
The most commonly used stochastic signal is the overbought and oversold state of the market. As we know, stochastic values vary from 0 to 100.
When the stochastic oscillator value exceeds 80, it is considered an overbought condition. This signals that if you are already long, you should start reducing the size of your position or actively look for opportunities to close it.
On the contrary, when the stochastic oscillator value drops below the 20 value, it is considered oversold. This signals that if you already have a short position, you should begin to reduce the size of your position or actively look for opportunities to cover it.
While the overbought and oversold signals generated by stochastics are quite reliable, it is worth noting that these signals work best in a range-bound market. In a rising trending market, the stochastic quickly becomes overbought, and in a downward trending market, the stochastic quickly moves from an oversold state. This creates the illusion that the market is about to reverse.
Therefore, during a trending market, you should apply additional filters such as trend lines or other trend reversal indicators to confirm whether the trend is ending before taking counter-trend stochastic signals seriously.
Setting up Stochastic
The Stochastic Oscillator is included in the standard set of a large number of trading terminals. In this article, we are talking about the MetaTrader terminal, and therefore, to activate the Stochastic oscillator and see its settings, you need to click: Insert -> Indicators -> Oscillators -> Stochastic Oscillator .
The first thing the trader will see is the Stochastic settings window, in which we see 4 tabs:
- "Options" tab;
- "Colors" tab;
- “Levels” tab;
- Display tab.
Options Tab
The “Parameters” tab of the Stochastic indicator contains the most important data. This is where the basic setup takes place, which includes the following items:
- Period %K – number of periods n for stochastic calculation;
- Period %D – period of the moving average in relation to %K;
- Ease is the %K smoothing parameter. In other words, adjusting the sensitivity of the indicator;
- The MA method is a type of moving %D;
- Prices (choice of Low/High and Close/Close) – this is the price level from which stochastics will be calculated from minimums/maximums (including shadows) or from closing prices (without shadows).
Colors Tab
Setting line colors is not the last point in achieving success. Here you can customize the colors and line style that will be comfortable for your eye.
Levels Tab
As mentioned above, by default, the indicator has two levels: 20% and 80%. From 0 to 20, is considered an oversold zone, from 80 to 100, an overbought zone. The parameters were selected by the author of the indicator and have been confirmed more than once, but in any case, you can change these values to those that interest you.
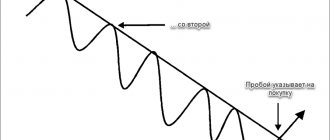
Trading using stochastic crossover signals
The second most used stochastic signal is the crossover signal, which occurs when the %K line crosses the %D line and generates a buy signal. On the other hand, when the %K line crosses the %D line, a sell signal is generated.
These stochastic crossover signals are quite reliable in a range-bound market, but these signals tend to become much less reliable when the market is in a strong trend. However, you can still rely on stochastic crossover signals as a trend continuation signal and to open additional positions.
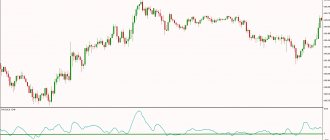
In the figure, the trading instrument is in an uptrend, and the stochastic has generated a cross buy signal. This indicated that the uptrend was likely to continue and the market continued to rise. Likewise, if you see a crossover sell signal during a downtrend, you can also rely on that signal as supporting evidence that the downtrend is likely to continue.
This type of trend continuation signal tends to be reliable during trending markets. However, you should exercise caution and apply additional filters before trading against the trend using the stochastic crossover signal.
Application of Stochastic Oscillator
The Stochastic indicator can be called a universal tool.
It can be used as:
- independent analysis tool;
- one of the working elements of a more complex strategy.
Whatever option the trader chooses, the strategy must be tested before entering the exchange.
Example - Forex Strategy “Fibo+Stochastic”:
Stochastic indicator and divergence
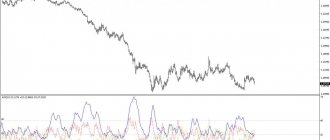
When the price makes a lower low but the stochastic shows a higher low, it is considered a bullish divergence signal. When the price makes a higher high but the stochastic shows a lower high, it is considered a bearish stochastic divergence signal.
As you can see in the figure, the price continued to decline while the stochastic continued to move up, resulting in a classic bullish divergence.
A few days later, the stochastic gave a bearish signal, the %K and %D lines continued to decline while the price reached a new high. This type of market condition is known as bearish divergence.
When you spot a divergence, you should rule out the stochastic oscillator crossover signal as they often turn out to be false. For example, in the figure, the first few stochastic oscillator signals generated during a normal bullish divergence turned out to be false.
Therefore, if you see a divergence, the best way to enter the market is to use a second non-correlated technical indicator or price action signal.
Hidden divergence is a signal of trend continuation. If you learn to combine a crossover signal with a hidden divergence, you can get some good trading opportunities.
Hidden bullish divergence occurs when price makes a lower low but the oscillator makes a lower low. Conversely, a hidden bearish divergence occurs when the price makes a lower high but the oscillator makes a higher high. For example, in the figure, the stochastic value fell below the previous low, but at the same time, the low price was higher than the previous low, which led to a hidden bullish divergence.
One approach to using a stochastic for a trend continuation or hidden divergence signal is to combine it with a crossover signal. When the market generates a hidden divergence signal and a stochastic crossover occurs, the combination of these two factors can result in a trading setup with a high probability of profit.
Basic signals of the stochastic oscillator
The interpretation of stochastic signals is similar to the interpretation of the RSI line. These are overbought and oversold situations (in this case, however, the values of the levels are: 80 and 20), and the search for potential divergences. Unfortunately, when studying the movements of stochastic lines, such powerful tools in the case of RSI as the search for graphical figures (triangles, flags, heads and shoulders, etc.), levels and trend lines are usually not used.
But what distinguishes the stochastic from the RSI is the additional line that adds a truly valuable ingredient to this oscillator. However, some traders do use levels, trendlines and patterns for stochastics, so experiment: after all, stochastics and RSI are similar.
- Divergence.
The best signal from a stochastic oscillator is considered to be divergence or discrepancy between the %D line or %K line and the price. When the price makes a new lower low and the oscillator makes a higher low, there is a divergence and a good buy signal. Each trader must determine for himself which line to take to determine divergences. At the same time, as can be seen in the illustration, it is worth taking only divergences formed inside the overbought/oversold zones - they are more reliable.
By the way, short and long divergence are distinguished separately. The short one takes a period of 3-7 bars (as in the picture above), the long one is more extended in time.
2. Overbought and oversold levels.
By default, levels 80 and 20 are taken as overbought/oversold levels.
Stochastic oscillators work best on wide price ranges or soft trends with a slight upward or downward bias. The worst market for normal use of stochastic oscillators is a market that is in a strong trend and is subject to only minor corrections.
In the case of a stable strong trend, the stochastic oscillator may remain behind the overbought/oversold levels for a long time, so the indicator crossing these levels is a bad signal for entering a position:
The reverse intersection of these levels by the indicator can be a signal to enter during a correction to the main trend, while Fibonacci levels can serve as a good filter:
In the figure above, at point 1, the stochastic is already signaling an opportunity for sales. At the same time, the price has not yet reached the Fibonacci level of 38.2% of the previous movement (for different pairs these values must be determined empirically depending on the volatility of the pair, on average from 38.2% to 61.8%), saving us from premature entrance. At point 2 the price reached the level of 38.2%. At point 3, a divergence formed, after which the main and signal lines of the indicator crossed.
3. Zero line 50.
Based on the indicator formula, it is quite obvious that when the stochastic is in the range from 100 to 50 most of the time, there is an upward trend and vice versa for the range from 0 to 50. Moreover, you can even enter the market when the stochastic crosses the 50 line. A To make the inputs sufficiently accurate, you just need to take a sufficiently large period of the indicator:
As you can see, this option of using the indicator alone can become a completely profitable trading strategy in itself. In the picture above, the red circles are the places where the indicator crosses the 50 line - potential entries into the deal. Green circles are the recommended exit from the trade (exit from the overbought/oversold zone. Blue circles are an option for additional entry into a position upon a rebound from level 50 (entry after crossing the main and signal lines). The orange circle (the only one in the picture) is a false signal that could lead to some losses, which are nevertheless fully compensated by profits.Transactions in the example for the period from January 2009 to February 2012 on the daily chart of the eur/usd currency pair brought a total of 4350 old points, which is with a deposit of 1,000 dollars and trading a fixed lot of 0.1 over these three years will bring $4,350 in profit with a maximum drawdown of $180.
But the point is not in the numbers, but in the fact that any method of trading stochastics can actually bring profit with the right approach, patience and consistency. Pay attention to how simple this TS is, even if it does not pretend to be complete and was born in my head during 3 minutes of contemplating a chart with the stochastic indicator.
4. The intersection of the main and signal lines.
The main signals of the stochastic oscillator are the intersections of the %K and %D lines. Any intersections should be analyzed within overbought/oversold zones.
There are right-sided and left-sided intersections of lines:
In the picture above, there is a left-hand intersection on the left, and a right-hand intersection on the right. The right-hand crossing is considered more reliable.
There is another interesting feature of analyzing the intersection of the main and signal lines - failure when trying to exit the overbought/oversold zones. The figure below identifies two such cases, which usually lead to further prolonged growth or decline (to a fall for the examples given). The main line crosses the signal line in the overbought/oversold zone, and then turns around - the bulls/bears did not have enough strength. As a rule, the indicator continues to move within the zone for some time while the price continues its movement. To avoid such cases when using any of the stochastic signals, I always recommend waiting for the indicator to exit the zone.
Using this little secret of using stochastics, I once came across an entire trading system, using which a trader traded quite successfully (unfortunately, I didn’t remember the details). I am sure that few people would think of using an indicator like this. By the way, this option came to the mind of such a famous trader as Alexander Elder. In one of his books, he calls this technique a “stochastic jump,” explaining this phenomenon as the last price impulse before the trend changes.
It is also worth paying attention to the shape of the indicator’s minimums and maximums in overbought/oversold zones. If the low is sharp, the bulls are strong and the movement will be rapid; if it is rounded, then the upward movement will be sluggish.
In the picture above, wide spreads are highlighted in red, narrow ones in green.
5. Direction of stochastic lines
Typically, the stochastic fluctuates from the overbought zone to the oversold zone and back. Also, it often changes its direction when approaching level 50.
That is, it turns out that if the stochastic has left the oversold zone, then it will most likely reach the level of 50 and, possibly, the level of 80.
Also, when leaving the overbought zone, the indicator will most likely reach the level of 50 and, possibly, the level of 20. Accordingly, if the stochastic is directed upward on the daily timeframe and is located between 20 and, say, 30, it is logical to assume that the indicator will reach the level of 50. For of the D1 period, this indicator move from 20 to 50 may take only a couple of candles, but on the H1 timeframe this movement will look like a full-fledged trend. I hope you get my point: you can predict price movement in lower periods by analyzing the direction and location relative to stochastic levels in older periods.
This option is also often encountered: when the level 75 is reached on the daily charts, the trader on the hourly chart looks for an entry point into purchases. With a high degree of probability, the stochastic on the daily will reach the level of 80 and above, which on the hourly timeframe can bring significant profits. According to Jake Bernstein, half of the strong market moves occurred when the stochastic broke the 75 and 25 barriers.
How else can you use the stochastic indicator?
Have you ever looked at a chart and noticed that the stochastic indicator is in the overbought zone? You immediately go short because you think the market is about to turn around and go down. But the market instead stands still for a while, and then the price begins to rise. Are you overwhelmed by the stop and don’t understand why the stochastic didn’t work as it should? In this guide, we will talk about when to rely on this indicator and when not to.
You can use the indicator settings (20, 1, 1) and it will display one line instead of the traditional two.
We will use a period of 20 because there are 20 trading days in a month, and one line is enough to track the indicator readings.
Briefly what we learned
- Stochastic is an oscillator and can predict price movements based on the principles of market waves and impulse movement.
- It is good in flats, but produces a lot of noise during a trend.
- Overbought on the stochastic oscillator can indicate both the completion of the upward movement and the strength of this movement. The same goes for oversold conditions.
- It is better to use the stochastic oscillator in combination with trend indicators.
- The use of technical analysis tools and other data tips above significantly increases the effectiveness of stochastic strategies.
We didn't look at specific strategies. But we did better: we sorted all the information into pieces and now we can create our own trading system. Well, or apply the one described on this site if you are a swing trader. Now answer in the comments:
- How do you like the review – just be honest?!
- Which trend indicator do you prefer to use the stochastic oscillator with?
Thank you for your answers and attention. Happy bidding!
The Two Biggest Mistakes Traders Make Using Stochastics
Traders open a long or short position because the indicator is in the oversold or overbought zone.
Stochastic only shows the price acceleration relative to the current range. For example, if it is beyond the 80 zone, the market is dominated by strong bullish momentum. But in this situation you should not open short positions.
In the picture above you can see that if you were to go short, you would fail. Moreover, the market has been in an overbought state for quite a long time.
Many traders also think that the price will reverse due to divergence appearing in the market.
Divergence occurs when the price reaches a new high and the indicator shows a new low - the two signals are different from each other.
However, the price does not always reverse at divergence.
Binary options strategies with Stochastic
Binary options are an easier way to make money compared to Forex, since the trader only needs to guess the direction of price movement (up or down relative to the current level). Therefore, it is from them that you can begin to develop the market.
Moreover, it is quite possible to use strategies based on Stochastic and other instruments on binary options. In this case the rules are:
- Signals for a BUY order can be used to open a CALL option to increase the price.
- Use signals for a SELL order to open a PUT option to lower the price.
The expiration date (duration) of a transaction is determined as the time frame value multiplied by 5. For example, if you work on M5, then 5 * 5 = 25 minutes. This is exactly what the expiration date should be.
Thus, the Stochastic indicator is a simple and effective tool that allows you to make money on both Forex and binary options. However, by itself it often gives false signals. Therefore, it is recommended to use it together with other indicators.
We also recommend that you read the detailed instructions on how to set up stochastics for different timeframes.
How to use stochastics correctly?
Traders fail with stochastics because they don't take market context into account. What does it mean? It's simple. Trade with the trend, not against it. If you look at the examples above, the trades there were opened against the trend, which is why they failed.
If the price is above the 200 period moving average, look for long trades when the stochastic is oversold. If the price is below the 200 period moving average, look for short trades if the indicator is overbought. The indicator signal will show you the possible end of the rollback and give you the opportunity to enter a trade along the trend.
If you want to trade successfully, be sure to pay attention to the higher time frame and trade with it, not against it.
You use stochastic to filter your trades. Want to go short on the 1-hour chart, but before doing so, open the daily chart and look at the price action from above. You need to make sure that there is no uptrend on the daily timeframe and the indicator is not in an oversold state. Because otherwise there is a high probability that the market will bounce up.
But if you look at the higher timeframe, you will see that the market is in a downtrend and the stochastic is overbought. Therefore, the chances are much higher that the market will continue its downward trend, and you should not enter a long trade here.
What does stochastic measure?
The stochastic oscillator is an indicator of the rate of change or momentum of price. Stochastic measures the speed of the market by determining the relative position of closing prices in the range between the high and low over a certain number of days. The simplest oscillator takes the current price and subtracts from it the price that was several days ago. Let's assume that trading on the EURUSD pair closed today at 1.2050, and 10 days ago at 1.2000. In this case, the oscillator value would be 0.0050. The process is repeated every day and the data is plotted on a graph.
For example, the 14-day stochastic indicator measures the position of closing prices within the entire range between the high and low of the previous 14 days. The stochastic expresses the relationship between the closing price and the high-low range as a percentage between zero and 100. A stochastic oscillator reading of 70 or higher indicates that the closing price is near the top of the range; A stochastic reading of 30 or below means the closing price is near the lower end of the range. That's all. Simply put, if you see a figure of 50%, it means that the closing price lies exactly halfway between the maximum and minimum. If the indicator is 75%, then the closing price is between the maximum and minimum at the level of 75%. In other words, it would be at 75% of the day's range, or closer to the high than the low. Thus, if the market closes at its maximum every day, then you can only see an indicator equal to 100% on the stochastics. The main idea is that if the market tends to close at the top of the daily range, then it is bullish, if at the bottom, then it is bearish.
Oscillators will report a market reversal before the price actually changes, as changes in momentum lead to changes in the actual price. The same thing happens in physics: the rate of change of an object's speed will show a decrease in momentum until the object changes direction.
A major criticism is that oscillators sometimes give a trade signal when the market is in a strong trend and the signal turns out to be false. It is known that oscillators perform well in non-trending markets and poorly in trending ones. The simpler the oscillator, the more sensitive it is to changes in the current market price. For example, a simple oscillator based on a 10-day rate of change is more sensitive to changes in the current price than an oscillator based on a 30-day rate of change.
Many analysts have suffered greatly from using simple oscillators and have tried to improve them. Stochastic shows the position of each closing price in the previous interval of maximum and minimum prices. Stochastic is more complex than Williams' %R. It has several steps to remove market noise and suppress bad signals. Stochastic consists of two lines: a fast one, called %K, and a slow one, called %D.
The most common and classic formula for calculating Stochastic is the following:
where max(Hn) – maximum high for N – periods
min(Ln) – minimum Low for N – periods
C0 is the closing price of the current period.
those. moving average with period M from %K
This version of the Stochastic indicator calculation is used in most technical analysis programs.
However, several other variations are known, for example:
Where
– moving average with period N from the minimum price for the last 3 periods
– moving average with period N from the maximum price for the last 3 periods
How to use stochastics to find the best entry points?
Your understanding of price movement on a chart or interpretation of candlestick patterns may be subjective, but the meaning of an indicator is always objective. If the indicator gives an entry signal, we enter; if there is no signal, we remain outside the market. So if you are one of the traders who are always hesitant about when to enter your trades, this technique is for you.
If the market is in a strong uptrend, enter trades when the indicator line crosses the value of 20. If the market is in a strong downtrend, enter trades when the indicator line crosses the value of 80.
As we know, stochastic measures the acceleration of price movement. So when you see the indicator cross the 20 line, it tells us that there is bullish momentum.
This technique is not a trading strategy; it can only show you possible entry points. It's important to remember this.
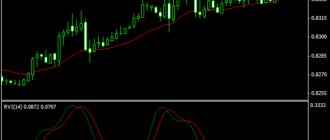
Trading using Stochastics, RSI and Moving Average
These three tools work great individually, but together they allow you to create a profitable strategy with fairly accurate trading signals. Just like the stochastic, the RSI (relative strength index) is an oscillator. Together, these tools filter out market noise, and the moving average MA line shows the general direction of the market. Let's look at a simple trading strategy based on these three indicators.
Setting up a schedule
Install instruments on the chart with the following settings:
- Stochastic oscillator. Leave the settings as standard (%K = 5, %D = 3, slowdown = 3).
- RSI with a period of 7. Leave the level values as standard – 30 and 70.
- Moving average line MA with a period of 21.
The strategy works best on the 4-hour chart. The currency pair can be any of the major and volatile assets. We will look at trading using the GBP\USD pair as an example.
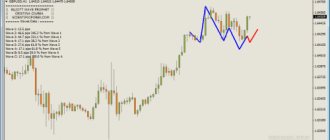
Signals
A buy trade should be opened when the stochastic leaves the oversold zone, breaking through level 20 from the bottom up, and at the same moment the RSI breaks through the level of 30 in the same direction. The moving average line should be directed upward, which indicates a bullish trend. The order is opened immediately after the signal candle closes.
Important! A candle is considered a signal if at the moment of drawing both oscillators left the oversold zones.
A sell transaction can be concluded at the moment when the stochastic leaves the overbought zone, breaking through the 80 level from top to bottom. At the same time, the relative strength index should also leave the overbought zone and cross level 30 from top to bottom. The moving average line is moving down, indicating a downward trend.
This trading method is conservative, so the risk of catching a false signal is very small. Adherents of aggressive trading enter the market immediately at the moment when the oscillator lines change their directions. At the same time, they do not wait until the curves leave extreme zones. This approach is riskier, but often allows for more profit.
Recommendations
Instead of the MA, you can use the Bollinger Bands indicator to determine the trend. In this case, the trend is determined by the position of the price line relative to the central Bollinger band. If the line is above the average level, then the trend is bullish and only buy transactions are considered, and if below, then the trend is bearish and only sell transactions are considered.
On timeframes below H1, it is recommended to open positions at the moment when the price rebounds from one of the extreme Bollinger levels. This will be an additional filter for oscillator signals. You can also test other Bollinger trading strategies.
We do not use the stochastic indicator in a sideways market.
If you have already read any articles, books or taken courses on trading, they all say that it is best to use the stochastic indicator in a sideways market. Because you can expect a short entry point when the indicator indicates overbought.
The indicator accurately shows us the boundaries of the trading range. But do we really need this? After all, even without an indicator everything looks quite obvious. We buy at the support level, sell at the resistance level. And we get exactly the same results.
It turns out that stochastics do not have to be used in trading ranges. It just clutters up the schedule.
Calculation formula
Principle. The stochastic formula is designed to show the percentage ratio of the closing price of the current candle to the trading range for a certain period. Calculation example: the current candle closes at $49. Over the last 5 candles (period 5), the maximum is at $50 and the minimum is at $40. Therefore, the closing level is now at 90% of the entire trading range for 5 candles. This level is stochastic and will be displayed on its scale.
The formula for calculating the stochastic indicator itself is as follows:
%К = (Current closing price – N minimum) / (N maximum – N minimum) *100%, where N is the period or number of bars taken into account.
%D = 100 * ((K1 + K2 + … + K n) / n) or simply SMA for n periods %K.
Interpretation. It is known that when a stock begins an upward wave, the candles close near their highs and rise up, as if on steps. At this time, the stochastic lines rise towards 100%. As soon as demand from the bulls falls, the candles close near the middle of their ranges. The indicator shows curves rounding at the top (overbought zone). And when the supply from the bears exceeds the demand from the buyers, the candles close down and the stochastic oscillator moves towards 0%.
Let's sum it up
When used correctly, the stochastic indicator can help you better assess price movements in both trends and consolidations. For example, the indicator is capable of generating reliable buy or sell signals during a range-bound market, as well as signaling hidden divergences in a trending market.
Although the crossover signal does not work very well as a reversal signal during a strong uptrend, it can be quite reliable as a reversal signal with regular divergence.
Stochastic in the main chart window
This indicator is often located in the lower window of the price chart. But there is another variation of it, when it is located on the main price chart in the required channel. His presence in this place does not change his work.
This option is configured in exactly the same way as the usual stochastic. Filtered signals can also be used in the standard version - divergence, change of direction of the main line and intersection of its levels.