To bookmarks
Hello, dear fellow traders!
In this article, we will plunge into the world of computer analysis and remember one of the most popular technical indicators - the fractal indicator.
Traders around the world first learned about it from the book “Trading Chaos,” authored by Bill Williams. It was published in 1995 (by the way, the 2nd edition was published in 2003) and truly became one of the most famous and best-selling in the world! In it, B. Williams shares with the reader his understanding of the market, methods of its analysis and making trading decisions. Reflects on the topic of what a fractal dimension, fractal geometry and Mandelbrot sets are (though I still don’t understand why I need this knowledge and how to apply it in practice).
But still, this article is not devoted to the book, but to the technical indicator, so I will allow myself to finish with the reasoning and get to the heart of the matter.
Description of the fractal indicator
Only by chapter 11 of the book does Bill Williams begin to introduce us to fractals. He says that there are two types of fractals: buy (fractal up) and sell (fractal down), and also gives their definition:
- A buy fractal is a sequence of five bars (candles) in which the high of the central (third) bar is higher than the previous two and two subsequent bars.
- A sell fractal is a sequence of five bars (candles) in which the low of the central bar is lower than the previous two and two subsequent bars.
This figure depicts the so-called “classical” or “pure fractal” . Its peculiarity is that the highs (lows) of the first two bars consistently increase, the third bar forms the highest extreme, and the highs (lows) of the fourth and fifth bars consistently decrease. This type of fractal is very easy to visualize. To do this, you just need to look at the palm of your hand.
Since the maximums (minimums) of subsequent and previous bars can take on any values, provided that they are not higher (lower) than the extremum of the central bar, several more types of fractals can be distinguished:
- Example “B” shows a bar that is both a buy and a sell fractal.
- Example “C” shows that multidirectional fractals can have common bars.
- In example “D” we see that sometimes more than 5 bars are needed to form a fractal, provided that the extremum of one of the subsequent bars is equal to the central one.
Purpose
The function with which the indicator works on the securities market is an established fixation for reading the activity of traders on the securities market. This indicator is also capable of determining and has a strong influence on the speed of investing financial assets in a common monetary asset.
When developing a new algorithm for the trading indicator, the developers tried to look at and analyze small financial flows. Among other things, this is an important universal tool that works to increase the speed of trading and to calculate the accuracy of entry points into the financial services market.
The indicator under the designation Fractal can be effectively combined with monetary instruments and trading methods, as well as easy and difficult to understand trading mechanisms. The list of these systems includes the “Sniper” trading strategy; this strategy has become famous in the market in just a few months and allows each player on the exchange to increase their cash deposit by an average of 54%. The essence of its application is clear even to an inexperienced user.
How to use the fractal indicator
We have found out what a fractal is, and now we should talk about how it can be applied in your trading practice in order to make a profit from the market. There are several methods for using the fractals indicator in trading. Let's talk about each of them in more detail.
Trading on fractal breakout
This is a classic method proposed by Bill Williams in the book “Trading Chaos”. As the name suggests, trading is breakout in nature and is designed to continue the current trend. Entry into a trade is carried out with pending stop orders for a breakout of the fractal closest to the price.
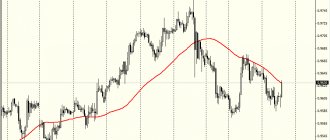
As the author himself writes, this trading method will give many false entries, so Bill suggests filtering signals using the Alligator indicator (this is another author’s development, which, along with fractals, is part of the Profitunity strategy). I will not dwell in detail (within the framework of this article) on the Alligator and the Profitunity strategy, because it is based on as many as 4 indicators (fractals, AO, AC and alligator), and you must first understand the principle of operation of each indicator separately, and then move on to the rules of strategy.
But still, in a nutshell, the Alligator is a set of 3 moving averages. When the price is below the “red” line (line of teeth) of the Alligator, we use a fractal sell signal. If higher - buy:
In principle, the Alligator indicator can be replaced with ordinary moving averages and also used as a filter. But I repeat that it makes no sense to consider fractals and the Alligator in isolation from Williams’ other tools, so we will not dwell on this and move on.
Fractals as resistance support levels
If you have at least once encountered support/resistance levels, then you know how difficult it is to build them. And all this complexity arises due to the subjectivity of this instrument. That is, when we build PS levels, we cannot say with certainty whether we built them correctly or not. Bill Williams with his fractals gives us an excellent tool for finding and building significant support and resistance levels.
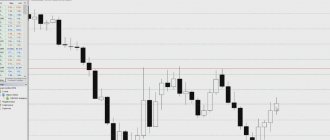
Let's put the indicator on some chart and analyze it from the point of view of SR levels?
This is a chart of Surgutneftegaz shares with a classic 5-bar fractal. Yes, the graph is simply full of these arrows. What kind of support-resistance levels are there?! If you draw a horizontal line through each extreme point highlighted by the indicator, then the graph will not be visible!
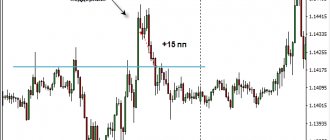
Everything is true, but let’s not be so categorical. After all, no one forces us to use the “default” indicator settings? Let's increase the number of periods, say, to 31 and look at the result:
As you can see, the chart has become practically clean and only really significant extremes remain, through which levels that are quite suitable for trading can be drawn. Pay attention to how the price “respects” and works through these levels. I am sure that in the future, when the price approaches them, we will again see the price reaction to them.
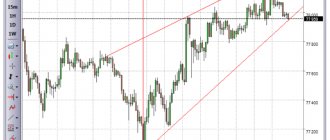
Fractals and trend lines (guides)
Another pretty good method of using the fractals indicator is to determine reference points for constructing guides (trend lines):
I added the indicator to the chart, increasing the number of bars in the settings. And I drew several trend lines through some fractals. Indeed, the lines turned out to be interesting and the price interacts well with them. Naturally, a trader should have basic knowledge in the field of technical analysis and drawing trend lines. But I am sure that this indicator will be a good help for a novice trader in practice.
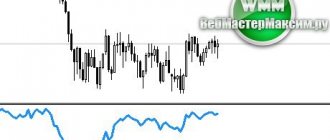
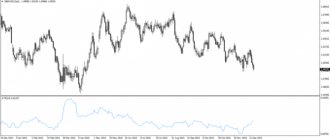
Determining a trend using an indicator
With the help of fractals we can also determine the prevailing trend in the market. It's very easy to do. If you and I recall the definition of a trend, which states that an upward trend is a sequence of growing local maximums and minimums, and a downward trend is a sequence of decreasing extremes. Let's add our indicator to the chart:
And we will see that in an uptrend, buy fractals will be updated (break through) more often than sell fractals. To determine the trading range (flat), the upper and lower fractals must be located approximately at the same levels and not be updated.
Books on fractal market analysis
Several books are devoted to fractal analysis of markets, among which the most famous are the following:
- “Fractal Analysis of Financial Markets” by E. Peters - in this book the author tried to explain the theory of fractals and talk about its action in relation to markets. For example, he draws readers' attention to the inconsistency of some hypotheses, discusses market volatility and the application of physical laws to its determination. One can note a somewhat mathematical bias in the presentation, as E. Peters himself said, and some distance of the author from the practical application of fractal theory; E. Peters focuses on the theoretical explanation of fractals. Therefore, most likely, this book will not bring tangible benefits to a novice trader.
- “Unruly Markets: A Fractal Revolution in Finance” by B. Mandelbrot - this book, like the previous one, is aimed at developing a theoretical framework, and will be most useful to professional financiers, rather than novice traders. The advantage of this book is that the fractal concept is presented by its immediate author.
- “Fractal theory” by A. Almazov - in his book he talks about the Elliott wave theory and makes small psychological digressions, which makes reading much more interesting; A. Almazov provides a lot of graphic material. In general, this book is aimed at the practical use of fractal theory in practice. Some traders believe that Almazov's work may be a little difficult for new traders, but still, compared to other books on similar topics, this book is quite easy to understand.
Fractal market analysis can become an indispensable assistant for a trader. If you skillfully use the capabilities of fractal theory, you can predict the future market picture in advance.
We recommend that you further familiarize yourself with the Bill Williams Alligator indicator, which is often used in conjunction with fractals when trading forex.
See also the video on the topic of the article - Basics of fractal analysis
Previous
Trend trading strategy “Elder’s Three Screens”
Next
Indicators for gold for the Meta Trader terminal
I recommend reading:
- Weekly Forex strategies: chart analysis and signals
- Trend strategies for Forex
- Trading strategies on m15 for Forex
- Forex volatility indicators
- Macd + Stochastic strategies for Forex
- TPO Range indicator for Forex trading
- Large time frame in Forex and BO: indicators and strategies
- Timeframes in Forex - what are they and why are they needed?
- Three moving averages - trading strategy for Forex and BO
- FDM entry arrows with alerts indicator for Forex
- Stable trading systems for the Forex market
- Indicator-less trading strategy "Oracle" for Forex
- Forex trading system Easy prey pips
Fractal indicator in the QUIK trading terminal
The QUIK trading system is the most widespread on the Russian stock market. This software includes a fairly decent number of technical indicators, including the fractals indicator we are considering. In order to add it to the chart, you need to: in the main menu, select the menu item “Actions” - “Add chart (indicator)”:
Find “Fractals” in the list of available indicators and click on the “Add” button. In order to change the number of periods, you need to open the “Edit chart settings” window (don’t know how to open this window? Read this article) and go to the “Options” tab:
What is this easy-to-use indicator?
It represents the minimums and maximum moments achieved by the world economic market for each passed period of time, while outwardly creating a completely understandable picture even for a beginner. Everyone will be able to understand and learn how to trade using so-called fractals.
In this case, fractals are usually externally highlighted with the help of pointers directed towards the rise or fall of prices, which, however, strongly influence the types of extremes on the chart (the same designated fractal bottom is a red or orange pointer for a more understandable reading of indicators, as well as a fractal going to the bottom point on the graph.
A fractal going up has a noticeable green pointer, and a fractal going down, as already mentioned, has a red or orange pointer). The indicator for trading on the Fractals exchange usually goes directly towards the price marks of the security being analyzed.
The fractals indicator in the Meta Trader 4 trading terminal
Bill Williams indicators do not require installation and are included in the standard set of indicators available to the trader out of the box. In order to attach the fractal indicator in the Meta Trader 4 terminal to the chart, you must: in the main menu (or in the “Navigator” window) select the menu item “Insert” - “Indicators” - “Bill Williams” - “Fractals”:
Fractal indicator with period settings
The standard indicator for MT4 does not have any settings except color ones. Its use with a period of “5” negates all the capabilities and advantages of this instrument. But for Meta Trader there are many custom (custom) indicators that will help solve our problem.
For example, these:
Here is the link:
Content for registered users only! Register on the site to access the content.
Conclusion
Now, friends, we have reached the final part of the article. It's time to summarize the material covered and take stock.
I tried to tell you as much as possible about the fractal indicator. You learned what they are, the story of how they got into trading, and how to use them in practice. In my opinion, this is a very interesting tool that is definitely worth your attention! However, I would not recommend using this indicator in its classical interpretation. In it, it is presented as a classic breakout type trend indicator, designed to “catch” large trend movements. It may work on higher time frames of the stock market, but it is unlikely to show good results on short-term futures and foreign exchange markets.
However, you shouldn't discount it. I showed you several interesting ways to use, no matter how paradoxical it may sound, a technical indicator in indicator-free price action trading, including determining the trend using the fractals indicator, constructing support-resistance areas and trend lines.
If you still have questions after reading the article, or maybe you have practical experience using Bill Williams’ tools, be sure to write in the comments. That's all. Thank you for your attention and good luck in trading!
Best regards, Vadim Atroshchenko
Forex trading strategy using fractals on the daily chart
This strategy is also suitable for EUR/USD and other volatile assets.
It is used on the daily timeframe, so signals do not arrive as often, although their accuracy is high. In addition, in one transaction you can earn not tens, but hundreds of points. An interesting feature of the strategy is that it uses only the Williams fractal indicator, and all parameters are left unchanged. Trading signals are simple:
- upper fractal – the asset can be sold;
- lower fractal – the asset can be bought.
It is recommended to open an order immediately after the formation of a fractal. There is no point in waiting extra time, as you could lose a significant part of your profits. Next, you need to observe the trend - if it is quite strong, the position is held for 3-5 days, and if it is weak - on the same day (the price should move 80-100 points). In both cases, it is more profitable to close an order at the end of the trading session, i.e. In the evening.
For additional signal filtering, you can add classic resistance and support levels to the chart.
We also recommend learning a few more simple daily Forex strategies.