A bond yield curve is a graph showing the percentage yield of debt securities as a function of their maturity. Usually there is a comparison of bonds of one issuer (for example, government securities) or several, but belonging to the same sector (financial, oil, metallurgy).
In simple words, an investor can look at the chart to assess the attractiveness (profitability) of certain securities and choose more profitable ones for purchase.
The classic bond yield curve can have two forms:
- normal or classic;
- inverted.
Normal yield curve
The longer the maturity of bonds, the higher their yield. This is due to the fact that investors buying long-term securities (5-10 years and above) bear higher risks compared to holders of short-term (1-3 years) securities. Increased risks are associated with uncertainty in the future. This comes with a risk premium in the form of a slightly higher return.
The graph is typical for a healthy economy. When participants expect further acceleration of economic development and rising interest rates in the future.
Inverted yield curve
Typically, this picture can be observed at the time of financial crises and (or) the expectation of lower interest rates. At this time, there is a demand for “short” money.
In such a situation, you can purchase long-term securities and fix the current profitability for many years.
High yields on short bonds are a temporary phenomenon. And at the end of their life, if the interest rate falls, it will no longer be possible to invest money at the same interest rate. But owners of long-term securities, losing in profitability in the first years of ownership, gain in the long run.
A small example from reality. Bond yields directly depend on the Central Bank rate. Just like bank deposits. If the Central Bank raises the rate, then issuers will be forced to give higher yields when issuing new bonds. The yield of securities already traded on the market will be adjusted after the Central Bank changes the interest rate. To match the exchange average.
How can the yield of already issued securities change? Due to changes in market value.
The dependency is as follows:
- when the Central Bank rate increases, the market value of bonds decreases;
- When the interest rate decreases, the market price of bonds increases.
When, during the crisis, the Central Bank raised the interest rate by 1.5 times to 18%, new bond issues, focusing on it, were forced to set a similar yield. And securities with a yield of 15-20% per annum were placed on the stock exchange. Over time, each new issue yielded a higher coupon rate.
In theory, old issues with low interest rates are no longer needed. Why buy securities with a yield of 10% per annum when there are bonds of the same issuer, but giving 1.5 times more profit.
To compare with the current yield, the market price of old securities begins to decline. And while the Central Bank rate was rising, bond prices were falling.
After some stabilization, the Central Bank began (and continues) to systematically reduce the interest rate. And what do we have on the market?
New securities are issued each time with a lower yield. And old issues are gradually becoming more expensive.
Using government bonds as an example. During the time the Central Bank increased the interest rate, paper quotes decreased by almost 2 times. And although the owners received fixed coupon payments (7% of the face value of 1,000 rubles), the profitability was much lower compared to new issues.
When the Central Bank begins to lower the interest rate, the price of securities begins to gradually rise. The coupon we pay to paper holders is beginning to approach the market average. And the market price has almost reached pre-crisis values.
If the Central Bank rate continues to be reduced, we will see a further increase in the market value of OFZs.
Where can I see the yield curve?
A chart of zero-coupon yields on government bonds or OFZs is available on the Central Bank website or by following the link.
And the numerical values of the yield-to-maturity curve.
The downside is that using this chart you cannot see which specific securities provide profitability.
On the Cbonds website (registration may be required) you can view the yield curve of bonds of various countries and economic sectors.
And on the chart, analyze and find specific securities with the required yield and maturity.
If you again take government bonds (OFZ) with a maturity within 10 years, you can easily make a visual assessment. When you hover over any security, a hint appears about the name and yield of the bond.
In addition, you can independently construct a yield curve in the trading terminal itself (QUIK).
Literally in 3 steps:
- In the menu: “Create window” - “All types of windows” or press F7
- Select in “Other” - “Yield graph”
- We select the necessary papers based on which we need to build a chart (all or part).
Let's take Eurobonds as an example. Select T+ Bonds (calculated in USD). And move it to the “Selected Tools” window.
For better display, we will limit the yield of the displayed securities to 6.5% per annum (to exclude default bonds).
We display a graph of Eurobond yields.
Gazprom Eurobonds with maturity in 2037 look interesting. At current market prices, you can receive 5.5% per annum. Exactly in dollars.
Characteristics of American government bonds
The denomination of US bonds is the amount that the investor provides to the US government and which will be returned to him after a certain period of time. This period is called the bond circulation period. Until it expires, the investor can make a profit from owning the security at the coupon or sell it on the secondary market.
However, in most cases, the holder of a government bond cannot request early return of the invested amount, with the exception of the purchase of some long-term Eurobonds.
The market value of a US government bond depends on the circulation period of the paper: the shorter it is, the closer to its face value its price.
What does a yield curve tell an investor?
- Quick analysis and search for profitable offers. The yield chart allows you to identify undervalued securities from the total mass of those traded on the market. When there are several dozen or even hundreds of offers in the list of available papers, it is very difficult to compare them. Especially considering that they all have different yields and maturities. Looking at the profitability chart, the investor sees the whole picture.
- The slope of the curve tells the investor which security is better to take at the moment. During a period of rising interest rates (normal yield curve), it is better to take short securities. Since “new” securities entering the stock exchange will have a higher yield. And “old” bonds will lose value over time.
- If there is a downward trend in interest rates (inverted curve), it will be more profitable to invest in long-term securities, fixing the current yield. Additionally, if the overall percentage of return on the market decreases, the investor will receive a profit due to the increase in the market price of his securities. Ideally, when rates stop falling, it is better to sell all assets (much above par value) without waiting for repayment. And buy short securities with current yields.
Treasuries - investments with minimal risk
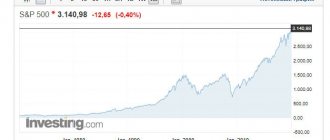
US bonds are one of the safest investment instruments. The positions of these securities in exchange trading are an indicator of the state of the entire stock market as a whole, an assessment of its risks and profitability.
For any investor, the inverse relationship between profitability and risks is obvious. And since the credit rating of the United States of America is at the maximum level - AAA - the yield on US Treasury bonds will not be high.
US bonds are attractive to large investors and those who want to diversify their securities portfolio as much as possible and reliably hedge risks
Who is the main holder of US bonds?
The largest holders of treasuries are the central banks of different countries - in total they own government bonds worth about $6.5 trillion. At the same time, the leaders in terms of volume are (in billions of dollars):
- China – 1138 (18.37%);
- Japan – 1018 (16.43%);
- Brazil – 313 (5%);
- Ireland – 287 (4.6%);
- Great Britain – 264 (4.26%);
- Luxembourg – 225.4 (3.64%);
- Switzerland – 225 (3.63%);
- Cayman Islands - 208 (3.36%);
- Hong Kong - 185 (2.98%).
Until 2021, Russia was in 16th place in terms of the volume of US government bonds it owned, but after the introduction of sanctions against it, it methodically got rid of American debt. Now the Russian Federation has “only” $20 billion worth of treasuries (for comparison, at the end of 2021 there were 102).
Also large holders of US government debt are pension funds, mutual funds, commercial banks, large private investors and the Americans themselves (referred to in reporting as “households”).
The Fed deserves special mention. The Federal Reserve has been purchasing Treasuries since 2008 to eliminate the consequences of the global crisis, and has accumulated about $2.4 trillion in its accounts. This was carried out as part of the quantitative easing program in order to introduce cheap money into the US economy and stimulate it, accelerating inflation.
How much debt does America have?
During the presidency of Donald Trump, the US national debt has grown by $7 trillion and has already reached about $27 trillion, Bloomberg estimates (the total national debt includes not only market instruments such as Treasuries, but also so-called domestic obligations, usually issued in the form of Government Account Series or GAS - Ed.
).
By the end of this year, the United States national debt will be almost equal to the volume of annual national GDP. This forecast is contained in a report by the US Congressional Budget Office published in September. By comparison, it accounted for 79% of US GDP at the end of 2021, and 35% in 2007.
It is obvious that the current level of debt for the United States is not the limit: due to the costs associated with measures to restore the American economy after the coronavirus pandemic, government debt will continue to grow.
Source: Expert RA
According to forecasts from the Budget Office, the size of the US national debt in 2021 will exceed 100% of US GDP, in 2023 it can reach 107% of national GDP, and by 2030 it could reach 109% of GDP. The previous such peak was recorded in 1946 in connection with large deficits of the US federal budget caused by the Second World War, experts from the Congressional apparatus indicate.
“When you are at war, and we are at war with the coronavirus, you spend as much as it takes to get rid of it. That’s exactly what we did,” US Treasury Secretary Steven Mnuchin said at the end of October during an online conversation organized by the Milken Institute. “I think deficits matter in the long run.” And we will have to deal with the US debt in the next ten years.
“There is no ceiling on public debt in relation to GDP; it makes sense to look at the level of interest burden,” says Anton Prokudin, leading methodologist at the Expert RA rating agency.
Source: Expert RA
- Thus, an acceptable debt burden is considered to be up to 60% of GDP, but low interest rates, even with a debt of 105% of GDP, led to interest expenses of about 10% of budget revenues, which is quite a rising level. Countries with interest costs exceeding 25% of budget revenues fell into default at some point in the crisis. And herein lies the main problem: as long as inflation is low, the Fed can keep rates low, and this leads to acceptable debt servicing costs. But imagine a situation where the economy is growing and inflation is stable at 3% or more. Raising the Fed rate even to 3–4% will make this pyramid vulnerable to external shock, because interest expenses to GDP will gradually increase to 20–27% of federal budget revenues with a debt to GDP ratio of 120%.
According to Prokudin, if the US government continues to pursue a policy of constant budget deficit, then the debt to GDP may grow even more and the end of the American public debt pyramid will not be so far away. A countercyclical budget policy (surplus during economic growth, deficit during a crisis) could stabilize the situation and at least not bring the sad outcome closer.
— Between 1945 and 1980, the US economy grew rapidly and the budget was usually in surplus, so the debt burden was reduced from 119% of GDP to 31%. Now the US economy cannot have rapid growth, if only because of demographic difficulties, but the reduction of government spending is in the hands of the government, says a representative of Expert RA. — Greece was in a more difficult situation in 2012, but was able to achieve a surplus after losing part of the economy. In the US, the situation is much easier; they can make do with fewer losses in order to achieve a surplus.
“The debt ceiling is a very debatable issue, after all, if there is a buyer in the form of the Federal Reserve, then the debt ceiling can be very far,” says Yegor Susin. — Of course, this will undermine confidence in the dollar in the future, but this is not such a quick process. In the current situation, however, it is worth considering the fact that the US Treasury borrows mainly with short-term bills (+$2.6 trillion) and only partly with longer-term securities ($1 trillion). The Fed, on the contrary, buys long-term bonds (+$2.1 trillion). This has two effects at once - distortion of the yield curve (long-term rates are lower) and squeezing money into riskier assets with high duration.
As the debt structure normalizes, the US Treasury will have to issue more securities, and the Fed will have to buy more. This also sharply limits the Fed's ability to control inflation, but at the moment the regulator is not particularly worried about this, since the economy has been generating inflation below target for the last 10 years.
— The Fed’s new strategy assumes the possibility of higher inflation in order to compensate for this “shortfall.” In fact, this means that the Fed will chronically lag behind inflation if an inflationary background develops,” Susin predicts. — Inflation is still subdued. Partly because objectively there is no shortage of production capacity in the world, partly because money simply does not reach the middle class. Low inflation is partly due to the structure of consumption, where less than 1/3 is goods, and the consumption of a number of services (as the last crisis showed) can be reduced. The excess money supply is “utilized” by the financial market, where the value of assets increases. This does not mean that inflation cannot exist in principle, but it does mean that its triggers will most likely be in a non-economic plane and then the Fed will not be able to respond adequately. In the medium term, current policies are likely to lead to a weakening dollar, which will also increase the risks of increased volatility as leverage in the financial sector increases.