Average annual number of employees in sectors of the economy of the Russian Federation (thousand people)
| 1990 | 1998 | 2004 | Structure, % of the number of employees |
| 1990 | 1998 | 2004 | |
| Total in the economy | 100,0 | 100,0 | 100,0 |
| Industry | 30,3 | 22,2 | 21,5 |
| Agriculture | 12,9 | 13,7 | 10,4 |
| Forestry | 0,3 | 0,4 | 0,4 |
| Construction | 7,9 | ||
| Transport | 6,6 | 6,3 | 6,6 |
| Connection | 1,2 | 1,3 | 1,4 |
| Wholesale and retail trade, catering | 7,8 | 14,6 | 17,2 |
| Housing and communal services, non-production types of consumer services for the population | 4,3 | 5,3 | 4,8 |
| Health, physical education and social security | 5,6 | 7,0 | 7,1 |
| Education | 7,9 | 9,3 | 9,0 |
| Culture and art | 1,7 | 1,7 | 1,9 |
| Science and scientific service | 3,7 | 2,0 | 1,8 |
| Finance, credit, insurance | 0,5 | 1,1 | 1,4 |
| Control | 2,1 | 4,4 | 4,8 |
| Other industries | 3,1 | 2,7 | 3,8 |
As a methodological problem in the study of structural processes, we note that from 2002 to 2004.
Rosstat gradually moved from the traditional classification of industries according to the All-Russian Classifier of Sectors of the National Economy (OKONKh), to classification according to the All-Russian Classifier of Types of Economic Activities (OKVED), borrowed from foreign practice. Therefore, table 6.2.3, the data of which is comparable with the balances of labor resources for the previous 40-50 years, ends in 2004. And published data according to OKVED begin in 2000; in table 6.2.4 they are presented for 2004-2006. Table 6.2.4
Average annual number of people employed in the economy by type
economic activity [161]
| Thousand Human | As a percentage of the total | ||||
| 2004 | 2005 | 2006 | 2004 | 2005 | 2006 |
| Total in the economy | |||||
| agriculture, hunting and forestry | 11,2 | 11,1 | 10,6 | ||
| fishing, fish farming | 0,2 | 0,2 | 0,2 | ||
| mining | 1,6 | 1,6 | 1,5 | ||
| manufacturing industries | 17,7 | 17,2 | 16,8 | ||
| production and distribution of electricity, gas and water | 2,9 | 2,9 | 2,9 | ||
| construction | 7,1 | 7,4 | 7,6 | ||
| wholesale and retail trade; repair of vehicles, motorcycles, household products and personal items | 16,3 | 16,6 | 16,9 | ||
| hotels and restaurants | 1,7 | 1,7 | 1,8 | ||
| transport and communications | 8,0 | 8,0 | 8,1 | ||
| including communication | … | … | 1,4 | 1,4 | |
| financial activities | 1,3 | 1,3 | 1,4 | ||
| real estate transactions, rental and provision of services | 7,3 | 7,3 | 7,4 | ||
| public administration and military security; compulsory social security | 5,2 | 5,2 | 5,3 | ||
| Education | 9,2 | 9,0 | 9,0 | ||
| health and social services | 6,8 | 6,8 | 6,9 | ||
| provision of other communal, social and personal services | 3,5 | 3,7 | 3,7 |
The structure assessed using the new methodology (Table 6.2.4) shows a reduction in employment in manufacturing and an increase in employment in construction, trade, and public administration. The further decline of science is “dissolved” among other services to which this industry is equated. But growing hotels and restaurants are highlighted in a separate line.
In addition to the shown changes in the structure of employment by industry (type of activity), in the last 15-20 years there have been significant changes in ownership patterns - the share of employees in the sector of state and municipal property by 2006 had decreased to 32.8%. In the educational structure of the employed population, the share of people with higher and secondary specialized education has increased; in the professional structure, the share of technical specialists has decreased and the share of economists, lawyers, and service sector workers has increased.
Unemployment, its types and dynamics
Keywords
| Unemployment. | Employment. |
| Unemployed. | Unemployment rate. |
According to the Rosstat survey methodology, the unemployed include persons 15-72 years old who during the period under review (the survey week): a) did not have a job (gainful occupation); b) were looking for work during the four weeks preceding the survey week, using any methods (i.e., contacting government or commercial employment services, using or placing advertisements in the press, directly contacting the administration of the enterprise (employer), using personal communications, etc. or took steps to organize their own business; c) were ready to start work within one week after the survey.
Pupils, students, pensioners and disabled people are counted as unemployed if they were looking for work and were ready to start it.
employment law, able-bodied citizens who do not have a job or income and are registered with the employment service in order to find a suitable job are recognized as unemployed.
,
are looking for work and are ready to start it
[162] . Pupils under 16 years of age, full-time students, pensioners and a number of other categories recognized by Rosstat as unemployed, if they are looking for work and are ready to start it, cannot be registered as unemployed according to the law “On Employment in the Russian Federation”.
Unemployment, as a socio-economic phenomenon, has a number of consequences. The following are considered positive consequences: 1) with rapid structural changes through the state of unemployment, there is a redistribution of labor between industries, the rejection of professions that are outdated from the point of view of scientific and technological progress; 2) fear of unemployment disciplines workers employed at enterprises and increases their productivity. Unemployment has much more negative consequences: 1) a decrease in GDP production and a reduction in tax revenues; 2) reduction in household income and consumer demand; 3) deskilling, social maladjustment, an increase in the number of mental and other diseases, suicides, an increase in crime, etc.
There are many typologies of unemployment. Most of them consider the following types of unemployment as the main ones: frictional, structural and cyclical.
Frictional unemployment is considered to be the condition of workers who are looking for work or waiting to get work in the near future. In other words, as a reflection of the process of “normal” movement of workers between enterprises, associated with overcoming the “friction” of the labor market - incomplete information about jobs, peculiarities of legislation and other reasons due to which in the real economy the movement of a person from one workplace to another is not It happens instantly, but takes a certain amount of time. Frictional unemployment is, in principle, considered socially harmless.
Structural unemployment is the state of workers forced to look for new jobs due to changes in demand for goods and production technologies, which, in turn, predetermine changes in the structure of demand for labor. Structural progressive unemployment caused by a reduction in employment in relatively backward industries and professional groups and the redistribution of labor into industries and professional groups that are promising from the point of view of scientific and technological progress is useful from an economic point of view. Its negative social consequences can be minimized by deploying special programs for retraining the unemployed and teaching new professions. Structural-regressive unemployment is caused by the expulsion of employees from technologically advanced industries and their redistribution into relatively backward industries. From the point of view of the long-term economic goals of society, this form of structural unemployment has negative consequences. The social consequences of this type of unemployment are especially negative when it takes on a long-term, stagnant character.
Cyclical to involuntary unemployment caused by an economic downturn. As a rule, the concept of cyclical unemployment is used in the context of Keynesian economic theory, which considers the lack of “aggregate demand” to be the main factor of this type of unemployment. Cyclical unemployment often takes the form of long-term, stagnant, etc., and is therefore in most cases considered undesirable for society.
Frictional and structurally progressive unemployment can be considered normal concomitants of the progressive development of a market economy. Based on this, many scientists refuse to understand “full employment” as 100 percent. They argue that there is a natural rate of unemployment (mostly frictional), which is defined as the proportion of unemployed people that corresponds to the rational level of full employment in the economy. The natural rate of unemployment in the 1970s was determined in American literature at 2-3%; in the 1980s, when unemployment in the United States was the highest in recent decades, it had already reached 4-6%.
Quite close to the concept of a natural level is the concept of the NAIRU level. NAIRU (not accelerated inflation rate of unemployment) is translated as “non-accelerating inflation rate of unemployment.” This concept is used in mathematical models of the economy developed within the monetarist direction of science. Based on the general thesis that measures to stimulate the economy and reduce unemployment cause inflation, they nevertheless allow for a limited application of these measures to the level of NAIRU. In their opinion, attempts to further reduce unemployment below the NAIRU level will inevitably cause a rapid increase in inflation. In the 1980s in the United States, the authors of this concept defined NAIRU, like the “natural level,” at 6%. Contrary to their theories, in the 1990s, unemployment in the United States fell to 4-5% with almost zero inflation.
Let us now move directly to the analysis of real unemployment. Unemployment is characterized by the number of unemployed according to surveys and registered, the unemployment rate, the socio-demographic structure of the unemployed and other indicators.
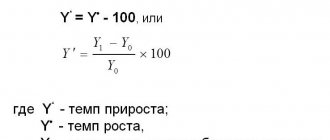
The unemployment rate is calculated using the formula:
The dynamics of the number of unemployed in Russia for the period from the beginning of relevant observations to the present is shown in Figure 6.3.1.
Rice. 6.3.1. Number of unemployed according to surveys and registered unemployed in 1991-2007.
The number of unemployed according to surveys in October 1992 (the first ONPZ) was 3.9 million people (5.2% of the economically active population). Then, as the economic crisis deepened, culminating in the “default” of 1998, the number of unemployed increased to 10.4 million people in February 1999 (14.5%), after which it began to decline. The main decline occurred in 1999-2002. In 2003-2005 the number of unemployed fluctuated in the range of 5.0-6.0 million people, then began to decline again. In August 2008, this figure was estimated by Rosstat at 4.0 million people, or 5.3% of the economically active population. When assessing the tendency of unemployment rates to increase or decrease, which is currently relevant in connection with the global financial crisis, it is necessary to take into account that in recent years the number of unemployed in February was 1 million more people than in August, that is, there was seasonality. To diagnose that unemployment has begun to rise, it is necessary to clear the corresponding trend from the influence of seasonal cyclicality.
Registration of unemployment by employment services of the Russian Federation began in 1991. The growth of registered unemployment continued from mid-1991 until April 1996, when the number of such unemployed people reached 2771.1 thousand people (registered unemployment rate - 3.8% of the economically active population). After this, the number of registered unemployed began to decline, continuing until July 2000, when this figure was 990 thousand people. (1.4%). In 1999-2000, due to the economic recovery, the supply of jobs in the labor market began to expand, which played a role in reducing registered unemployment. In 2001-2005, the number of registered unemployed increased (up to 2 million people in February 2005), after which it again entered a phase of decline. At the end of 2008, this figure was 1.3 million people, or 1.7% of the economically active population.