What are macroeconomic indicators?
Macroeconomic indicators are statistics that reflect the economic conditions of a particular country, region or sector. They are used by analysts and governments to assess the current and future state of the economy and financial markets.
Macroeconomic indicators will vary in their meaning and the impact they have on the economy, but in general there are two main types of indicators:
- Leading indicators that predict where the economy may be headed. They are often used by governments to implement policies because they represent the first phase of a new business cycle. These include the yield curve, interest rates and stock prices.
- Lagging indicators, which reflect the historical performance of the economy and change only after a certain trend has emerged. These include gross domestic product (GDP), inflation and employment rates.
There is also a category of coincident indicators, but these are usually grouped with lagging indicators because they occur simultaneously with or after an economic shift.
What are macroeconomic indicators and what are they for?
Macroeconomic indicators are important indicators that reflect the state of the country's economy as a whole. This includes GDP, inflation rate, unemployment rate and other indicators that make it possible to understand what is happening in the country at the economic level and in which direction the national currency exchange rate may shift.
These indicators can be viewed in economic calendars, which are publicly available from any major broker. Using them, you can determine whether the state of the economy of any sector has worsened or improved, whether analysts’ forecasts have come true, what awaits the country as a whole in the near future, etc. That is why the ability to analyze the readings of macroeconomic indicators is one of the most important skills for traders, especially if they trade based on fundamental analysis.
Why are macroeconomic indicators important for traders?
Macroeconomic indicators are important for any trader because they can have a significant impact on market movements. This is why any fundamental analysis will include macroeconomic indicators.
It is impossible to be sure that these indicators themselves are reliable, but they do play a role in shaping the economy. Even if these indicators simply influence other traders to open and close positions, this can be enough to create volatility in the market.
Market participants will be watching analysts' forecasts for the data ahead of its release. The greater the difference between analysts' forecasts and the actual figure, the more volatility can be expected in the financial markets as positions are adjusted to reflect the actual figure.
Specific data sets have greater impact in different countries, so it is important to focus on different macroeconomic indicators depending on what asset you are trading. For example, if you are looking at a UK company or the FTSE 100, you need to look at the macroeconomic indicators that impact the UK.
Most macroeconomic releases occur on specific dates, which means traders and investors can prepare for their release and subsequent market volatility.
Income inequality indicators
The difference between the incomes of the population is one of the main tasks that sociologists set for themselves when compiling statistical data. The obtained data from sociological research serve as the basis for choosing policies in the field of income distribution. To assess the difference in income between segments of the population, several indicators are used: the number of people, the number of people with an income level below the poverty line, the distribution of funds among different segments of the population, and an indicator of income concentration.
To track the amount of income and how it is distributed across the population, two measures are correlated: total income and income dispersion.
V. Pareto, as a result of his research, came to the conclusion that the distribution of income in all states does not depend on any conditions. This conclusion of V. Pareto in modern economics is known as “ Pareto’s law ”. According to the scientist's research, there is a relationship between the amount of income and the number of people who receive it. 80% of GDP comes from 20% of the population and the remaining 20% is shared by 80% of the people. Economists call Pareto's law the " 20/80 law ." Based on the distribution of income by its value, it is possible to construct a curve, which is called the concentration curve or the Lorenz curve, which allows us to judge the level of inequality.
Top 11 macroeconomic indicators
The best macroeconomic indicator to watch will largely depend on your personal preferences, what positions you hold, and what country your portfolio is focused on. However, there are some common indicators that most traders and investors will keep an eye on.
Leading indicators:
- Stock market
- Housing prices
- Bond yield
- Production and manufacturing statistics
- Retail
- Interest rates
Lagging indicators:
- GDP growth rate
- Consumer Price Index (CPI) and Inflation
- Currency Strength and Stability
- Labor market statistics
- Commodity prices
Unemployment Rate Indicators
From a macroeconomic point of view, the population is usually divided into those who are included in the labor force and those who are not. The basic indicator of unemployment in a country is its level. To calculate the unemployment rate, it is necessary to compare the number of people without work to the labor force, all expressed as a percentage.
Stock market
The stock market is considered a good predictor of economic health because market participants spend their time assessing the health of companies and the economy and are therefore well positioned to assess future growth.
A rising stock market indicates confidence in the future of a business, which can lead to economic growth. However, a falling stock market could mean that investors are taking their money out of stocks and into safe assets.
There are some problems associated with stock market performance as an economic indicator, mainly due to the fact that prices are often based on speculation rather than the actual value of the company. This is why stock prices can be overvalued and undervalued.
The stock market has also experienced significant bubbles before market crashes, which can create a false sense of optimism about the state of the economy. This occurs when traders and investors ignore other macroeconomic indicators and become influenced by bullish sentiment in the market.
There are so many factors that influence stock prices, so it is important to use both technical and fundamental analysis to gain insight into future trends in the stock market.
Macroeconomic indicators of Russia
Macroeconomic indicators of Russia include all the indices that were listed above. Also, in addition to them, the following indicators of the country’s macroeconomics are used in the Russian Federation:
- PTC index. When calculating it, the value of shares of the 10 most liquid enterprises in the country is taken into account.
- Index RUIX. Shows the average price of shares over the last 20 minutes of stock trading.
- MICEX index. A constantly changing value, since the calculation is carried out without interruption based on the prices of the most liquid shares. That is, the index is recalculated in real time whenever the price of an asset changes.
These indicators are also reflected in economic calendars.
Housing prices and real estate market
The housing market is widely considered a leading indicator because the information can inform the state of the economy months in advance.
Declining home prices indicate that there are more homes available than there are people willing to buy them. This could be because prices are too high or people simply cannot afford to buy a home. When the housing sector weakens, the entire economy feels it. The decline could impact homeowners' wealth, construction jobs and taxes, and could force homeowners into foreclosure, the name given to the process of lenders seeking to obtain mortgages from borrowers.
The 2008 recession is a prime example of the impact the housing market has on the overall economy. The subprime mortgage crisis had a profound impact on the real estate market and was an early sign of the global financial crisis.
The number of building permits can be a key indicator of economic health because companies will apply for these permits at least six months before construction begins. If new projects begin, it will indicate that these companies expect housing demand to increase. If home construction starts to fall, construction companies will become more pessimistic about the future of the market.
Bond yield
The bond market is considered a good leading indicator, but it is important to note that the market is based only on investors' and traders' expectations of future economic circumstances. So perhaps, rather than being considered a leading indicator of what the economy will do, it is a measure of market expectations.
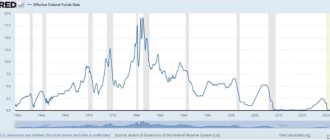
The best way to use bonds is to look at the yield curve. A bond's yield is the income a trader can receive in exchange for buying and holding the bond. A yield curve is a line drawn on a graph that shows the yields on bonds of the same credit quality but with different maturities - in theory, the graph should slope upward because yields are higher for bonds with longer maturities.
The performance of short-term bonds (those with maturities of up to two years) is directly affected by central bank decisions and interest rate expectations. Although the performance of long-term bonds (those with a maturity of more than two years) is affected by both interest rates and factors such as inflation and economic growth, which may take longer to take effect.
When these influences come into play, the shape of the yield curve can change. It is these changes that analysts use to forecast economic prospects.
When the economy grows, we can expect a positive rebound as a result of higher inflation. However, debt bonds become riskier as there is an increased likelihood of rising interest rates. This means that bond investors will begin to demand higher yields for longer maturities, causing long-term bond yields to rise faster than short-term bonds, resulting in a steeper yield curve.
When the economic future becomes uncertain, the yield curve flattens. This is because short-term bond yields rise faster than long-term bonds as investors become indifferent to the returns produced across all maturities and accept the same for any bond.
If the yield curve becomes inverted - with short-term bonds paying more than long-term bonds - this can be seen as a sign that investors expect economic growth to slow sharply with low inflation, and therefore they expect central banks to cut interest rates.
Leading economic indicators
Stock market
The stock exchange is considered a good indicator of the state of the economy, as market participants evaluate individual companies and the overall situation in the economy, so they can assess future growth or economic decline.
A rising stock market indicates participants' confidence in future economic growth. A falling stock market means investors are taking their money out of stocks and into safer assets.
There is a problem with using the stock market as an economic indicator. Share prices are often based not on the actual value of companies, but on speculation. This is why stock market prices can be overvalued or undervalued. Also, the stock market may exhibit significant bubbles before crashes, which create a false sense of optimism about the state of the economy. This occurs when traders and investors ignore other macroeconomic indicators and become influenced by bullish market sentiment.
There are many factors that influence stock prices, so it is important to use both technical and fundamental analysis to gain insight into future trends in the stock market.
Housing prices
The housing market is considered a leading indicator because it provides information about the state of the economy months in advance.
Declining home prices indicate that there are more homes available than there are people willing to buy them. This may be because prices are too high or people simply cannot afford to buy a home. When the housing sector weakens, the entire economy feels it. The downturn could have an impact on homeowners' wealth, construction jobs and taxes.
The 2008 recession is a prime example of the housing market's impact on the global economy. The subprime mortgage crisis did not remain solely a problem of the real estate market, but became an early harbinger of the global financial crisis.
The number of building permits is a key indicator of economic health, as companies apply for permits about six months before construction begins. If new properties begin to be built, this indicates that construction companies expect an increase in demand for housing. If home construction starts to decline, then builders become more pessimistic about the future of the market.
Bond yield
The bond market is considered a good leading indicator, but it is important to note that the entire market is based only on investors' and traders' expectations of future economic conditions. So, rather than considering it a leading indicator of the economy, it should be considered an indicator of market expectations.
The best way to use bonds is to analyze the yield curve. A bond's yield is the income a trader will receive in exchange for purchasing the bond. A yield curve is a line drawn on a graph that shows the yields on bonds of the same credit quality but different maturities. In theory, the chart should skew upward because yields tend to be higher for bonds with longer maturities.
The performance of short-term bonds (maturing up to two years) is directly affected by the decisions of the Central Bank and interest rate expectations. The performance of long-term bonds (those with a maturity of more than two years) is affected by both interest rates and factors such as inflation and economic recovery, the effects of which may be felt over a period of time. As these factors begin to take effect, the shape of the yield curve may change. It is these changes that analysts use to forecast economic prospects.
When the economy grows, you can expect yields to rise as a result of higher inflation. However, long-term bonds become riskier as the likelihood of rising interest rates increases. This means that bond investors will begin to expect higher yields for longer maturities, causing long-term bond yields to rise faster than short-term bonds, resulting in a steep yield curve.
When the economic future becomes uncertain, the yield curve flattens. This is because yields on short-term bonds rise faster than long-term bonds as investors become indifferent to the yields earned across all maturities.
If the yield curve becomes inverted—when short-term bond yields exceed long-term bond yields—it could be seen as a sign that investors expect economic growth to slow sharply with low inflation, and therefore they expect central banks to cut interest rates.
Industrial production volume
Industrial production statistics can be one of the easiest and fastest ways to obtain reliable data on the state of the economy. Increased production and output tend to have a positive impact on gross domestic product (GDP), which is seen as a sign of increased consumption and positive economic growth.
Changes in production levels can also affect employment levels. The number of manufacturing jobs available shows how confident a business is in economic growth. If there are a significant number of vacancies on the labor market, then companies have an excess of orders that they need to fulfill. But when they stop hiring, it means companies are cutting costs in preparation for a period of economic downturn.
Retail sales
Retail sales is data that tracks all purchases of goods and services by consumers and businesses. This is especially important since consumption accounts for a significant portion of economic activity.
Rising retail sales indicate the economy is improving. If consumers are confident in their economic conditions and their future, they will continue to buy products and goods that are not essential items. This leads to increased production in line with demand and stimulates GDP growth. It can also have a direct impact on the stock prices of companies involved in creating consumer “wants.” These stocks are known as cyclical stocks.
When consumers begin to feel uncertain about their economic future, they stop buying unnecessary goods and limit their spending. During these periods, defensive stocks (stocks of companies involved in the production of essentials such as food and utilities) will tend to outperform the market. To combat falling spending, governments often resort to tax cuts to give consumers more money and more spending.
Retail sales alone do not always provide an accurate picture of government spending. For example, this could be the case when people take out loans to continue spending. While this will indicate continued strong retail sales, debt levels will indicate a looming recession.
Interest rates
There are arguments that interest rates are both a leading and a lagging indicator. They are lagging in the sense that the decision to raise or lower rates is made by central banks after an economic event or market movement has already occurred. However, they are also a leading indicator because once a decision is made, there is a good chance that the economy will begin to change.
During healthy economic periods, when there is high consumer spending and high inflation, central banks can be expected to raise interest rates to stop the economy from growing too quickly. This decision of the Central Banks confirms economic growth. However, the new rates mean that banks will have to pay a higher rate to get the money, which in turn will increase the cost of borrowing for consumers. This forces consumers to borrow less money and discourages spending. The decisions made by central banks will have a significant impact on banks, consumers and businesses around the world.
On the other hand, if the economy is stagnating, analysts will expect central banks to cut interest rates to increase spending. This decision confirms that the economic situation is far from ideal, but indicates that borrowing costs will soon fall, spending will increase, and the economy will begin to grow.
Production and manufacturing statistics
Manufacturing statistics can be one of the easiest and fastest ways to get reliable data on the state of the economy. Increased production tends to have a positive impact on gross domestic product (GDP), which is seen as a sign of rising consumption and positive economic growth.
Changes in production levels can also affect employment levels. The number of manufacturing jobs available can tell us a lot about how confident companies are about expanding in the economy. If a significant number of jobs are available, companies may have a surplus of orders that they need to fill.
However, it is also important to consider inventory and retail sales levels. High inventory levels may indicate increased consumer demand, but it may also indicate that goods produced are not leaving warehouses.
The economic growth
Economic growth is one of the most important goals of society. Thanks to him, prosperity and civilization in society are growing. Even the subconscious psychology of a person strives to create and create. It is customary to measure economic growth in terms of GDP, as the most basic indicator.
Economic growth cannot be unlimited. There are a number of difficulties that prevent this:
- Lack of resources (natural);
- The environment is deteriorating;
- The territory has limits. Almost all places on Earth have already been developed and super rapid growth is hardly possible.
- A huge number of products that are not needed. For example, the production of alcohol, tobacco and other harmful substances can hardly be considered an advantage of economic growth.
- The arms race is another important aspect that is difficult to name as an advantage of economic growth;
Retail
Retail sales are data that tracks purchases of finished products and services by consumers and businesses. This is incredibly important because consumerism accounts for the majority of economic activity.
Overall, rising retail sales indicate the economy is improving. If consumers are confident about their economic circumstances and the future of their situation, they will continue to buy goods and shell out on items that are not necessary. This causes production levels to rise in line with demand and increases GDP. This can also have a direct impact on the share prices of companies involved in creating consumer needs. These stocks are known as cyclical stocks.
However, when consumers begin to doubt their economic future, they will stop buying unnecessary goods and limit their spending. During these periods, defensive stocks—stocks of companies involved in consumer goods such as food and utilities—will outperform the average market return. To combat falling spending, governments often use tax cuts to give consumers more money and more spending.
However, retail sales alone do not necessarily provide an accurate picture of government spending. For example, this could be the case where people take out loans to continue spending. While this would show continued strong retail sales, debt levels would indicate a looming recession.
Interest rates
There are arguments for interest rates as both leading and lagging macroeconomic indicators. They are lagging in the sense that the decision to increase or decrease rates is made by central banks after an economic event or market movement has already occurred. However, they also lead because once a decision is made, there is a significant likelihood that the economy will change to reflect the new level of interest rates.
For example, during periods when there is high consumer spending and high inflation, central banks can be expected to raise interest rates to stop the economy from growing too quickly. This decision confirms the growth of the market. However, the new rates mean that banks will have to pay a higher rate to get the money, which in turn will increase the cost of borrowing for consumers. This makes consumers more reluctant to borrow money and discourages spending. The decisions made by central banks will have a significant impact on banks, consumers and businesses around the world.
On the other hand, if the economy is stagnating, analysts expect central banks to cut interest rates to boost spending. The decision confirms that the economic situation is grim, but it is an indicator that borrowing costs will soon fall, spending will increase and the economy will begin to grow.
GDP growth
Gross Domestic Product (GDP) is the monetary value of all goods and services produced in a country. This data is widely used to compare differences between two countries and predict their growth.
When GDP increases, it can have an impact on other indicators on this list, such as employment levels, as companies hire more workers and increase production.
If a country has stable GDP growth rates, this is a good sign of economic stability. However, rapidly growing GDP figures are often met with criticism. Some analysts argue that it is too easy to manipulate GDP numbers through programs such as quantitative easing or excessive government spending.
For example, up until 2021, India was declared to be the fastest growing major economy with an annual GDP rate of 7%, but finding a flaw in the measurement process between 2011-2017 revealed that the figure was actually 4.5%.
As a lagging indicator, traders and investors can only tell how much GDP is. However, the theory is that if the GDP level declines for two consecutive quarters, then the economy enters a recession or contraction.
Inflation
Inflation is a steady increase in prices for goods and services in a country. It is a lagging indicator because it is the result of economic growth or contraction.
During periods of economic growth, inflation is likely to rise. High inflation rates can have a serious impact on the price of a country's currency, reducing its purchasing power. This could also have an impact on other macroeconomic indicators as it could lead to lower employment and lower GDP growth. High inflation rates cause interest rates to rise as governments try to control prices.
During periods of economic downturn, there may be a decrease in inflation rates or even "deflation" when inflation falls below 0%. This may sound positive, but in reality it is confirmation that consumers have cut back on their spending. This is often accompanied by a contraction in the money supply, a decline in retail sales and an increase in unemployment.
Important indicators of a market economy.
To participate in trades, a good trader monitors basic and additional data. The current list includes:
- Unemployment rate. It is good if the trader knows the factors and their characteristics. Information may be underreported by government agencies. For example, the formally employed population, but receiving very low wages, or people who enter into temporary contracts are not taken into account. At the same time, the indicator may be overestimated, since those who work but do not enter into an appropriate contract are not always taken into account.
- Inflation rate. This budget indicator is significant. Be sure to take into account whether inflation is rising or falling, as well as the stage of the market economy cycle.
There are other factors to consider. Each trader decides for himself what is important and what is not.
All factors are constantly interconnected with each other. It is impossible to attach high importance to one indicator and ignore the importance of another. This will not allow you to make a correct forecast of market development.
The market moves due to the release of some news. For a correct forecast, it is not necessary to know the formulas that are used for analysis. It is enough to follow the news and track the main types of macroeconomic indicators.
Currency Strength and Stability
A country's currency is a reflection of the health and stability of its economy because the price of a currency is based on how buyers and sellers perceive its value. This is a lagging indicator as the value of the currency will change depending on the political and economic conditions in the country.
When significant uncertainty arises, the instability spreads throughout a nation's currency and the value can change rapidly—known as market volatility.
A strong economy is viewed positively by investors, who will pay more for the currency. In turn, a strong currency stimulates the economy by increasing purchasing power. The impact of rising currency prices depends on whether the country is a net importer or exporter. For example, if a country is a net exporter, although goods may be sold at higher foreign prices, importers may be unwilling to pay these higher prices. Whereas, if a country is a net importer, it becomes cheaper to buy foreign goods.
A weak economy discourages investment, leading to a decline in the value of the currency. This in turn reduces the price of exports, which, although less positive for domestic companies, can make prices more competitive on the global stage. It also makes imports more expensive because the currency may be worth less, meaning higher costs for companies and consumers. However, a weakened currency also has advantages: it stimulates tourism and demand for domestic goods.
Lagging Economic Indicators
GDP growth rate
Gross Domestic Product (GDP) is the monetary value of all goods and services produced in a country. This data is widely used to compare differences between different countries' economies and predict their growth.
When GDP increases, it has an impact on employment levels as companies hire more employees and increase production.
If a country has a stable GDP growth rate, it is a good sign that the economy is stable. However, too high GDP figures are often criticized. Some analysts argue that GDP figures are easy to manipulate through programs such as quantitative easing or excessive government spending. For example, up until 2021, India was considered the country with the fastest growing economy. India's annual GDP growth rate was around 7%, but after discovering errors in the process of measuring India's GDP between 2011-2017, it was found that the figure was actually 4.5%.
GDP is a lagging indicator, but the theory is that if the GDP growth rate declines for two consecutive quarters, the economy enters a recession.
Inflation rate
Inflation is a steady increase in the prices of goods and services in a country. Inflation is a lagging indicator because it is the result of economic growth or recession.
During periods of economic growth, inflation will rise. A high level of inflation can have a serious impact on the price of a national currency, reducing its purchasing power. This could have an impact on other macroeconomic indicators as it could lead to lower employment and GDP growth. High inflation rates lead to rising interest rates as governments try to bring prices under control.
During periods of economic downturn, there may be a decrease in the inflation rate or even deflation (the inflation rate falls below 0%). This may seem like a positive development, but in reality, falling inflation signals that consumers have cut back on their spending. A decline in inflation is often accompanied by a contraction in the money supply, a decline in retail sales, and an increase in unemployment.
Currency Strength and Stability
A country's currency is a reflection of the health and stability of its economy, as the price of a currency is based on how buyers and sellers perceive its value. This is a lagging indicator because the value of the currency will change depending on the political and economic situation in the country.
A strong economy is perceived positively by investors, who will be willing to pay more for the national currency. In turn, a strong currency, thanks to its increased purchasing power, stimulates the economy. The impact of rising currency prices depends on whether the country is a net importer or exporter. If a country is a net exporter, then domestic goods will be sold abroad at higher prices, which foreign importers may be unwilling to pay. If a country is a net importer, then it becomes cheaper to buy foreign goods.
A weak economy discourages investment, leading to a decline in the value of the currency. This in turn lowers export prices, which (while less positive for domestic companies) can make prices more competitive on the global stage. A decline in the value of a nation's currency makes imports more expensive because one unit of currency can buy fewer goods, meaning that the cost of foreign goods to companies and consumers rises. However, there are also advantages of a weakened currency - it stimulates tourism and demand for domestic goods.
Labor market statistics
The most useful lagging indicator is the unemployment rate. If the unemployment rate increases month after month over a period of time, it indicates that the overall health of the economy is deteriorating. If the employment rate falls, this means that enterprises have finally lost hope of improving the situation and have begun to lay off their workers.
Even if the economy is considered to be back on track, unemployment may remain high. This happens because employers will wait until they are confident that the economy is growing before hiring new workers.
Commodity prices
Commodity prices are considered a good macroeconomic indicator because market prices of commodities often move earlier than other lagging indicators.
Increased demand for goods such as timber, iron and oil can be seen as a sign of economic growth. These goods are often needed to build infrastructure, which is why the largest importers of commodities are emerging economies. When demand for these goods declines, it is a sign that the economy is contracting and construction projects are being abandoned.
Some commodities, such as gold, will rise in price during economic downturns. Gold is considered a safe asset, so investors consider it a safe haven asset during periods of economic uncertainty. If the price of gold rises, it could be a sign that the economy is slowing and investors are fleeing to safe haven assets. If the price of gold falls, it is a sign that investors are moving their money into riskier assets.
Labor market statistics
Perhaps the most useful lagging indicator is the unemployment rate. If the unemployment rate increases on a month-on-month basis over a period of time, it tends to indicate that the overall economy is deteriorating in health care. If the employment rate falls, it means that businesses have finally given up hope that the situation will improve and have begun to lay off their workers.
Even if the economy is thought to be back on track, the unemployment rate may not fall because employers will always wait until they are confident that the economy is growing before hiring new workers.
Commodity prices
Commodity prices are considered good macroeconomic indicators because their market prices often move ahead of other lagging indicators.
An economy-wide increase in demand for goods such as timber, iron and oil can be seen as a sign of economic growth. These supplies are often needed to build infrastructure, and therefore the largest importers of goods are emerging economies. When demand for these goods decreases, it is a sign that the economy is contracting and construction projects are stopping.
Some commodities, such as gold, will rise in price during economic downturns. Gold is considered a safe-haven asset, so investors consider it a valuable asset during times of economic uncertainty. If the price of gold rises, it could be a sign that the economy is slowing and investors are seeking more stability. If the price of gold declines, it is a sign that investors are moving their money into higher-risk assets.
Macroeconomics concept
Definition 1
Macroeconomics is a branch of economic theory that studies large economic systems using aggregate values and indicators.
The goal of economic science is to find optimal ways to meet the ever-increasing needs of society in conditions of limited resources. Historically, there have been two directions in economic theory:
- Microeconomics. It studies processes, phenomena, events, as well as economic structures formed by individual economic entities.
- Macroeconomics . She explores large economic systems of national and world level. Its distinctive feature is the use of aggregate indicators or aggregate values.
Finished works on a similar topic
- Course work Macroeconomic statistics 440 rub.
- Abstract Macroeconomic statistics 230 rub.
- Test paper Macroeconomic statistics 220 rub.
Receive completed work or specialist advice on your educational project Find out the cost
Within the framework of macroeconomics, problems of economic growth and cyclicality of the national economy, unemployment, price level fluctuations, circulation of money and changes in interest rates, management of the state budget and trade balance are considered.
Macroeconomics is a relatively recent phenomenon. At the end of the 19th century, it began to emerge as a separate direction, but was formed only in the thirties of the twentieth century. Attempts to study the economic systems of countries from the point of view of a holistic approach are being improved to this day.
Today macroeconomics is one of the social sciences. It uses modeling methods to formalize changes in large economic systems. Macroeconomic parameters are considered over certain periods of time and are characterized by moment. The variables in macroeconomic analysis are flows and stocks. The study of macroeconomic indicators can be carried out within the framework of positive and normative analysis. The first is associated with forecasting, the second develops tactical actions to achieve the desired result.
Need advice from a teacher in this subject area? Ask a question to the teacher and get an answer in 15 minutes! Ask a Question
Note 1
Thus, macroeconomics is one of the disciplines of economic theory that creates the basis for justifying decisions made within the framework of the country’s economic policy.
Macroeconomic indicators: results
- Macroeconomic indicators are statistics or data that reflect the economic conditions of a particular country, region or sector.
- Macroeconomic indicators will vary in their meaning and the impact they have on the economy, but in general the two types are leading and lagging indicators.
- The most widely used indicators are published by authoritative sources such as governments, supranational bodies and non-governmental organizations (NGOs).
- Macroeconomic indicators are important for any trader because they can have a significant impact on market movements.
- Most macroeconomic reports occur on specific dates, which means traders and investors can prepare for their release and subsequent market volatility.
- Popular popular macroeconomic indicators to watch include the stock market, home prices, bond yields, manufacturing and manufacturing statistics, retail sales, and interest rates.
- Popular lagging indicators include GDP growth rate, consumer price index (CPI), currency strength, labor market statistics, and commodity prices.
- The importance of the data may vary from country to country, so it is important to know and consider key indicators by region.