Why do people invest money? To make a profit. To accumulate capital for certain purposes: retirement, buying real estate, educating a child, etc.
By investing today, in a year or two, ten or twenty years, I want to get more money.
How can you make money (for example, double your money) in the stock market? What options do we have? Trading or speculation in stocks, futures and options. Selection of potentially highly profitable assets (company shares) that can show good growth in the future. What else can you offer? Trade with borrowed funds, thereby increasing your income even more. Well, as a last resort, take out a loan and invest all the money. This way we will “definitely get rich.”
Seriously, almost all of the above does not lead to earnings, but, on the contrary, to a gradual drain of money. Perhaps someone is able to make money using increased risks (and having certain skills), but for the majority such advice will be fatal.
In order to double (triple, increase) your savings, it is enough to use boring investments. Plus a couple of tricks that accelerate capital growth. Combining all this can give quite good progress. Capital will grow by leaps and bounds. Almost. How to do it?
First, a little math...
The concept of profitability
Profitability is a concept used by investors to evaluate the performance of investment operations. That is, this is the amount of profit that will remain with the investor after deducting all costs and expenses. Profit in this case is the sum of current income for a certain period and capital gains for the same period. Thus, the profitability formula can be presented as:
Dokh = PP / SV * 100%, where:
- Doh is profitability;
- PP - profit for the period;
- SV - the amount of investment.
Since profitability is usually determined as a percentage of the amount of investment, the profit divided by the amount of investment must be multiplied by 100%
Example of profitability calculation
Illarion Genrikhovich owns real estate - a house worth 1 million rubles. He decides to rent it out. Illarion Genrikhovich set the rental price at 30 thousand rubles. How to determine profitability for the year? According to the formula:
Profitability = 30,000 * 12 / 1,000,000 * 100%.
The return on Illarion Genrikhovich's investments will be 36%. Thus, profitability shows the return on investment as a percentage.
How to determine whether Illarion Genrikhovich made a good investment or not? Profitability assessment must be approached logically. First of all, it is necessary to evaluate all costs of purchasing and capital turnover. Illarion Genrikhovich purchased the house for 1 million rubles - these are his expenses. Profit for the year amounted to 360 thousand rubles (30 thousand rubles * 12 months).
At first glance, it may seem that a return of 36% is remarkable. But in fact, Illarion Genrikhovich, having spent a million rubles, did not recoup his investments in a year.
There is one rule to follow when evaluating investments. Positive dynamics in investor activity occurs when the condition is met that the return is >100%.
That is, Illarion Genrikhovich’s investments will become profitable only when their profitability exceeds 1 million rubles.
Net profit margin: meaning
The net profit rate (or net profitability ratio) is the ratio of net profit to revenue measured as a percentage (Resolution of the Government of the Russian Federation of June 25, 2003 No. 367). That is, this indicator demonstrates how much profit is per unit (ruble) of revenue. Accordingly, it serves as a characteristic of the profitability (efficiency) of the activity being carried out.
It should be distinguished from other indicators of the rate of return (profitability) calculated from other bases, for example, from:
- assets;
- investments;
- costs;
- personnel;
- capital.
Further, for brevity, we will call the rate of net profit the rate of profit , and other indicators of the rate of profit - indicators of profitability.
Rate of return measures the profitability of a business after all associated expenses have been incurred and taxes due have been deducted. A value of this indicator ranging from 8 to 20% is considered good. The higher it is, the higher the profitability and efficiency of the business.
The actual values of the rate of return largely depend on the industry in which the activity is carried out and the specific operating conditions of a particular legal entity. If there is a loss or zero profit, this indicator is not calculated.
Income and profitability
Before we begin to study the types of profitability and the factors influencing this very profitability, it is necessary to separate the concepts of “income” and “profitability” that are quite close in meaning. You can often find people, especially new traders, who mix these two terms and get confused. Income is the amount of money received as a result of some activity during the reporting period. As applied to investment activities, income is the amount of benefit received after closing a position in monetary terms.
For example, a trader purchased a share of OAO Gazprom for 150 rubles. Before the close of trading, he sold this share for 450 rubles. His income was 300 rubles (450 rubles - 150 rubles) per day.
Profitability is the amount of change in the value of an asset relative to its original cost over a certain period of time, expressed as a percentage. For example, a trader purchased a share of OJSC Gazprom for 150 rubles and 4 days later sold it for 300 rubles. The return on investment per day will be 25%. In order to calculate it, you need to represent the value of the asset (share) as 100%. The share was sold for 300 rubles, that is, for 200% of the original cost. Thus, we subtract from 200% - 100% the initial cost (costs) and get 100% profitability in 4 days. We divide everything by 4 and get an average return of 25% per day.
Method 72
Mathematical method 72 allows you to quickly calculate the time to double your capital. We divide the number 72 by the annual rate of return (in percent) and get the number of years after which the capital will double.
With an expected annual return of 10%, it would take 7.2 years to double (72 / 10 = 7.2).
The method works with a small error. But for quickly calculating the result (in your head) it’s ideal.
Important! Method 72 will not work with extreme returns. For example, at a rate of 100% per annum, everyone understands that the capital will double in a year. And according to formula 72, this takes about 7 months.
The range of returns that the stock market can provide is quite enough for a correct calculation using the seventy-two formula.
The capital gains rule in action is in the table below.
| Annual return | Number of years to double capital |
| 2% | 36 |
| 4% | 18 |
| 6% | 12 |
| 8% | 9 |
| 10% | 7,2 |
| 12% | 6 |
| 15% | 4,8 |
| 18% | 4 |
| 24% | 3 |
Additionally, there is also the so-called formula for tripling capital (method 114). Read more in this article (plus it describes in simple terms how to add up profits and losses over the years, calculate the average annual profit over several years, and much more that is necessary for an investor).
Now let's get back to our sheep.
Capital gains depend on just 3 simple factors (financial leverage):
- how much money do you invest;
- investment time;
- capital growth rate.
By changing any of these levers, we can influence the final result. And very significantly.
Types of profitability
To assess the level of costs invested in business activities, profitability is used. There are the following types of profitability:
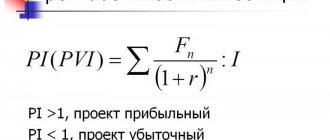
1. Internal - the yield at which the net present value is zero, expressed as an interest rate.
The internal rate of return is determined using the equation:
0 = ∑ NPD/(1+ND), where
NPV – net cash flow for the period; ND – rate of return.
2. To maturity is the yield on the bonds of the owner who holds the bonds until they mature.
It is calculated in the same way as the internal rate of return:
0 = ∑ NPP/(1+ND).
3. Current is the volume of coupon payments for 12 months, divided by the current value of the bonds. This type is used for stocks and bonds and allows you to compare several bonds or stocks. Calculated by the formula:
TD = (NS * SK) / RS, where:
- TD – current yield of shares (bonds);
- NS – nominal value (initial cost);
- SC – coupon rate;
- RS – market value of shares (bonds).
4. Dividend is the yield of shares, reflecting the ratio of the dividend on the share to the value of the share itself. The dividend yield of a stock is calculated using the equation:
DD = D / CA * 100%, where
- DD - dividend yield;
- CA – share price;
- D – dividend received on the share.
Difference between ARR and RRR
As discussed, ARR is the annual percentage return on an investment based on the initial cash outlay. Well, the required rate of return (RRR), also known as the hurdle rate, is the minimum return that an investor will accept for an investment or project in order to compensate for the level of risk assumed.
RRR can vary between investors because they have different risk appetites. For example, a risk-averse investor will likely require a higher rate of return on an investment to compensate for any risk associated with it. It is important to use several financial metrics, including ARR and RRR, when determining whether to invest.
Bonds and their yield
In order to determine the yield of bonds, it is necessary to consider the concept of “bond”, which is one of the main instruments of the investment stock market.
A bond is a type of security that confirms the debt relationship between the lender (the owner of the bond) and the borrower (the one who issued the bond). Essentially, buying a bond is buying debt. So why buy other people's debts?
Bonds have 2 prices:
- Nominal. This is the price when the bond is issued, which must be returned upon the expiration of the bond term.
- Market. This is the price at which that bond trades on the stock exchange.
The market price is influenced, first of all, by the reliability of the investment. This means that during the turnover process, securities either rise in price or fall. As the bond matures, its value decreases significantly.
The current yield on a bond can be calculated using a simple formula:
Dtek = (D/K) * 100%, where:
- Dtek - current yield of the bond;
- D - income;
- K is the bond rate.
Stocks and their returns
A share is a type of security that provides its owner with a portion of the company's profits. Profits are usually paid out in the form of dividends. Such income can also be received in the form of a margin if the market value of the paper increases.
Shares have a nominal, issue, book and market value. Each of them has its own characteristics:
- The par value is indicated on the face of the share. The total amount of the company cannot exceed the amount of the authorized capital.
- The issue price reflects the price of a share when purchased by its first holder, after its placement on the stock market.
- Book value is the result obtained by dividing a firm's book value by the number of shares outstanding.
- Market value is the price at which a stock trades on the secondary market.
Stocks have their own returns. This value is an indicator that allows you to estimate the amount of profit received during the ownership of the share from the moment of its purchase.
The profitability of a stock can be calculated using the formula: Dakts = SK – PC / PC, where:
- DAC is the return on the stock;
- SK – total capital received from the time of purchase of the share;
- PC is the initial capital that was invested in the acquisition of shares.
Any security has its own profitability. It can be calculated using the above formulas. But how can you find out about the profitability of securities purchased on the secondary market a week, an hour, a year ago? Is there a way to find out how much profit the purchased shares brought to their owners? For this purpose, security yield ratings were created.
Profitability and rating
The yield rating is a rating of securities that have brought their owners the greatest profit over the previous period (usually a year). It is compiled based on data from stock exchanges around the world. The assessment of the investment attractiveness of shares (bonds) is taken into account. According to this assessment, securities are assigned a rating index from A+ to C-. A+ is the highest quality, and C- is therefore very low quality. The rating reflects the security's reliability, profitability and dividend payout. The rating index from A+ to C- was developed by Standard and Poor's Corporation.
In fairness, it is worth mentioning that it is quite common to see profitability ratings in professional printed publications, but this does not mean they are reliable. These are only competent expert opinions.
But it is better for novice investors to use such ratings as a cheat sheet. In most cases, securities from such lists do not bring high returns. But this is almost always a win-win option for those who are not chasing super-profits, but want to preserve their capital and even increase it a little. Such ratings often include preferred shares. In addition, the rating allows you to evaluate securities over time, view their history, analyze the benefits of an acquisition, etc.
In most cases, the ratings look like twin brothers. Traditionally, Russian stock ratings include such organizations as Sberbank, Gazprom, Surgutneftegaz, MTS, Megafon and other giants.
There are ratings for common and preferred shares.
Future cash receipts, reduced to present estimates, determine how the rate of return (rate of return on investment) of the project is calculated.
In accordance with this method, future cash receipts (after taxes and depreciation) are discounted annually using discount factors of a specified value until the current value of future cash receipts, reduced to the present value, over the life of the project becomes equal to cash investments. [p.68] The credo is followed by long-term goals and political guidelines. At Matsushita, important goals are growth rate, profit margin per unit of sales, and company performance [p.83]
Growth rate 78 61 Rate of return on all assets 33 56 Market share 89 56 [p.103]
It shows the same trend as the rate of profit. The RMT group has a peak level of the relationship, and when the influence of the firm's growth rate and its market share are separated, the relationship takes the form of a parabola. [p.131]
Market share affects rate of return (ROT). The market share of a diversified company was calculated by summing the shares of all products multiplied by the ratio of each product's sales to the company's total sales. It also affects the ratio of equity capital to total assets. The larger the market share, the higher this ratio. The impact of business growth rate on profit margins is stronger than the impact of market share. It also has some influence on the ratio of equity capital to total assets, but less than the market. [p.133]
This means that there are no significant differences in profit margins between the functional organizational structure and the divisional one. [p.146]
Operational efficiency is related to product range. The most successful companies are those that produce products related to sales and technology. However, a specialized company can also achieve good results if its product is in rapidly growing demand and covers a significant market share. Companies with technologically related products and companies producing unrelated products have a lower standard deviation of profit margins because their market is diversified. [p.147]
There are many assessment methods - expert estimates of the expected rate of return, probabilistic [p.277]
Products that have a higher return on sales than other products in the market, or that exceed sales volumes as planned, or that become market leaders in terms of sales volume, are considered successful. Unsuccessful products either give a lower profit margin (to sales volume) than others, or their sales volume turned out to be less than planned, or they occupy a weak position in the market. [p.287]
Profit rate (to the volume of production [p.290]
The hired labor not only pays for itself, but also serves as a source of surplus value, which the capitalist appropriates free of charge. In accordance with this, Marx distinguishes between constant capital and variable capital and “The part of capital that is transformed into means of production... does not change the magnitude of its value” and is therefore called constant capital. Without creating new value, as it wears out, it transfers its value to the product created with its help. “On the contrary, that part of the capital that is converted into labor power changes its value in the process of production. It reproduces its own equivalent and, moreover, the surplus,” i.e. surplus value m. This part of capital is v. Marx calls the ratio tn/v the rate of surplus value and “the exact expression of the degree of exploitation of labor” (ibid., p. 151), and the ratio m/( +v) the rate of profit. In his opinion, this value decreases with time. [p.10]
Capital t Rate of profit Consumed C Cost [p.11]
According to Table 1, equal capital in different industries brings different profits. But this is impossible under equilibrium conditions, since capital will move from industries with a lower rate of profit to industries with a higher rate of profit until a uniform average rate of profit is established for all industries. Therefore, says Marx, this table must be corrected. [p.11]
The purpose of selection is to identify and weed out unsuitable ideas as early as possible. In most companies, specialists must present ideas for new products in writing on standard forms, which are then submitted to the commission for consideration of new products. Such an application contains a description of the product, the target market and competitors, and makes rough estimates regarding the size of the market, the price of the product, the duration and cost of work to create a new product, the cost of its production and the rate of profit. [p.330]
Demand typically determines the maximum price a firm can charge for its product. Well, the minimum price is determined by the company’s costs. The company strives to set a price for the product such that it fully covers all costs of its production, distribution and sales, including a fair rate of return for the effort and risk involved. [p.363]
Nevertheless, the method of calculating prices based on markups remains popular for a number of reasons. First, sellers know more about costs than about demand. By tying price to costs, the seller simplifies the pricing problem for himself. He doesn't have to adjust prices too often based on fluctuations in demand. Second, if all firms in an industry use this pricing method, their prices are likely to be similar. Therefore, price competition is reduced to a minimum. Thirdly, many consider the average cost plus profit method to be fairer to both buyers and sellers. When demand is high, sellers do not profit at the expense of buyers and at the same time have the opportunity to receive a fair rate of return on their invested capital. [p.366]
Another method of cost-based pricing is target profit pricing. The company seeks to set a price that will provide it with the desired amount of profit. General Motors Corporation uses a similar method. It sets prices for its cars in such a way as to get a 15-20% return on invested capital. The same method is used by utility companies, for which there are restrictions on the size of the profit margin. [p.366]
The current price level pricing method is quite popular. In cases where the elasticity of demand is difficult to measure, firms believe that the current price level represents the collective wisdom of the industry, the key to obtaining a fair rate of return. And besides, they feel that sticking to the current price level means maintaining a normal equilibrium within the industry. [p.370]
In recent years, many firms have been forced to increase their prices. They do this, aware that rising prices cause dissatisfaction among consumers, distributors and their own sales staff. However, a successful price increase can significantly increase profits. For example, with a profit rate of 3% of sales volume, an increase in price of just 1% will allow, with a constant sales volume, to increase the profit margin by as much as 33%. [p.389]
Despite the growth in sales, recent price cuts are associated with a number of serious negative aspects for manufacturers. One such unfavorable factor is that lower prices mean lower profit margins. Another is that rapid price changes can render some models obsolete before they even become available to consumers. For example, a firm might design a low-cost model as an alternative to one of its more advanced computers. But if a manufacturer has to unexpectedly reduce the price of an expensive model, producing a cheap new product will lose its meaning. Something similar happened with Texas Instruments. It was well into development of the Model 99/2, which would sell for $99.95, when price cuts by other companies forced the company to cut the price of its more advanced Model 99/4A to $99. Under these conditions, the 99/2 model will probably have to be abandoned altogether. [p.392]
But even if a manufacturer can afford to create its own distribution channels, in many cases it will earn more if it increases investment in its core business. If manufacturing provides a profit margin of 20%, but retailing is estimated to provide only 10%, the company will not want to engage in retail itself. [p.399]
A test equipment manufacturer has created an audible alarm to detect loose mechanical connections in any machine with moving parts. The company's management believes that the product will find a market in all industries that use or produce electric motors, internal combustion engines or steam engines. And these are the aircraft industry, the automotive industry, the railway, canning, construction and oil industries. The company's sales force is small, and the question arises as to how to most effectively cover all these very different industries. Based on the results of the discussion, management settled on options for distribution channels. 1. Increasing the number of full-time sales specialists of the company. This may take the form of either assigning sales representatives to sales zones and assigning each of them the responsibility of maintaining contact with all potential buyers in his zone, or creating a separate sales force to serve each individual industry. 2. Involvement of third-party organizations as manufacturer representatives in different regions or industries for the sale of new testing equipment. 3. Selection of distributors in different regions and/or industries who agree to purchase a new product and trade it8, and providing them with the exclusive right to distribute the product, as well as providing distributors with an appropriate rate of return, training their specialists in handling the product and providing support in carrying out promotional activities sales promotion. [p.412]
Discount stores. A discount store sells standard items at lower prices by reducing profit margins and increasing sales volumes. Simply using discounted prices from time to time and organizing sales does not make a retail outlet a discount store. Selling low-quality goods at cheap prices does not make it so either. A true discount store has five characteristics: 1) it consistently sells at prices below those prevailing in establishments with high markups and low inventory turnover; 2) it emphasizes branded goods with a national distribution, so that low prices do not necessarily imply low quality products 3) it operates according to the self-service method with a minimum of amenities [p.447]
A discount store is a retailer that sells standard items at lower prices by reducing profit margins and increasing sales volumes. [p.478]
It is calculated based on discounting financial flows and allows taking into account the relationship between capital and time. The issue of measuring money spent and received in different months and years is resolved by using the concept of “interest”, which translated from English means “interest” or “interest”. This value is called the discount rate, profit rate or interest rate. [p.241]
However, according to our survey, there is not much difference between the levels of vertical integration of each diversification category, as can be seen from Table. 4.6. Here, the level of vertical integration is measured by value added divided by sales minus profit margins. This is a representative variable and, moreover, it does not express quasi-vertical integration. [p.123]
Among the diversified companies, the RMT companies are the largest and the U group the smallest. This seems to show that synergies are important. Sharing research and production capabilities leads to economies of scale. In addition, the sharing of the distribution network, buyers and consumers, distribution systems and the overall image of the company brings benefits of distribution scale. Companies with unrelated products (U) have the least synergies and therefore have the lowest profit margins. Companies with technology-related products (RT) and distribution-related products (RM) have partial synergies and therefore have average profit levels. Thus, we support 1.2 above. [p.130]
We examined the difference in operational effectiveness in cases where strategy and structure are consistent with each other and when they are misaligned. A spec company can use both a functional and a divisional structure, and there are no problems of mismatch here. When diversified companies introduce a functional structure, this can be perceived as a misalignment, so we examined the difference in profit margins of diversified companies depending on whether they are functionally or divisionally organized companies. In an earlier period (1962-1972), the return on investment was (functionally [p.145]
According to the results of our analysis, research costs are higher for highly internationalized companies, and below average for moderately internationalized companies. This may be explained by the fact that in the latter case, not only effective, but also capital investments that turned out to be not entirely successful are taken into account. For example, foreign investments in synthetic fiber producers turned out to be ineffective. Therefore, the author divided highly and moderately internationalized companies into two groups: those that operate efficiently and those that operate inefficiently. The dividing line between these two groups of companies is at the level of a 9% rate of return (based on the entire capital of the parent company, we assume that the functioning of the branches affects the efficiency of the parent company). A high-performing multinational company has much higher R&D expenses than 3.49 versus 1.76%. This suggests that companies that actively use new technologies can invest capital abroad more successfully, despite the fact that the effectiveness of the parent company is influenced by its activities not only abroad, but also in its own country. [p.190]
X. Uzki studied the process and results of the transfer of Japanese management style in 30 subsidiaries of Japanese corporations in Brazil and found that they functioned better than those that did not use Japanese management methods. He established 10 forms of using the Japanese management style: articulating a business creed, lifelong employment, changing jobs in the company, promotions and salary increases based on seniority, the principle of unanimity in decision making, working in common areas in us, expanding social security, the arts management of Japanese corporations, marketing experience, control over production processes and product quality. It should be noted that the last three forms are a Japanese modification of the American management experience. In addition, Uzki found that 15 subsidiaries in which Japanese corporations own more than 1/2 of the capital use Japanese management techniques to a very large extent; 7 subsidiaries that are joint Japanese-Brazilian firms use this management experience to a lesser extent; 8 mixed-owner firms which are Japanese corporations and the Brazilian government, use Japanese management experience to the least extent. Uzki studied the operating efficiency of all these companies and found out that in terms of turnover growth rates and profit margins, it was the highest in the indicated 151. [p.224]
The firm will need to collect information on all nine market segments. This should include information about sales volumes in monetary terms, expected sales growth rates, projected profit margins, intensity of competition, requirements for marketing channels, etc. The most profitable segment should have a high level of current sales, high growth rates, high profit margins, weak competition and simple requirements for the marketing channel. As a rule, no one segment meets all these characteristics to the desired extent, so compromises will have to be made. [p.276]
One of the main circumstances causing price increases is persistent global inflation driven by rising costs4. Rising costs that do not match productivity growth lead to lower profit margins and force firms to regularly raise prices. Often, price increases outweigh cost increases in anticipation of further inflation or the introduction of government price controls. Firms are hesitant to make long-term price commitments to customers for fear that cost-driven inflation will harm profit margins. When fighting inflation, firms can raise prices in several ways5. [p.389]
Risk and return
Profitability is an effective method of qualitative and quantitative assessment of investments. It has its pros and cons. But it is an indispensable tool when analyzing the rationality of investment. Profitability has wide application in economic analysis, allowing you to weigh the decision about the need for investment. Often used in conjunction with risk indicators. When deciding on cash injections, an investor puts possible risks on one side of the scale, and the possible return on capital on the other. And if the second cup significantly outweighs, then the decision is made in favor of the investment.
We can say that profitability and risks are equilibrium concepts. They are always interconnected. The unspoken law of traders: the higher the risk, the higher the profitability. Every trader strives to reduce, calculate risk and increase profits.
This is how the stock market works. Every investor makes calculations and finds out where the profit is hidden.
Lever No. 3 - I want more profit
The rate of capital growth is another way to influence financial performance.
How can an ordinary person do this (if we exclude all kinds of speculation)? Choosing the right class of tools. With an acceptable return.
In investing, risk and return are always related. Low-risk instruments (usually deposits, reliable bonds) offer investors low returns. At the same time, high-yield instruments (junk bonds) in return carry increased risks. And the investor may not receive the declared return due to the bankruptcy of the issuer.
The stock market is a kind of middle point. It is in shares that the investor should concentrate his main investments. In the long term, the stock market consistently outperforms inflation and bonds. Giving an acceptable return.
For example, the average return of the US stock market is 10% per annum. In Russia it is more than one and a half times. But we also have higher inflation.
The table shows an example of how the final result changes with different rates of annual return (6-10%) and an annual investment of 100,000.
| Duration, years | Yield 6% | Yield 8% | Yield 10% |
| 10 | 1.39 million | 1.56 million | 1.75 million |
| 15 | 2.46 million | 2.93 million | 3.5 million |
| 20 | 3.9 million | 4.94 million | 6.3 million |
| 25 | 5.81 million | 7.9 million; | 11 million |
| 30 | 8.38 million | 12 million | 18 million |
| 35 | 12 million | 19 million | 30 million |
| 40 | 16 million | 28 million | 49 million |
Notice how a small increase in annual return has a big positive impact on the bottom line. Especially over long periods. Bringing additional income of several million.