Real GDP (gross domestic product) is the sum of the final values of all products produced in the country, expressed in real prices of the period chosen as the base. Direct summation assumes that goods are grouped and their prices are added up, then the total is found. You can also think of real GDP as the ratio of nominal to price index. Typically, the GDP deflator is used to make the calculation. Units of measurement are cash. For convenience, it is generally accepted in the world to calculate it in American dollars.
Economic growth and its factors
Economic growth is the change in the volume of goods and services produced in a country.
Factors of production can grow in two ways:
- Extensive , that is, quantitative growth, can occur due to:
— increasing the number of workers employed in production/services.
- increasing the amount of investment (provided that equipment and production technologies do not change);
— increasing the volume of consumed raw materials, fuel, energy and other resources.
For example, in order to bake more bread, the owner of a bakery can hire new workers and purchase more flour for baking bread, meaning his production costs will increase. Thus, by increasing the quantitative characteristics of production, the enterprise will grow.
- Intensive , that is, high-quality growth is achieved through:
— use of new technologies, more modern and high-quality equipment in production;
— improving the qualifications or level of education of employees;
— increasing the quality and organization of labor;
— improving the use of resources (eliminating time wastage, waste-free production) or improving the quality of resources.
For example, let's take the same bakery. If an entrepreneur decides to go the intensive route, he will replace the old equipment with more modern equipment, train workers to service the new equipment (that is, improve their skills), draw up a new work schedule in which the new equipment will not be idle, and purchase premium flour to produce higher quality food. product.
In reality, intensive and extensive development paths do not exist in their pure form. As a rule, they are combined in different ratios. An example of such a combination would be a farmer who decides to expand the scale of his farm. He can simultaneously use both extensive (buy more animals and land for agricultural crops) and intensive (purchase new, more modern equipment, better quality animal feed or crops for sowing).
Methods for calculating GDP
The main methods for calculating GDP include:
- GDP by income is the sum of national income, depreciation, taxes, subsidies, net income from other countries, net income of foreign citizens (those who work in the country). In turn, the first indicator - national income - is also the sum of wages, rent, interest payments and corporate profits. This GDP formula is used in the UN System of National Accounts.
- GDP by expenditure is the sum of final consumption, gross capital formation (this is all the costs of purchasing machinery, equipment, production space and inventories), government spending and net exports. End use refers to all expenditures for the needs of society.
- GDP by value added is calculated by summing two value added: firm and total. The first of them consists of the firm’s income and the intermediate cost of the goods. The second is the sum of the total level of output and the total value of production.
The GDP indicator is necessary for:
- Comparisons of production levels over different time periods.
- Establishing an objective picture of the economy of various states.
- Accurate assessment of changes occurring in the economy.
- Determining the economic state of a country at a specific period of time.
Everyone knows from school that a decline in GDP indicates that an economic crisis may break out. But sometimes, if the GDP indicator decreases, this may indicate that the growth of one product is falling, while another may unexpectedly increase. A good example is the replacement of traditional products with new developments.
Economic growth in developed countries
At the present stage of economic development, when economic life is greatly influenced by the scientific and technological revolution (STR), economic growth acquires new characteristics:
Firstly, a transition is made from partially intensive development to fully intensive development. At the same time, producers can save all types of resources, including labor, that is, economic development becomes resource-saving.
Secondly, the practice of producing specialized products created for a specific person is developing, and the costs of their production are being reduced (for example, the ability to print T-shirts, mugs and notebooks with an individual design is now available in any city, and the cost of such individualized goods does not greatly exceed cost of mass goods).
Thirdly, the increase in production occurs only due to technical progress.
Fourthly, the role of the human factor in production is overestimated. In the modern world, human work is becoming more comfortable and safe; various methods of stimulating labor are used (wage increases, bonuses).
Fifthly, it becomes possible to allocate more funds for environmental protection, for example, enterprises allocate money for treatment plants, and human waste is recycled. There is an emerging trend towards preserving irreplaceable natural resources (coal, oil, gas). In most modern countries, environmental protection and economic development are under state control.
What is not shown in GDP
Despite the fact that GDP is the main tool in making forecasts and conducting analytics, it cannot reflect the following:
- GDP is an indicator of the level of well-being of the entire country. For example, if two countries have the same GDP, but different prices, this means that a certain monetary unit accounts for different amounts of goods.
- GDP cannot in any way indicate the quality of goods produced and services provided.
- GDP cannot reflect the activities of all those categories of citizens who exist outside the market. This includes, for example, the work of housewives or those scientific developments of scientists that no one pays for them.
- GDP will never be able to include the profitability of the shadow sides of the economy, and they exist to one degree or another in every state.
- GDP does not affect the subjective factor - that is, how satisfied people are with work and leisure time.
- Instead, GDP includes undesirable gross product - this is industrial and life waste, various pollution, overpopulation of some countries, life expectancy, etc.
Thus, from all of the above it is clearly seen that the level of GDP cannot in any way be considered not only an indicator of the well-being of the population, but also an indicator that determines economic trends.
Economic growth rate. Concept of GDP
Economic growth is measured by the dynamics of real gross domestic product (GDP), that is, the volume of all goods and services produced in a country over a certain period of time (usually a year) or per capita.
Formulas for calculating growth rate and growth rate (in percent)
The growth rate is a measure of changes in the volume of GDP. It reflects how many times the GDP of one specific year (for example, 2019) is greater or less than the GDP of another year (for example, 2020).
In the case of positive economic growth, the volume of GDP increases from year to year, as a result of which the standard of living of the population increases, various categories of human needs are more fully satisfied, and the state has the opportunity to solve socio-economic problems.
In the case of negative economic growth, the volume of GDP falls from year to year, this is due to economic problems or a crisis in the country, leading to a deterioration in people’s living standards and the emergence of socio-economic conflicts.
Practical skills
TR. shows what percentage one number is of another. Using TP, you can calculate by what percentage a number has increased or decreased relative to another.
Using Formulas
TR cannot be negative, but TP can. TP is determined on the basis of TP, the reverse order is unacceptable. To calculate the value, PP is used, since it clearly reflects the dynamics of changes.
These parameters are of great importance for the analysis and planning of indicators in science, statistics, economics and other fields. Their use is widespread in optimizing sales revenue, wages, turnover, and cash.
Using an example, you can calculate the growth rate as a percentage. A factory worker received a salary every month depending on output. In January, the employee received 40,000 rubles, in February 45,000 rubles. TR is based on the formula: 45000/40000*100 = 112.5. Thus, in February, income relative to the previous month can be calculated as 112%.
Formulas are widely used in everyday life of the population. There is an online calculator on the Internet that allows you to get a real result or check your own solutions. Their use allows us to omit calculation errors.
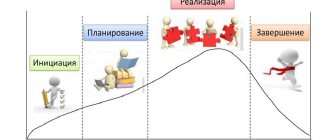
Business cycle phases
Peak – full use of human capital, expanded production, increased income.
Recession is a decrease in production, profit and investment.
Crisis - the economy is at the bottom.
Stagnation is stagnation of economic activity, production and trade, increasing unemployment and decreasing wages.
Revival is a state that returns prosperity to the economy: an increase in income and production, a decrease in unemployment.
The reasons for the cyclical development of the economy are divided into:
- External – local state conflicts, natural disasters, lack of resources.
- Internal - policies pursued by the state, the level of equilibrium between supply and demand, new goods displace old ones in the trade market.
The crisis is characterized by a decrease in produced goods and income, falling prices and wages, and a deterioration in the quality of life.
Nominal GDP
Nominal GDP is an indicator that is calculated in current prices that are available in a given period of time. Essentially, this is the cost of all production at current prices. Accordingly, when prices rise, nominal GDP will always increase. Therefore, it is also impossible to objectively judge the state of the economy based on the indicator of nominal GDP. This type of GDP can be expressed in national currency (at the rate of the Central Bank of Russia), and in international currency.
GDP provides the greatest information content only if the country has very low, close to zero, inflation.
The calculation period for nominal GDP is not necessarily one year; it can also be a month, a quarter, or a half-year.
In addition to prices, nominal GDP also depends on the income of the population and its purchasing power. Calculating the level of GDP is quite simple; all you need to do is use the formula:
- Vn= Q1xP1 + Q2xP2………….QnxPn
It is clear that Bn is the gross nominal product, Q is the quantity of goods, and P is their value.
Growth of indicators
The increased demand for financial services led to an increase in added value in the field of finance and insurance (an increase of 7.9%). In addition, the increase in utility tariffs influenced the growth of deflator indices of gross value added of enterprises providing electricity, gas and steam (an increase of 3.9%), water supply, sanitation, and waste disposal (an increase of 6.2%).
In 2021, the value added deflator index in healthcare will grow by 11.9%, education by 5.5% and other sectors of the public administration sector. “Final consumption of the general government sector and non-profit organizations serving households increased compared to 2021 (+3.9%), primarily due to increased spending on healthcare and other activities related to the fight against the COVID pandemic -19,” notes Rosstat.
GDP by source of income
The share of wages in the GDP structure increased from 46.3% to 49.5%. According to Rosstat, among the reasons is an increase in the volume of payments to healthcare workers and other industries involved in the fight against the pandemic.
The share of net taxes on production and imports decreased from 11.3% to 10.9% due to a decrease in tax revenues (mainly customs duties) and an increase in subsidies associated with government support measures for business.
The GDP calculation was based on current data on the performance of large and medium-sized enterprises, a report on the execution of the consolidated budget of the Russian Federation and the budgets of state extra-budgetary funds as of December 1, 2021, an assessment of Russia’s balance of payments indicators for 2021, foreign trade indices for January-November 2021 according to the Federal Customs Service.
Rosstat indicates that the volume of GDP, the composition of its components and dynamics will be clarified as the necessary information becomes available.