For those who have seriously decided to make money in the securities market, fundamental analysis has enormous knowledge. With its help, you can choose reliable companies to invest in and get good profits in the medium and long term. Today we'll talk about fundamental analysis of shares, what it is, we will analyze the main indicators and the most effective methods for evaluating companies, and also conduct fundamental analysis using the example of Facebook shares.
Quick navigation
Fundamental Analysis Methods
- Analysis of investment indicators.
- Analysis of financial indicators.
- In-depth analysis of the internal environment of the enterprise.
- Analysis of the external environment of the enterprise.
Let's look at all these types of fundamental analysis of enterprises one by one.
S. Tertyshny “Securities market and methods of its analysis”
From the title of the book it is clear that it is dedicated not to the currency market, but to the stock market. And it contains information not only on analysis. This is a full-fledged textbook that addresses such issues as characteristics and market participants, types of securities, market functioning mechanism, technical and fundamental analysis, stock indices.
For beginners, this tutorial can be a great place to start. Having understood the basic concepts, you can go deeper into specific analysis: fundamental or technical.
Analysis of investment indicators
The main task of analyzing investment indicators is to answer the question to what extent the company is undervalued by the market or overvalued.
Therefore, the logic for calculating all investment indicators is very similar. As a rule, we compare the market valuation of the company with certain financial indicators of the company. As a market assessment of a company's value, either its capitalization (EV - enterprise value, considered as the value of all shares of the company) or the price of one share is given. The financial indicator with which the company's value is correlated can be: net profit, earnings per share, cash flow, book value of the company's assets, etc.
All these investment indicators give us the opportunity to judge how adequately the company is valued in accordance with this indicator. For example, a company may have excellent financials, but its market valuation may already be so high that the company is actually overvalued. Therefore, companies with good financial performance on the one hand and low market valuation on the other will be ideal for investment.
Let's look at the main and most used investment indicators.
Main stages of analysis
The classic method of fundamental analysis includes 4 stages:
- Macroeconomic analysis.
- Industry analysis.
- Analysis of the issuing company.
- Analysis of the value of securities.
At the first stage, the investor must assess the state of the country’s economy or the world economy as a whole, that is, determine what stage it is in (growth or decline). To do this, it is necessary to study the dynamics of the main macroeconomic indicators - GDP volume, inflation growth rate, unemployment rate, per capita income, central bank discount rate, national currency exchange rate, business activity index.
All of these factors influence the stock market in one way or another. For example, if GDP increases, this indicates that companies are increasing production volumes. Profits rise and stock prices rise.
Analysis of a particular industry gives an idea of which areas of business are the most attractive from the point of view of portfolio investment. Even if the economic situation in the country seems quite favorable, this does not mean that all sectors are in the growth stage. Carrying out this analysis makes it possible to assess the level of competition in each specific sector.
The third stage of fundamental analysis is the assessment of an individual company. This method is used only by those investors who are ready to consider the purchase of shares as participation in the issuer’s business. For traders using short-term speculative strategies, it is enough to conduct industry and macroeconomic analyzes.
Valuing an individual company involves determining its fundamental value and examining its financial ratios. To assess the value of a business, an investor conducts a return on equity analysis, calculates free cash flows, and the debt-to-equity ratio. Also at this stage, an analysis of the company’s value is carried out. The issuer's reputation, type of activity, product quality, technologies used and quality of management decisions are subject to close attention.
The final stage involves analyzing the value of securities. For these purposes, investors typically use major stock multiples.
Price/earnings ratio (P/E ratio)
P/E is the most widely used and popular investment ratio. There are two options for calculating this indicator.
The first option: the ratio of the price per share of the company to earnings per share. Second option: the ratio of the company's capitalization to the company's total net profit.
Small values of the coefficient indicate that the company in question is undervalued; large values indicate that the valuation is too high. For example, the p/e of the online store AMAZON currently = 294, at the same time the Chinese online store Alibaba has p/e = 19. In the first case, the valuation is clearly overestimated, because If the company's profits do not grow soon, investors will have to wait 294 years for a return on their investment. In the second case, the valuation is at the average market level. There are companies with very low p/e, for example, Surgutneftegaz currently has an indicator of 1.8. And this means that this company is undervalued by the market. The reasons for underestimation can be different - political (sanctions in the Russian Federation), market (fluctuations in oil prices in this case), etc.
Pros:
- The indicator is widely used in comparing different companies. The P/E indicator is quite simple to calculate and can be used to work with large volumes of data (for example, a comparative analysis of all 322 shares on the Moscow Exchange).
Flaws:
- A significant disadvantage of the P/E indicator is that it cannot be used for a company that has shown losses in its financial statements. At the same time, companies that suffered a loss in the reporting period can also be attractive for investment and they also need to be assessed somehow. For example, the Tesla company, which is incurring losses because it is still in the stage of capturing the market and developing innovative areas (renewable energy).
- The net profit indicator used in the calculations is a value that the company's management can easily manipulate. In a particular reporting period, a company can deliberately, in its own interests, distort this indicator, and the P/E indicator will be very attractive.
Conclusions:
P/E is the main investment indicator for comparative analysis of companies. However, due to the fact that its calculation base contains an indicator such as net profit, P/E cannot be used to evaluate companies with losses, and should also be used with caution for small and medium-sized companies where the reliability of reporting may be in doubt. Therefore, sometimes investors need cross-analysis with other investment indicators.
What is technical analysis?
Technical analysis is the analysis of past price movements to predict future price movements. This is a very effective analysis method. In financial markets, price movements are periodically repeated and follow certain patterns. This happens because price movement depends on the actions of people, and people always act according to certain patterns.
The main tool for technical analysis is price data. Regardless of the time period chosen, price is the most important factor. A trader makes trading decisions by studying the current price movement and constantly comparing it with history.
Technical analysis can be applied to many different markets, including the stock market, forex, commodity, and cryptocurrency markets. As long as the market has sufficient liquidity and is not subject to strong external influences, technical analysis can be used in the most effective manner.
One example where technical analysis may not be as effective due to a lack of liquidity and exposure to external influences is the market for so-called penny or junk stocks.
Three basic principles of technical analysis:
- The price takes everything into account.
- Price movement is subject to trends.
- History repeats itself.
The price takes everything into account . Technical analysts believe that the current price reflects all known information available to market participants. And any new information that appears is already reflected in current prices.
Price movement is subject to trends . There are trends in price movements in the market and these trends do not move randomly. Trends appear after a period of consolidation. Then, when the trend reaches its peak, it eventually returns to the consolidation phase before a new trend phase reappears in the market.
History repeats itself . Financial markets exhibit a repetitive, recursive nature in their price data. Although no two patterns in price history look the same, there may be similarities in them that cannot be explained by price noise or randomness. These repeating patterns can be seen constantly on charts in the form of candlestick patterns, price impulses, volume, and other forms of price data.
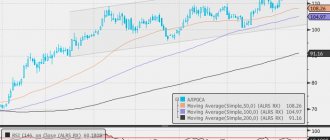
Let's look at the graph below.
You can see that whenever the price approaches the 1.0626 level, it bounces sharply away from it. This means you may want to consider shorting USD/CAD the next time the price hits the 1.0626 level.
Technical analysis is the most common way of trading in financial markets. It works like a self-fulfilling prophecy. If hundreds of thousands of traders use the same type of market analysis, they will trade the same way. The fact that all traders are trading the same way causes the price to move in the same direction.
Two times in a row, the price direction in the USD/CAD currency pair changed sharply at the level of 1.0626. The next time the price reaches 1.0626, thousands of traders will open positions on the bounce from the level because they are expecting a reversal.
This type of analysis takes into account:
- Current market state: trend or consolidation.
- Support and resistance levels.
- Technical indicators.
- Price action patterns.
You should know that technical analysis is not as simple as it seems. Your predictions will not always be correct. Learning technical analysis will take time and constant practice.
Sometimes you may hear that technical analysis is more of an art than a science. This is so because when we try to predict future price movements using technical analysis, there can be many nuances that can sometimes lead to different conclusions.
Technical analysis is the study of candlesticks, chart patterns, indicators, oscillators, trading volume and much more.
Technical analysis is not at all similar to fundamental analysis, but both together provide investors and traders with a complete set of analytical tools needed for maximum profitability. It is recommended that all traders considering fundamental analysis also consider learning technical analysis.
For example, searching for the right asset and doing all the research in the world will not be profitable if the asset recently reached an all-time high or is showing severe overbought conditions on a technical analysis indicator such as the RSI. When combined with buying at the bottom of a downtrend or when the RSI enters oversold territory, this can minimize risk and maximize overall profit.
Price/Revenue Ratio (EV/S Ratio)
EV/S is a financial indicator equal to the ratio of a company's market capitalization to its annual revenue.
This indicator is also one of the main investment indicators by which companies can be compared. Small values of the coefficient indicate that the company in question is undervalued; large values indicate that the company is overvalued.
Pros:
- A significant advantage of the EV/S ratio is that it does not take negative values, like the P/E ratio, and is also more resistant to manipulation by the company. Therefore, it can also be used to evaluate those companies that incurred a loss in the reporting period.
Flaws:
- This indicator does not allow us to assess the internal strength of the company's business. How different companies turn the same amount of revenue into different financial results.
- A limiting factor in the use of the indicator is that only companies in the same industry can be compared, where it can be said that revenue should generate similar amounts of profit.
Conclusions:
The indicator is good to use for comparative assessment of companies in the same sector and in this case it perfectly complements the P/E indicator.
Technical Analysis Tools
Technical indicators
A favorite among technical traders. There are many different technical tools. For example, momentum indicators such as MACD or RSI. Trend indicators such as moving averages. Volatility indicators such as Bollinger Bands and Keltner Channels.
Price action
Price is the most important tool in technical analysis. The current price reflects the motivation of all market participants and shows the balance of supply and demand at any given time. Many technical traders rely solely on price action, combining support and resistance levels with candlestick patterns to gauge potential future price movements.
Analysis of figures on a chart
Some traditional patterns include head and shoulders, double top and double bottom, and cup and handle formations. There are also harmonic patterns such as Gartley, Bat or Butterfly.
Traders have a natural tendency to recognize patterns, and this is reflected in our desire to find patterns on charts.
EV/EBITDA ratio
Unfortunately, there is no normal name for this indicator in Russian. That’s why they say “EVe / EBIDA”. We already know what EV is. This is Enterprise value or capitalization. Now let's understand what EBITDA is. Literally, this indicator stands for Earnings before interests, taxes depreciation and amortization, which translated means “earnings before interest, taxes and depreciation.”
Essentially, this indicator is something between P/E and EV/S.
Pros:
- Since the EBITDA indicator takes negative values much less often (only in deeply unprofitable businesses and companies close to bankruptcy, but no one is interested in the valuation of such companies), at the same time this indicator is more difficult to manipulate than profit. In addition, based on the EBITDA indicator, you can compare not only enterprises from different industries, but also enterprises located in different countries with different interest rates on loans and different tax regimes. This allows investors to better understand how effective a particular business really is.
Flaws:
- The main disadvantage of this indicator is the complexity of the calculation. Unlike P/E and EV/S, you can’t get away with just one figure from the reporting. In addition, the depreciation indicator does not directly appear in the reporting of enterprises. You'll have to dig around to find it. That's why private investors don't like to count EBITDA. As a rule, this indicator is considered when assessing large investment mergers and acquisitions, purchasing ready-made businesses, direct investments in businesses, etc.
Company news and events
What news and events have happened to companies recently, the stronger the news, the more significant impact it has on the price of shares
The main criterion is reliability, legitimacy, efficiency
- FINAM - company news from the largest broker in Russia
- Interfax is a center for the disclosure of corporate information from the largest private news agency in Russia
- Otkritie - news from the broker depository Otkritie
Capitalization/Cash Flow Ratio (EV/CF).
In this ratio (EV/CF), a new indicator for us is CF (or Cash Flow). This is the company's cash flow.
There are two options for calculating cash flow. In the first case, cash flow is understood as the total cash flow from the main activities of the enterprise. The second calculation option is when cash flow is understood as net cash flow from core activities (FCF - free cash flow).
The first option is inherently very close to the EV/S indicator, but adjusted for real money (relevant for evaluating businesses with long production cycles and long periods of deferred payments - machine tool industry, large mechanical engineering, etc.).
The second option is more common among professional investors; it is one of the most favorite and reliable investment indicators. Investors love multi-period EV/FCF the most because it is the most objective indicator and is very difficult to manipulate in reporting. In addition, it is easier to calculate it than the same EV / EBITDA. It is enough to take just one figure in the cash flow statement.
Flaws:
- Just like P/E can take negative values. In addition, in Russian reality, companies are required to provide a cash flow statement only once a year, which significantly reduces the analytical value of this indicator for an investor in the Russian market, because it cannot be used for a year. There are no such problems with American companies.
So, let's draw conclusions about which indicators are best used and when. The main indicator with which we recommend starting to evaluate or filter the market is the P/E ratio. Net profit is what any enterprise exists for, it is the final result of its activities. But as we have already said, in a number of cases (small companies, temporary losses at the investment stage, etc.) it is better to verify this indicator and confirm the investment potential with the EV/S indicator.
For private investors, EV/EBITDA will complicate the analysis procedure, but will not provide additional information for decision-making.
As for EV/CF (or EV/FCF), these indicators can be used instead of P/E when analyzing companies in the American market.
We usually use only the P/E indicator, but we supplement investment analysis with other methods for assessing the development prospects of the enterprise (financial analysis and, if necessary, conduct an in-depth analysis of the internal and external environment of the enterprise).
Qualitative characteristics
When analyzing a company, four main indicators are always taken into account:
- Business model
: what exactly does the company do? Example: A company's business model is based on selling instant chicken. Does the company make money from this? Or does the bulk of your income still come from royalties and franchises? - Competitiveness
: A company's long-term success means the ability to maintain and maintain a competitive advantage. In this case, the company's shareholders can receive decent dividends for decades. - Management
is an important investment criterion. Even the best business model is doomed if company leaders fail to execute the plan properly. It is difficult for retail investors to truly evaluate managers in person. But you can always take a look at the corporate website and check the resumes of senior management and board members. How well did they perform on previous tasks? - Corporate governance is the policy of an organization; relationships and responsibilities between management, directors and stakeholders. Policy is defined in the company's charter and its internal regulations, as well as in corporate legislation and by-laws. Investors prefer to do business with a company that is managed ethically, fairly, transparently and efficiently. If this is not the case, the company’s management probably does not want this.
- Company industry: customer base, market share, industry-wide growth, competition, regulation and business cycles. Studying a company's industry will give an investor a deeper understanding of its financial health.
Analysis of the company's financial indicators.
The first and main task of analyzing financial indicators is to determine how efficiently the business is currently operating. What are its strengths (for example, low costs or low credit burden) and weaknesses (are there any non-payments from customers, is there a lot of debt, etc.).
Having determined the current performance of the business, we must assess the dynamics of the company’s development and its stability. Is the financial result achieved in the current period a pattern or is it an accident typical only for this moment. This can apply to both good financial indicators (for example, high profits) and bad ones (for example, a loss). Sometimes it is impossible to immediately say whether it is good or bad; it is necessary to evaluate the history of the development of the situation. For example, a loss may be caused by the fact that a company enters a new promising market and incurs increased promotion costs (such as Tesla). Or the profit could have been generated not as a result of effective activity, but as a result of the sale of property. Therefore, for a correct assessment, it is necessary to look at how the indicators have changed over time.
As a result, having assessed the current state of the company and the dynamics of its development, we can confidently assume its future financial performance, provided that the external business environment does not change much.
To calculate any financial indicators for a company, its statements are used. There are 3 main forms of financial reporting. Moreover, their essence is the same for both Russian and foreign companies.
Financial statements of the enterprise:
- Balance sheet;
- Income statement;
- Cash flow report.
It is important to understand that for a full analysis it is necessary to use all 3 forms. Since each of them describes only one facet of the financial and economic life of an enterprise. As a result, when analyzing 3 forms, we get almost a “3D analysis” of the enterprise. We described in more detail how to conduct financial analysis in practice, what indicators to calculate from reporting and how to interpret them in the article “financial analysis for investors.” There you will also find real examples of analysis of company reporting.
R. Hagstrom “Warren Buffett. How to turn 5 dollars into 50 billion”
Warren Buffett needs no introduction. The best books on investing will definitely have a place for literature dedicated to one of the richest and most successful investors in the world. W. Buffett is a strong supporter of fundamental analysis. The results of his investment activities and his billion-dollar fortune leave no doubt about the effectiveness of this approach when choosing stocks.
The book introduces readers to the basic rules of being a great investor. W. Buffett himself claims that his operating principles can be applied by any person or company. The author of the book also tries to prove this. However, this printed work cannot be called a full-fledged textbook on fundamental analysis. This is rather a success story of a world-famous investor. But what prevents you from taking your rightful place in the world of investment?
The book is not a step-by-step instruction for action. It teaches the correct thinking of a real investor: one should not give in to emotions; the basis of successful investing is the calculation of potential and risk.
In-depth analysis of the internal environment of the enterprise
In most cases, investment and financial analysis is sufficient to make a decision to buy shares. But these will be average investment ideas that lie on the surface, which all investment analysts talk about in their reviews, etc. This is a good and stable investment for the long term. Examples of such companies currently on the Russian market: Surgutneftegaz, MMC Norilsk Nickel, Phosagro. In the American market - Walt Disney, Apple, Johnson & Johnson. These companies are united by the fact that they all have excellent financial performance, a low p/e for their industry, a stable position in the market and stable development dynamics.
The main disadvantage is that all more or less experienced investors see this. As a result, such shares will not give us extremely high returns. Most likely, the profitability will be at the average level for portfolio investments, no more than 30% per annum.
To find more powerful investment ideas, you need to dig deeper. In order to see more than in the financial statements, you can use the following official sources of information:
- Presentation for investors (example, presentation of MMC Norilsk Nickel).
- Consolidated financial statements and audit reports (example, consolidated statements of MMC Norilsk Nickel).
- Information disclosure report (example, quarterly Report of MMC Norilsk Nickel).
- Results of shareholder meetings (for example, shareholder meetings of MMC Norilsk Nickel).
- And etc.
Quantitative and qualitative analysis
Quantitative analysis is carried out using factual statistics, measurements, financial ratios and other forms of quantitative research.
The practice of quantitative analysis allows you to evaluate everything from product sales performance, profit margins, operating expenses, return on assets and much more.
Quantitative analysis involves mathematics and numerical analysis, including stochastic calculus, linear algebra, statistics, probability, and econometrics.
Quantitative analysis can be used to develop algorithmic trading strategies, portfolio optimization, liability assessment, risk management, credit analysis and much more.
Qualitative analysis requires critical thinking. Each trader has his own type of analysis.
For example, does the company you're considering have a specific corporate culture? Do you expect the industry to take off soon? Do you like the product the company produces?
This is the type of solution that all the computing and computer data in the world cannot provide. Data that cannot be quantified in any meaningful way falls into this category.
During a recession, it may be more profitable to trade gold or oil as the volatility of these assets increases; when the economy is booming, trading stocks and cryptocurrencies may be more profitable.
Presentation for investors.
For example, from the presentation you can learn: - the company’s strategy for the next 5-20 years. — how the company itself assesses its potential, its competitors and the markets in which it operates. — find out physical indicators (tons, pieces, etc., since growth in revenue and production in financial indicators may be partially caused by inflation or exchange rate changes, which gives only a temporary effect and does not indicate the real growth of the company). — detailing of some indicators (details of income by product, market, etc.) — and other clarifying information.
It is worth remembering that companies will try to present only exclusively positive facts in their presentations. Therefore, almost all forecasts can be divided by 2. But knowledge of these forecasts can help us evaluate the company’s real performance in the future. Are they executing their strategy? What will they say in the next presentation if they don’t fulfill it, etc.
Market Sentiment Analysis
Market sentiment analysis is another unique type of analysis that shows how traders will react to certain news. For example, when important events occur, such as Brexit or the US elections, they have a huge impact on the market. However, not on their own, but because traders will trade based on how, in their opinion, these events will affect the market.
Disclosure Report.
The disclosure report is prepared in accordance with the securities market law. All enterprises whose securities are traded on the Moscow Exchange are required to do it quarterly. The advantage of this report over the annual one is that it is quarterly. The main disadvantage is that the figures in it are published in accordance with Russian accounting standards (RAS).
There are 8 sections in the disclosure report:
- Information about bank accounts, about the auditor (audit organization), appraiser and financial consultant of the issuer, as well as about the persons who signed the quarterly report.
- Basic information about the financial and economic condition of the issuer.
- Detailed information about the issuer.
- Information on the financial and economic activities of the issuer
- Detailed information about the persons included in the issuer’s management bodies, the issuer’s bodies for control of its financial and economic activities, and brief information about the issuer’s employees (employees)
- Information about the participants (shareholders) of the issuer and about transactions carried out by the issuer in which there was an interest
- Accounting (financial) statements of the issuer and other financial information
- Additional information about the issuer and the issued securities placed by it.
The most interesting for investors are usually sections 2,3,4,5,6,7. From this report you can also get all the necessary detailed information on the numbers, as well as find out the ownership structure of the company (for example, state participation), the legal structure of the business (all subsidiaries and dependent organizations), etc.
Exchange quotes
Information about the current price of shares on stock exchanges, i.e. at what price can you buy or sell shares now?
The main criterion is the frequency of updating exchange data and access speed. Here the top three look like this:
Moscow Exchange quotes:
- FINAM - selection by instruments + charts
- BKS - quick access to Moscow Exchange quotes
- Moscow Exchange - history of Moscow Exchange quotes
- Smart-lab - quotes + quick analysis
Foreign exchange quotes:
- Investing - American stock exchange quotes
- FINAM - selection by instruments + charts
- Trading view - US market quotes with deep filters
- Smart-lab - quotes + quick analysis
Results of shareholders' meetings.
From these reports you will learn when and how much dividends are planned to be paid, about the largest transactions, about changes in management, about additional issues, etc. Just recently there was a meeting of shareholders of the Lenzoloto company, at which it was decided not to pay dividends, despite good profits, as a result of which the company’s quotes collapsed for the first time in several years of growth. However, the market reacted too violently to the news and prices leveled off significantly on the same day.
By the way, we made good money on this. Want to know how? Come to our master classes, where I tell such examples live.
And lastly, but sometimes this is the most important thing - an analysis of the external environment.
Disadvantages of Technical Analysis
Here are some disadvantages of technical analysis:
Mixed signals
There will be times when your technical analysis tools will produce mixed or contradictory signals. For example, based on your analysis of support and resistance levels, you may receive a buy signal, but your MACD indicator may indicate a sell.
Overanalysis
A condition in which traders analyze the market too closely that it becomes difficult for them to make the right decision. This usually happens when a trader tries to reconcile all the factors, which is rarely possible in real-time trading. In trading we deal with probabilities, not certainties.
We must act based on incomplete information
With the plethora of technical tools available to traders, some fall into the trap of overanalyzing and failing to make a trading decision. The best solution to this problem is to try to simplify everything.
Our market analysis may be influenced by other factors
Although technical analysts rely on price as their primary analysis tool, certain biases may influence how they perceive the information they gather from charts. For example, if you have a bullish bias in EURUSD, you will subconsciously look for and test buying opportunities while ignoring signals that EURUSD is weakening. Therefore, it is extremely important to try to analyze charts with a truly open mind.
Interpretations may vary
As I've written before, technical analysis is more of an art than a science. Two technicians can look at the same price chart, and sometimes they can offer two opposing interpretations. This is not that uncommon, and one of the culprits is our internal biases. Additionally, chart patterns that appear clear in hindsight can be quite subjective in real time.
Forecasts and opinions of analysts
They are needed as a kind of method of expert assessments, i.e. The more different expert opinions you read, the more perspective you will take on the situation in the company
- FINAM - reviews and forecasts of the leading broker of the Russian Federation
- Otkritie - investment ideas and market reviews from Otkritie Bank
- Smart-lab - stock forum for the trading community
- Investing - stock market analytics of the largest portal
Financial stability assessment
To assess financial stability and solvency, liquidity ratios are used: current ratio, quick ratio, absolute liquidity (cash ratio). Their main difference is that the current liquidity ratio assesses the long-term solvency of the company, quick liquidity – medium-term, and absolute liquidity – short-term.
Current ratio - shows how a company can pay off its liabilities using all its assets.
Quick ratio - reflects how a company can pay off its debts with the fastest-selling assets. Quickly realizable assets include: cash, securities, accounts receivable.
Absolute liquidity ratio - shows the company’s ability to pay off its obligations using the most liquid assets (cash).
The standard value of liquidity assessment is as follows ↓
| Meaning | What does it show |
| Current ratio | |
| Current ratio > 3 | High degree of solvency Possibly ineffective asset management |
| 1.5 < Current ratio < 3 | Moderate solvency |
| Current ratio < 1.5 | Low solvency |
| Quick ratio | |
| Quick ratio > 1 | High solvency in the medium term |
| Quick ratio < 1 | Not all obligations can be covered in the medium term. Possible loss of financial reliability |
| Absolute liquidity ratio | |
| Cash ratio > 0.5 | High solvency, there may be a risk of ineffective capital management |
| 0.2 < Cash ratio < 0.5 | Optimal level |
| Cash ratio < 0.2 | Low solvency of the enterprise |
The higher the liquidity values, the more resources the company has to pay off its obligations in the medium and long term. At the same time, the company’s inventory, financial investments and other assets can reduce the company’s profitability (ROA↓). After all, these assets do not participate in the creation of profit in any way.
The conclusion for the quick liquidity indicator is as follows: “The company must have at least 20% of cash to pay off emergency obligations and force majeure situations.”
Institutional Investor Share Ratio (Inst Own)
The share of institutional investors reflects what percentage of shares are owned by funds, insurance companies, banks and other large private investors. The table below discusses the standard values recommended by P. Lynch ↓
| Coefficient value | Grade |
| Inst Own < 5% | Not an investment-attractive company |
| 5% < Inst Own <65% | The company can be considered for investment |
| Inst Own > 65% | Highly volatile stock |
Assessment of financial stability. J. Piotroski method (F-score)
When investing in a particular company, we need to assess its financial stability. This will allow you to assess the risk of bankruptcy. This can be done using J. Piotroski’s model, which evaluates the financial health of the company according to 9 parameters and 1 point is awarded for each of them. If this criterion is met, it is awarded 1 point, if not 0 points. The model considers such coefficients as:
| Description of the indicator | Formula |
| Return on assets in the current year (1) | ROA1 > 0 |
| Positive cash flow (OCF) in the current year (1) | OCF1 > 0 |
| Profitability growth over the past year. Increase in profitability of the current year (1) over the profitability of the previous year (2) | ROA1 > ROA2 |
| Cash return on assets is greater than return on assets | CFROA > ROA |
| Reducing debt burden. Decrease in the long-term debt ratio in the current year (1) compared to the previous year (2) | K1 < K2 |
| Increased solvency. Growth of the current liquidity ratio in the current year (1) in relation to the previous year (2) | Current raito1 > Current ratio2 |
| No capital dilution, i.e. issuing new shares. | New shares = 0 |
| Turnover growth in the current year (1) compared to the previous year (2) | Asset Turnover1 > Asset Turnover2 |
Normative M-score
- Piotroski (F-Score) 8–9. Financial condition is stable.
- Piotroski (F-Score) 0–2. Financial condition is weak.
In order for a company to be financially healthy, a positive answer must be given to almost all of the selected criteria. If a company meets only two of the nine conditions, its risk of bankruptcy is high and should be excluded from consideration. You can view the calculation of the indicator in the GuruFocus and Chartmill services.
Assessment of reporting manipulations. Bishipe method (M-score)
All key fundamental analysis ratios are based on financial reporting data. But if these data are adjusted and their final values have been manipulated, then there is no need to talk about the accuracy of the assessment. Therefore, for the objectivity of the assessment, it is necessary to check the reporting for accuracy and the absence of unfair manipulation of the results.
One of the methods that allows this to be done is the approach of M. Bechiche (M-score), which is based on the calculation of eight indices, the weighted sum of which is used to construct a classifying assessment. These indices included various relative changes: accounts receivable daily sales index, gross profit return on sales index, asset quality index, revenue growth index, depreciation index, selling and administrative expenses index, financial independence ratio index, accruals to assets.
Standard value of the coefficient according to the model ↓
| Meaning | Grade |
| M-score < -2.22 | indicates the absence of reporting manipulations. |
| M-score > -2.22 | there may be manipulations in reporting. |
Dividends and dates
Dividend dates are needed to determine the cutoff at which investors owning shares of the company will receive dividends for the declared period
- BKS - dividend calendar of companies traded on the stock exchange
- Smart-lab - upcoming cut-off dates (closing of shareholder registers)
- Opening - the calendar can be filtered by profitability, dates, list
- Income - filter by company dividends
Estimation of earnings per share dynamics
EPS (English: Earning Per Share) is a coefficient showing the ratio of net profit to the number of issued shares. The higher the value of the indicator, the higher the return on investment in shares and the greater their investment attractiveness. For an objective assessment, comparisons of companies must be carried out for the same industry and with the same capital structure. After all, a company that uses borrowed funds will have a greater return on capital and net profit than one that creates profit only with its own funds. But the level of financial risk will vary.
American companies are very sensitive to their financial results and their changes. Thus, the appearance of information about the growth of EPS for Apple (APPL) led to an increase in prices on the stock market. The table below shows this relationship. Thus, the publication on April 30 of information about an increase in EPS by 0.29 (in absolute value) and revenue by $3.6 billion led to a positive change in the share price the next day.
| date | Price the day before the report | Next day price | EPS growth | Revenue growth in billions. $ | Share price change |
| April 30, 2020 | 287.73 | 289.07 | +0.29 | +3.6 | Growth 0.47% |
| January 28, 2020 | 308.95 | 324.34 | +0.45 | +3.414 | Growth 4.48% |
| October 30, 2019 | 243.29 | 248.76 | +0.19 | +-0.9 | Growth 2.25% |
| July 30, 2019 | 209.68 | 213.04 | +0.08 | +0.36 | Growth 1.6% |
| April 30, 2019 | 204.61 | 210.52 | 0.1 | +0.61 | Growth 2.89% |