Securities data
| Ticker | MCX: IRGZ |
| Trading platforms and trading times | Moscow Exchange: 10:00 – 18:40 Moscow time |
| Name | Irkutsk Public Joint Stock Company of Energy and Electrification |
| Number of securities in circulation | 4,766,807,700 pcs. ordinary shares |
| Denomination | 1 ruble |
| Dividends | No |
| Year of foundation | 1992 |
| Founded by | Based on Decree of the President of the Russian Federation dated July 1, 1992 No. 721 |
| Headquarters | Russia, Irkutsk |
Dynamics of Irkutskenergo shares
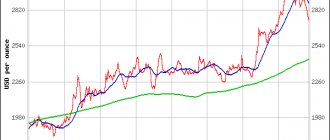
Custom searchDynamics of the value of Irkutskenergo shares (ticket IRGZ) in rubles for the period 02/03/1998-12/18/2017, 02/03/1998 = 1.00.
| IRGZ | ||
| Sharpe Ratio: | +0.640 | 28th place |
| Total Return: | 23.750 | (2275.0% all time) |
| Average annual income: | 1.175 | (17.5% per annum) |
| Total return, bottom estimate: | 1.350 | (35.0% all time) |
| Total return, bottom estimate, competition effect: | 0.371 | (-62.9% all time) |
| Observation period: | About 20 years | |
| Date of first observation: | 03.02.1998 | |
| Date of last observation: | 18.12.2017 | |
| Capitalization: | 81512 million rubles. | 47th place |
Dynamics of the share price of Irkutskenergo (IRGZ), expressed in foreign currency, 02/03/1998 = 1.00
Dynamics of the price of shares of Irkutskenergo (IRGZ) in relation to the MICEX index, 02/03/1998 = 1.00
Share price of Irkutskenergo (IRGZ), rubles per share.
Price gaps of more than 10% (gaps):
| Date "before" | date | Price "before" | New price | Price gap size | Index "before" | MICEX index as of date | Index change % |
| 05.02.1998 | 06.02.1998 | 0.700 | 0.840 | 20.0% | 67.48 | 70.4 | 4.3 |
| 13.02.1998 | 16.02.1998 | 0.800 | 0.720 | 11.1% | 69.6 | 70.32 | 1.0 |
| 16.02.1998 | 17.02.1998 | 0.720 | 0.860 | 19.4% | 70.32 | 72.09 | 2.5 |
| 02.03.1998 | 03.03.1998 | 0.900 | 1.030 | 14.4% | 75.16 | 76.6 | 1.9 |
| 10.03.1998 | 11.03.1998 | 1.130 | 1.320 | 16.8% | 79.8 | 82.91 | 3.9 |
| 20.03.1998 | 23.03.1998 | 1.190 | 1.030 | 15.5% | 78.75 | 77.42 | 1.7 |
| 23.03.1998 | 24.03.1998 | 1.030 | 1.150 | 11.7% | 77.42 | 80.39 | 3.8 |
| 18.05.1998 | 19.05.1998 | 1.080 | 0.920 | 17.4% | 57.35 | 57.03 | 0.6 |
| 25.05.1998 | 26.05.1998 | 0.950 | 0.720 | 31.9% | 51.24 | 48.4 | 5.9 |
| 26.05.1998 | 27.05.1998 | 0.720 | 0.810 | 12.5% | 48.4 | 43.8 | 10.5 |
| 29.05.1998 | 01.06.1998 | 0.830 | 0.750 | 10.7% | 46.01 | 40.95 | 12.4 |
| 01.06.1998 | 02.06.1998 | 0.750 | 0.630 | 19.0% | 40.95 | 42.97 | 4.9 |
| 02.06.1998 | 03.06.1998 | 0.630 | 0.840 | 33.3% | 42.97 | 50.58 | 17.7 |
| 09.06.1998 | 10.06.1998 | 0.850 | 0.740 | 14.9% | 47.2 | 43.25 | 9.1 |
| 15.06.1998 | 16.06.1998 | 0.700 | 0.620 | 12.9% | 38.54 | 38.6 | 0.2 |
| 16.06.1998 | 17.06.1998 | 0.620 | 0.700 | 12.9% | 38.6 | 41.35 | 7.1 |
| 18.06.1998 | 19.06.1998 | 0.770 | 0.670 | 14.9% | 44.86 | 40.93 | 9.6 |
| 01.07.1998 | 02.07.1998 | 0.620 | 0.540 | 14.8% | 35.82 | 33.88 | 5.7 |
| 13.07.1998 | 14.07.1998 | 0.600 | 0.700 | 16.7% | 37.55 | 44.88 | 19.5 |
| 31.07.1998 | 03.08.1998 | 0.640 | 0.570 | 12.3% | 37.46 | 35.14 | 6.6 |
| 07.08.1998 | 10.08.1998 | 0.540 | 0.480 | 12.5% | 30.33 | 28.66 | 5.8 |
| 10.08.1998 | 11.08.1998 | 0.480 | 0.400 | 20.0% | 28.66 | 23.7 | 20.9 |
| 12.08.1998 | 13.08.1998 | 0.400 | 0.360 | 11.1% | 24.8 | 20.89 | 18.7 |
| 13.08.1998 | 14.08.1998 | 0.360 | 0.400 | 11.1% | 20.89 | 24.34 | 16.5 |
| 17.08.1998 | 18.08.1998 | 0.390 | 0.250 | 56.0% | 25.47 | 24.2 | 5.2 |
| 21.08.1998 | 24.08.1998 | 0.260 | 0.300 | 15.4% | 19.36 | 21.32 | 10.1 |
| 25.08.1998 | 26.08.1998 | 0.313 | 0.245 | 27.8% | 22.58 | 23.63 | 4.7 |
| 26.08.1998 | 27.08.1998 | 0.245 | 0.300 | 22.4% | 23.63 | 23.43 | 0.9 |
| 01.09.1998 | 03.09.1998 | 0.290 | 0.354 | 22.1% | 21.02 | 26.49 | 26.0 |
| 04.09.1998 | 08.09.1998 | 0.370 | 0.430 | 16.2% | 30.96 | 34.03 | 9.9 |
| 08.09.1998 | 09.09.1998 | 0.430 | 0.300 | 43.3% | 34.03 | 30.05 | 13.2 |
| 11.09.1998 | 14.09.1998 | 0.320 | 0.355 | 10.9% | 27.38 | 24.56 | 11.5 |
| 14.09.1998 | 15.09.1998 | 0.355 | 0.320 | 10.9% | 24.56 | 25.84 | 5.2 |
| 01.10.1998 | 05.10.1998 | 0.310 | 0.220 | 40.9% | 23.39 | 18.53 | 26.2 |
| 07.10.1998 | 08.10.1998 | 0.200 | 0.240 | 20.0% | 20.78 | 20.19 | 2.9 |
| 12.10.1998 | 13.10.1998 | 0.221 | 0.257 | 16.3% | 21.88 | 23.46 | 7.2 |
| 13.10.1998 | 20.10.1998 | 0.257 | 0.410 | 59.5% | 23.46 | 30.72 | 30.9 |
| 20.10.1998 | 22.10.1998 | 0.410 | 0.570 | 39.0% | 30.72 | 33.91 | 10.4 |
| 22.10.1998 | 23.10.1998 | 0.570 | 0.480 | 18.8% | 33.91 | 31.59 | 7.3 |
| 12.11.1998 | 13.11.1998 | 0.620 | 0.739 | 19.2% | 37.31 | 38.4 | 2.9 |
| 16.11.1998 | 17.11.1998 | 0.770 | 0.855 | 11.0% | 40.05 | 41.75 | 4.2 |
| 20.11.1998 | 23.11.1998 | 0.770 | 0.900 | 16.9% | 42.11 | 46.86 | 11.3 |
| 23.11.1998 | 24.11.1998 | 0.900 | 1.000 | 11.1% | 46.86 | 51.7 | 10.3 |
| 24.11.1998 | 25.11.1998 | 1.000 | 0.890 | 12.4% | 51.7 | 47.11 | 9.7 |
| 13.01.1999 | 14.01.1999 | 0.935 | 0.830 | 12.7% | 44.84 | 43.42 | 3.3 |
| 23.02.1999 | 24.02.1999 | 1.230 | 1.110 | 10.8% | 68.8 | 68.39 | 0.6 |
| 25.02.1999 | 26.02.1999 | 1.200 | 1.011 | 18.7% | 68.27 | 62.44 | 9.3 |
| 01.03.1999 | 02.03.1999 | 1.065 | 1.185 | 11.3% | 66.66 | 70.28 | 5.4 |
| 16.04.1999 | 19.04.1999 | 1.150 | 1.302 | 13.2% | 88.79 | 92.5 | 4.2 |
| 11.06.1999 | 15.06.1999 | 1.970 | 2.200 | 11.7% | 119.3 | 119.3 | 0.0 |
| 16.06.1999 | 17.06.1999 | 2.223 | 2.650 | 19.2% | 122.19 | 123.68 | 1.2 |
| 18.06.1999 | 21.06.1999 | 2.450 | 2.800 | 14.3% | 123.68 | 123.68 | 0.0 |
| 08.07.1999 | 09.07.1999 | 2.890 | 2.600 | 11.2% | 148.69 | 149.93 | 0.8 |
| 06.08.1999 | 09.08.1999 | 2.000 | 1.500 | 33.3% | 100.03 | 106.32 | 6.3 |
| 09.08.1999 | 10.08.1999 | 1.500 | 2.099 | 39.9% | 106.32 | 98.87 | 7.5 |
| 11.08.1999 | 12.08.1999 | 1.910 | 2.150 | 12.6% | 110.32 | 106.49 | 3.6 |
| 15.09.1999 | 16.09.1999 | 2.200 | 1.801 | 22.2% | 104.99 | 101.58 | 3.4 |
| 20.09.1999 | 22.09.1999 | 1.830 | 1.501 | 21.9% | 93.57 | 83.53 | 12.0 |
| 22.09.1999 | 27.09.1999 | 1.501 | 1.705 | 13.6% | 83.53 | 87.6 | 4.9 |
| 01.10.1999 | 05.10.1999 | 1.705 | 1.930 | 13.2% | 87.13 | 90.79 | 4.2 |
| 12.10.1999 | 13.10.1999 | 2.170 | 1.740 | 24.7% | 98.33 | 100.55 | 2.3 |
| 13.10.1999 | 14.10.1999 | 1.740 | 2.060 | 18.4% | 100.55 | 96.88 | 3.8 |
| 05.01.2000 | 06.01.2000 | 2.350 | 2.600 | 10.6% | 151.87 | 173 | 13.9 |
| 11.01.2000 | 12.01.2000 | 2.959 | 2.650 | 11.7% | 200.81 | 199.57 | 0.6 |
| 13.01.2000 | 14.01.2000 | 2.850 | 3.200 | 12.3% | 196.88 | 210.05 | 6.7 |
| 07.03.2000 | 09.03.2000 | 2.202 | 2.690 | 22.2% | 210.98 | 211.95 | 0.5 |
| 17.05.2000 | 18.05.2000 | 2.500 | 2.200 | 13.6% | 239.9 | 235.77 | 1.8 |
| 23.05.2000 | 24.05.2000 | 2.040 | 1.692 | 20.6% | 210.69 | 201.9 | 4.4 |
| 20.06.2000 | 21.06.2000 | 2.200 | 1.981 | 11.1% | 218.95 | 215.06 | 1.8 |
| 06.07.2000 | 07.07.2000 | 2.090 | 2.350 | 12.4% | 188.68 | 188.37 | 0.2 |
| 07.07.2000 | 10.07.2000 | 2.350 | 2.600 | 10.6% | 188.37 | 199.23 | 5.8 |
| 07.09.2000 | 08.09.2000 | 2.700 | 3.050 | 13.0% | 241.43 | 238.66 | 1.2 |
| 06.10.2000 | 07.10.2000 | 2.970 | 3.536 | 19.1% | 206.02 | 162.48 | 26.8 |
| 07.10.2000 | 09.10.2000 | 3.536 | 2.920 | 21.1% | 162.48 | 201.5 | 24.0 |
| 20.12.2000 | 21.12.2000 | 2.500 | 1.900 | 31.6% | 139.13 | 135.21 | 2.9 |
| 21.12.2000 | 22.12.2000 | 1.900 | 2.200 | 15.8% | 135.21 | 130.96 | 3.2 |
| 28.12.2000 | 03.01.2001 | 2.200 | 1.900 | 15.8% | 142.16 | 144.39 | 1.6 |
| 09.01.2001 | 10.01.2001 | 1.960 | 2.199 | 12.2% | 148.96 | 150.89 | 1.3 |
| 10.01.2001 | 11.01.2001 | 2.199 | 2.610 | 18.7% | 150.89 | 159.29 | 5.6 |
| 11.01.2001 | 12.01.2001 | 2.610 | 2.240 | 16.5% | 159.29 | 160.03 | 0.5 |
| 23.01.2001 | 24.01.2001 | 2.125 | 2.350 | 10.6% | 166.03 | 168.59 | 1.5 |
| 20.02.2001 | 21.02.2001 | 2.319 | 2.063 | 12.4% | 173.96 | 168.02 | 3.5 |
| 27.02.2001 | 28.02.2001 | 2.233 | 2.020 | 10.5% | 162.48 | 161.41 | 0.7 |
| 28.02.2001 | 01.03.2001 | 2.020 | 2.350 | 16.3% | 161.41 | 158.1 | 2.1 |
| 14.03.2001 | 15.03.2001 | 2.228 | 2.000 | 11.4% | 166.71 | 164.43 | 1.4 |
| 14.05.2001 | 15.05.2001 | 2.239 | 2.021 | 10.8% | 190.19 | 187.72 | 1.3 |
| 15.05.2001 | 16.05.2001 | 2.021 | 2.299 | 13.8% | 187.72 | 188.7 | 0.5 |
| 11.09.2001 | 12.09.2001 | 2.550 | 2.150 | 18.6% | 195.25 | 195.58 | 0.2 |
| 03.01.2002 | 09.01.2002 | 2.420 | 2.750 | 13.6% | 237.63 | 268.01 | 12.8 |
| 10.07.2002 | 11.07.2002 | 1.968 | 2.200 | 11.8% | 319.95 | 324.24 | 1.3 |
| 06.08.2002 | 07.08.2002 | 1.958 | 2.380 | 21.6% | 272.21 | 269.55 | 1.0 |
| 07.08.2002 | 08.08.2002 | 2.380 | 2.035 | 17.0% | 269.55 | 280.95 | 4.2 |
| 14.01.2003 | 15.01.2003 | 2.540 | 2.874 | 13.1% | 321.27 | 320.27 | 0.3 |
| 16.07.2003 | 17.07.2003 | 2.925 | 2.335 | 25.3% | 438.55 | 410.24 | 6.9 |
| 17.07.2003 | 18.07.2003 | 2.335 | 2.750 | 17.8% | 410.24 | 391.93 | 4.7 |
| 27.02.2004 | 01.03.2004 | 4.019 | 4.540 | 13.0% | 582.38 | 591.09 | 1.5 |
| 05.03.2004 | 09.03.2004 | 4.760 | 5.450 | 14.5% | 592.34 | 598.18 | 1.0 |
| 28.07.2004 | 29.07.2004 | 4.300 | 3.850 | 11.7% | 501.79 | 467.72 | 7.3 |
| 07.09.2005 | 08.09.2005 | 7.201 | 8.450 | 17.3% | 772.14 | 758.01 | 1.9 |
| 12.09.2005 | 13.09.2005 | 9.006 | 10.965 | 21.8% | 794.93 | 792.24 | 0.3 |
| 26.01.2006 | 27.01.2006 | 12.968 | 14.468 | 11.6% | 1179.05 | 1187.19 | 0.7 |
| 22.05.2006 | 23.05.2006 | 15.300 | 13.500 | 13.3% | 1265.85 | 1143.77 | 10.7 |
| 29.08.2008 | 02.09.2008 | 15.133 | 17.950 | 18.6% | 1365.11 | 1366.24 | 0.1 |
| 16.09.2008 | 17.09.2008 | 15.251 | 13.201 | 15.5% | 1067.45 | 881.32 | 21.1 |
| 17.09.2008 | 19.09.2008 | 13.201 | 11.500 | 14.8% | 881.32 | 853.95 | 3.2 |
| 19.09.2008 | 22.09.2008 | 11.500 | 15.000 | 30.4% | 853.95 | 1098.95 | 28.7 |
| 06.10.2008 | 07.10.2008 | 12.993 | 10.500 | 23.7% | 924.52 | 752 | 22.9 |
| 13.10.2008 | 14.10.2008 | 9.699 | 8.695 | 11.5% | 700.37 | 666.81 | 5.0 |
| 24.10.2008 | 28.10.2008 | 8.990 | 7.401 | 21.5% | 598.87 | 513.63 | 16.6 |
| 28.10.2008 | 29.10.2008 | 7.401 | 9.399 | 27.0% | 513.63 | 534.87 | 4.1 |
| 29.10.2008 | 30.10.2008 | 9.399 | 8.418 | 11.7% | 534.87 | 608.9 | 13.8 |
| 31.10.2008 | 01.11.2008 | 8.831 | 10.001 | 13.2% | 727.38 | 731.97 | 0.6 |
| 05.11.2008 | 06.11.2008 | 9.992 | 8.900 | 12.3% | 769.34 | 775.18 | 0.8 |
| 14.11.2008 | 17.11.2008 | 9.150 | 8.123 | 12.6% | 598.44 | 592.07 | 1.1 |
| 17.11.2008 | 18.11.2008 | 8.123 | 9.700 | 19.4% | 592.07 | 560.79 | 5.6 |
| 20.11.2008 | 21.11.2008 | 9.370 | 8.122 | 15.4% | 558.12 | 533.7 | 4.6 |
| 27.11.2008 | 28.11.2008 | 8.100 | 9.895 | 22.2% | 588.33 | 616.69 | 4.8 |
| 19.01.2009 | 20.01.2009 | 7.100 | 6.213 | 14.3% | 608.64 | 586.97 | 3.7 |
| 17.04.2009 | 20.04.2009 | 6.917 | 7.750 | 12.0% | 917.1 | 932.9 | 1.7 |
| 20.04.2009 | 21.04.2009 | 7.750 | 6.600 | 17.4% | 932.9 | 882.15 | 5.8 |
| 06.05.2009 | 07.05.2009 | 7.190 | 8.020 | 11.5% | 957.04 | 986.12 | 3.0 |
| 25.05.2009 | 26.05.2009 | 7.790 | 9.055 | 16.2% | 1054.14 | 1050.95 | 0.3 |
| 13.07.2009 | 14.07.2009 | 9.000 | 9.980 | 10.9% | 871.31 | 881.23 | 1.1 |
| 18.08.2009 | 19.08.2009 | 10.089 | 12.350 | 22.4% | 1035.41 | 1035.5 | 0.0 |
| 09.12.2009 | 10.12.2009 | 12.101 | 10.875 | 11.3% | 1310.96 | 1302.36 | 0.7 |
| 10.12.2009 | 11.12.2009 | 10.875 | 12.153 | 11.8% | 1302.36 | 1304.61 | 0.2 |
| 23.05.2011 | 24.05.2011 | 19.500 | 22.199 | 13.8% | 1603.97 | 1573.39 | 1.9 |
| 19.08.2011 | 22.08.2011 | 20.207 | 22.389 | 10.8% | 1452.82 | 1437.9 | 1.0 |
| 18.05.2012 | 21.05.2012 | 15.202 | 16.977 | 11.7% | 1287.79 | 1271.28 | 1.3 |
| 04.06.2012 | 05.06.2012 | 13.550 | 14.996 | 10.7% | 1298.08 | 1305.86 | 0.6 |
| 30.01.2013 | 31.01.2013 | 16.300 | 18.100 | 11.0% | 1549.75 | 1543.43 | 0.4 |
| 31.01.2013 | 01.02.2013 | 18.100 | 15.891 | 13.9% | 1543.43 | 1546.52 | 0.2 |
| 07.10.2013 | 08.10.2013 | 8.249 | 9.150 | 10.9% | 1474.45 | 1480.2 | 0.4 |
| 03.03.2014 | 04.03.2014 | 7.001 | 5.573 | 25.6% | 1438.02 | 1288.78 | 11.6 |
| 04.03.2014 | 05.03.2014 | 5.573 | 6.689 | 20.0% | 1288.78 | 1356.27 | 5.2 |
| 18.03.2014 | 19.03.2014 | 5.650 | 6.299 | 11.5% | 1285.53 | 1335.84 | 3.9 |
| 27.04.2015 | 28.04.2015 | 6.940 | 10.520 | 51.6% | 1682.82 | 1676.32 | 0.4 |
| 01.06.2015 | 02.06.2015 | 9.200 | 7.910 | 16.3% | 1657.67 | 1616.97 | 2.5 |
| 22.10.2015 | 23.10.2015 | 7.380 | 8.750 | 18.6% | 1709.93 | 1713.65 | 0.2 |
| 23.03.2016 | 24.03.2016 | 10.850 | 13.200 | 21.7% | 1900.09 | 1872.88 | 1.5 |
| 31.03.2016 | 01.04.2016 | 13.290 | 15.110 | 13.7% | 1865.1 | 1860.53 | 0.2 |
| 11.05.2016 | 12.05.2016 | 17.190 | 19.010 | 10.6% | 1890.09 | 1912.43 | 1.2 |
| 13.05.2016 | 16.05.2016 | 19.380 | 21.570 | 11.3% | 1901.51 | 1912.16 | 0.6 |
| 06.09.2016 | 07.09.2016 | 15.050 | 16.760 | 11.4% | 2020.77 | 2042.21 | 1.1 |
List of volatile trading days, hi/lo > 1.3:
| date | hi/lo | open | hi | low | close |
| 18.05.1998 | 1.30 | 1.080 | 1.080 | 0.830 | 1.130 |
| 17.08.1998 | 1.52 | 0.390 | 0.440 | 0.290 | 0.400 |
| 18.08.1998 | 1.36 | 0.250 | 0.340 | 0.250 | 0.300 |
| 05.10.1998 | 1.78 | 0.220 | 0.320 | 0.180 | 0.300 |
| 06.10.1998 | 1.40 | 0.210 | 0.280 | 0.200 | 0.180 |
| 29.03.1999 | 1.34 | 1.345 | 1.727 | 1.285 | 1.310 |
| 06.03.2001 | 1.35 | 2.339 | 3.040 | 2.260 | 2.211 |
| 23.08.2002 | 1.37 | 2.020 | 2.049 | 1.500 | 2.057 |
| 17.09.2008 | 1.31 | 13.201 | 14.440 | 10.999 | 12.899 |
| 19.09.2008 | 1.30 | 11.500 | 15.000 | 11.500 | 14.320 |
| 09.10.2008 | 1.38 | 9.654 | 11.999 | 8.701 | 10.009 |
| 13.10.2008 | 1.40 | 9.699 | 10.800 | 7.700 | 9.603 |
| 16.10.2008 | 1.35 | 9.106 | 10.499 | 7.771 | 9.005 |
| 01.11.2008 | 1.36 | 10.001 | 10.500 | 7.701 | 10.000 |
| 16.04.2009 | 1.36 | 7.400 | 8.200 | 6.040 | 7.089 |
| 06.08.2009 | 1.57 | 10.160 | 10.949 | 6.970 | 9.910 |
| 20.12.2013 | 1.58 | 7.910 | 7.911 | 5.015 | 8.000 |
| 27.04.2015 | 1.39 | 6.940 | 9.620 | 6.900 | 6.890 |
| 07.04.2016 | 1.35 | 15.470 | 15.500 | 11.490 | 15.280 |
Capitalization chart of Irkutskenergo (IRGZ), million euros, million dollars.
- MICEX stock rating, Sharpe ratio
- MICEX stock rating, total income, bottom estimate taking into account the competition effect
- MICEX stock rating, total income, bottom estimate
- MICEX stock rating, total income
What affects the stock price
The primary influence on the price of Irkutskenergo securities today is exerted by:
- Production and financial results of the group.
- Tariff regulation by the state.
- Cost of raw materials used to generate energy (coal, gas).
Company prospects
The business is stable; no major changes or breakthroughs should be expected. The company's management today talks a lot about cost control, which may have a moderately positive impact in the future.
Analytics and forecast for the security
The multiples for the issuer's shares are today in line with industry averages. 2021 was a difficult year for the company, which was reflected in a decline in key performance indicators. There are practically no prospects for a return to dividend payments on the visible horizon.