Trading strategies using the channel indicator belong to the classical methods of technical analysis, are easy to implement, and therefore accessible even to beginners. Price ranges work equally well on any trading assets and timeframes; they can be used either independently or with additional confirmation from oscillators and market volumes.
If the Forex channel is constructed correctly, then it already provides basic information about the current trend line: the direction and strength of the current movement. Lines drawn through price highs/lows show volatility as support/resistance and confirm price action chart patterns. Most strategies are based on analysis of price behavior near the borders (the strongest signals) and the middle line (weaker) from which the Take Profit and Stop Loss levels are calculated. According to the calculation method, indicators are divided into dynamic, moving and hard.
What are Forex channel indicators used for?
Despite the fact that each asset (currency pair, stock index, stock, commodity) behaves differently, there are general patterns that are common to all charts. For example, prices can move along a trend or in a narrow range (flat). And even if the chart goes up or down (a clearly expressed trend), it still moves in a certain channel (corridor, range).
This pattern can be seen at different intervals - from minutes to months. It is important to understand that inside the corridor the price can go either along the trend or in the opposite direction (rollback or correction). Therefore, positions can be opened in different directions (subject to risk management rules).
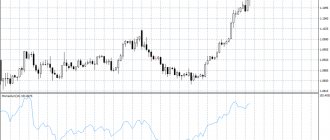
At the same time, the picture will be different on different frames. For example, on the daily interval D1 a channel has formed, within which the price moves. It reached the upper limit and then went down. At this point, different trends may be reflected on smaller time frames.
For example, H4 will also show a downward direction, and H1 will show a correction in the opposite direction. However, if a trader determines the channel on the senior interval D1, he will accurately enter the SELL position and make a profit in the form of tens or, less often, hundreds of points.
We also recommend reading about what timeframes are in Forex and how to choose them correctly for your strategy.
Let's sum it up
Channel trading is considered a fairly good and profitable trading tactic. The advantage of trading in a channel range is that the trader has a visual advantage in determining the boundaries of the channel, as a result the speculator more accurately understands where to set the stop loss.
In general, trend trading is considered safer, but experience tells me that trend trading is not suitable for everyone; in the initial stages, a novice speculator needs to understand what type of trading suits him best. The most obvious sign of choosing your strategy is its complete understanding, namely logic; any good trading system should be built on logic. But as you probably already understand, the logic can be completely different, and different tactics and systems arise from different logics.
Many great traders have said and continue to say that 70% of success depends on psychology, I am not a great speculator, moreover, having worked in the market for a total of just over five years, I consider myself still a beginner and constantly learning new methods during these five years I realized that I was able to decipher the expression “70% of success depends on psychology”, 20% depends on understanding the logic of the movement of currency pairs and applying the right strategy to them, 30% depends on the trading philosophy and 20% on the belief that your the system will produce profit in the long term. The remaining 30% is proper money management, risk management and a little luck.
How to build Forex channels
Initially, it is better to learn how to identify channels yourself, as this will allow you to gain the necessary skill. To quickly master it, you can use both special and indicators. For example, first a trader builds a corridor on his own, and then checks his version using a technical tool.
Manually
Building channels yourself is quite simple. To do this you need:
- Open a chart on any timeframe.
- Determine the trend, find the high points (highs) and low points (lows).
- Draw horizontal lines along these points using the “line” tool (located on the top menu bar of the MT4 or MT5 terminal).
Building Forex channels using indicators
In most cases, perfect accuracy cannot be achieved, which is quite normal. In addition, the channel will change over time - towards narrowing or, conversely, expansion. Another important point: a manually built corridor will only be horizontal. Whereas in reality it does not always go parallel to the window - channels can move up and down, following the trend.
To take into account all these nuances, it is easier to use special channel indicators. Some of them (for example, Bollinger Bands) have already been added to the MT4 terminal. But most of the tools must be downloaded separately and installed into the program. To do this, the files are copied and placed in the “Indicators” folder. To find it, go to the “File” menu, in the “Open directory” subsection. There you should see “MQL4”, in which the required folder is located.
After this, you need to close the program and enter it again. To plot a corridor on a chart, go to the “Insert” menu and then go to the “Indicators” section and the “Custom” subsection. There you can select any algorithm previously added to the program.
Graphically, channels can be displayed in different ways - most often they are straight or arbitrary lines (2 or 3) of different colors.
For reference. To see or change settings, you need to right-click on any point in the channel. In the new window, select the “Properties” line. After this, a list of settings will open, which you can change at your own discretion. It is recommended to do this only after testing the indicator with basic options (without changes).
Best channel indicators
There are quite a lot of channel indicators. The signals from them are quite clear:
- when the price reaches the upper limit, you can enter SELL;
- When the price reaches the lower limit, you can enter BUY.
In some cases, algorithms also provide additional signals – for example, when the graph crosses the center line. The most popular tools that determine the price corridor are discussed below.
Price Channel
This is the simplest algorithm that simply connects the maximum and minimum points on the chart. It also shows the average price value as a line running approximately in the middle of the corridor. The result is the following picture.
The tool is installed separately in the terminal (you need to download the files and add them to the program, as described above). In the settings, you can change the number of bars that are taken into account when analyzing the situation: the more there are, the wider the range.
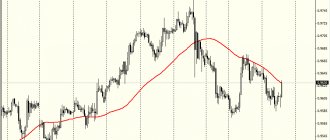
Equidistant Forex channel Bollinger Bands
One of the most common algorithms, available in all versions of the MetaTrader terminal. Determines the upper and lower boundaries of the corridor, as well as the speed of price movement. The lines follow the price and are constantly changing, which is why they are called dynamic support (lower border) and resistance (upper) levels.
Inside the channel itself, there is a third central line, which gives additional signals:
- the graph crosses it from bottom to top - the price is expected to rise;
- the graph crosses it from top to bottom - the price is expected to fall.
It is noteworthy that it goes exactly in the center, i.e. both corridor boundaries are equidistant from the center line. This distance can be changed arbitrarily by going to the settings and seeing the standard deviation indicator (“Standard Deviation”). The larger this option is, the wider the range, and vice versa.
Based on Bollinger Bands and the Macd histogram, an effective trend algorithm was created - the Power Fuse indicator.
Channel Keltner
Bollinger Bands are sometimes used in conjunction with the Keltner channel. This is a similar algorithm that follows Bollinger Bands. Moreover, it also has 3 lines (the central one is indicated by a dotted line). The signals from this instrument are exactly the same.
In the settings of this algorithm, special attention should be paid to the following:
- MA Period – the number of candles, the data for which is used to build the channel.
- Mode MA – type of line (moving average located in the middle).
- Price Type – the type of prices that are used in calculations (for example, by opening or closing a candle).
Donchian Channel
The Donchian Channel allows you to determine both the trend and the strength of its development: the wider the corridor, the faster the price moves up or down. The indicator consists of 2 lines that connect the highs and lows. It can be used on any asset.
For reference. The settings specify the number of candles along which the indicator draws lines. Experienced traders and the developer of the algorithm himself, Richard Donchian, recommend using parameter 20.
Lin-Regression Breakout
The algorithm plots a price corridor on the chart and also gives clear signals for entry:
- down arrow – price drop – SELL order;
- up arrow – price increase – BUY order.
Along with this, the indicator shows marks for setting stop loss and take profit. They can be used as additional tips, since the trader must make the final decision independently.
Center of Gravity
Unlike most other tools, this algorithm plots 5 lines on the chart at once, running parallel to each other, following the established trend. You can trade from both the last and penultimate levels, although the first option is more effective.
By the direction of these lines you can determine which direction the price will go. The figure below shows how the chart moves relative to these levels, periodically breaking through them.
MAChannel_Close
The instrument is used for trading along the trend and during flat periods (in combination with oscillators). It consists of solid and dotted lines of 2 different colors, serving as the boundaries of the trading range. Transactions are opened when the price reaches these lines.
Important. If the line is solid, this means that there is a support (red) or resistance (blue) level in the market. If the line is dotted, support or resistance has been broken. In the first case, you can open a deal for a long term, in the second, only for a short term.
Barishpolts Channel
Another channel indicator with parallel lines - upper, lower and middle. Allows you to enter with and against the trend, as well as monitor trend changes (a reversal is observed when the channel boundaries are broken and a new one is formed).
It can be used as a full-fledged trading tool, as well as in combination with other channel algorithms - for example, with the Keltner channel and ADX to filter out false signals.
Strategy with two Price Channel tools
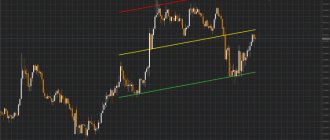
It is not uncommon for professional traders to use the same indicator twice, simply increasing the calculation periods, so that on one chart you can see indications of both more global trends and medium-term and short-term trends. Let's look at an example of a strategy with two Price Channel tools at once.
One of the most important parameters that you must understand is the size of the period; the duration of drawing a straight line, which is located in the horizontal direction, depends on it, so by changing the calculation period, you can add several channels to the chart, which will perform their calculations with different reactions to price fluctuations. An example of two indicators is shown in the figure below:
Two price channel indicators
In the case discussed in the picture, a long position is opened when the lower curve of the indicator with a shorter calculation period is directed upward, and the lower border of the higher channel should draw a horizontal line. A completely opposite situation will be a signal to open a short position.
Forex channel indicators without redrawing
Many of the considered indicators have a common drawback - over time they are redrawn. For example, initially the channel border was higher, but after 15-3 minutes it became lower as the price also went down. It turns out that the signal that a trader sees now may change over time, which will not allow him to make a correct forecast and make a profit. To avoid these shortcomings, it is recommended to use indicators without redrawing: they retain an unchanged appearance both online and in history (after several hours or days).
Super Signal Channel
Displays the price corridor without redrawing, showing entry directions with arrows
- red – for sale SELL;
- green – for BUY purchase.
There are several parameters in the settings, the main ones of which are 2:
- Signal Gap – the distance at which the arrow appears.
- Sho Bars – the number of bars that are used to determine the channel: the higher the value, the wider the corridor.
Kanal Handels Signal
This algorithm is based on the previous tool. Shows extreme points and gives trend reversal signals (red or green arrows).
The indicator draws two broken lines on the chart – green (responsible for the lower border of the channel) and red (responsible for the upper border of the channel). A price rebound from these boundaries is the main signal for opening a transaction:
- if the price has bounced off the upper red border, the indicator will draw a red arrow and give a sell signal;
- if the price pushes off from the lower border, the tool will show a green arrow and give a buy signal.
SHI Channel
Another indicator without redrawing, which must be downloaded and added to the MT4 or MT5 terminal. It is a simple channel with straight lines - upper, lower and central (indicated by a dotted line). Signals for entry are obvious:
- the upper line is resistance; when it is reached, a sell transaction is opened;
- the bottom line is support; when it is reached, a buy deal is opened.
It is not recommended to change the settings of this algorithm, with the exception of the “Size” parameter. This includes the number of candles that the indicator analyzes. The default value here is “0”, i.e. the channel is built using data from an infinitely large number of candles. But it is better to set, for example, 15, 30 or 50, so that the indicator gives more accurate signals.
Examples
One of the main advantages of the indicator is its independence from a specific trading pair and timeframe. The indicator performs equally well both in cross-country events and in majors. The only thing is that during the first installation it is necessary to adjust the parameters to the volatility of the instrument, so that the price is inside the channel most of the time .
An example of a typical transaction: the price touches the outside of the channel, moves horizontally for some time (usually short-lived), and then shoots towards the opposite border. In this case, a stop loss is needed in case of force majeure, when the market begins to act unpredictably.
In the event that the price, having not reached the opposite line, generates another signal to enter in the same direction, it is allowed to use top-ups. In this case, the stop loss can be moved to the breakeven level of the first order.
Of course, the strategy shows the best results in the channel. In this case, there is no need to mark the levels, since these are the boundaries of the horizontal channel. The profit on such movements, of course, is not the biggest, but almost guaranteed.
Strategy based on channel indicators
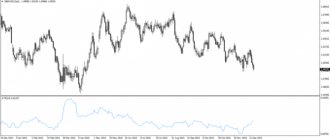
Channel indicators are very often used in trading systems in combination with other algorithms, for example, oscillators (MACD, Stochastic and others). One popular option is to use Bollinger Bands and Stochastic.
To open a SELL trade, you need to wait for the formation of 2 signals:
- The price touched the upper border of the channel and went lower.
- Stochastic is going down, leaving the upper zone.
Accordingly, the BUY signals are opposite:
- The price touched the lower border of the channel and went higher.
- Stochastic is going up, leaving the lower zone.
Stop loss is placed several points from the nearest maximum or minimum point. It can also be placed along the line of resistance or support. Profit is taken at the moment when the indicators give opposite signals. You can use any other channel indicators in the same way.
Attention! Different algorithms for determining a trading corridor can be used together with each other, but no more than 2-3 instruments at a time. Otherwise, the chart becomes confusing and the number of false signals increases.
Thus, channel indicators show clear boundaries within which the price moves up to 80% of the time. They allow you to enter the market when the chart reaches these lines, and in case of a breakdown, they warn you that the trend will soon change to the opposite. Recommended for use in conjunction with oscillators and resistance and support lines.
We recommend testing in practice the “Through Channel” trading strategy, which is based on Bollinger Bands signals. Instead of BB, you can use other channel indicators, and even simple resistance and support levels.
See also the video on the topic of the article - Forex channel indicators without redrawing
conclusions
To be honest, I personally don’t see much point in channel indicators. I believe that it is much better to gain experience in manual graphical constructions and already use them in practice.
In general, perhaps this indicator will be of some interest to you; perhaps this is the tool that was missing within your trading system. Channel trading is a very interesting method, but it must be used rationally and competently in order to receive a stable income!
PreviousNext
Binary optionsSMA or Simple Moving Average indicator