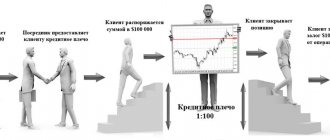
The concept of a currency pair is widely used in Forex in order to simplify the trading process, since at the time of purchasing one currency the trader always gives away another (sells it, it turns out).
The currency that is in first place in the pair is called the base one, and the second one is called the quoted currency.
The type of definition of a currency pair is accepted in international trading and always assumes the same designation - the base currency is written first, the quoted currency is indicated through a slash. So, if we take for example the EUR/USD currency pair and the quote of 1.22, this means that for one euro you need to pay 1.22 US dollars. It turns out that when buying this currency pair, the trader buys euros for dollars.
Trading on currency pairs offers a large selection of financial instruments, but the most popular are the euro/dollar - EUR/USD and the pound/dollar - GBP/USD. There are also others that are no less popular and profitable to work with. Before you start trading, you need to carefully study all the pros and cons of assets.
3 main categories of currency pairs:
- Majors
- Crosses – cross courses
- Exotics - exotic
Paired currencies
All currencies on Forex are traded exclusively in pairs. The format for displaying currencies, as already mentioned, is always the same. This procedure is approved and regulated by ISO (an international organization whose full name sounds like International Organization of Standardization).
There are always two people involved in trading on the foreign exchange market: the buyer wants to buy as cheaply as possible, the seller wants to sell as expensive as possible. Therefore, for any currency pair, the Bid (sales) and Ask (purchases) prices are indicated. The difference between them is also usually written down and is called a spread.
What a deal looks like for any currency pair:
- One side buys currency 1 for 2 (or sells 2 for 1)
- The second party sells currency 1 for 2 (or buys 2 for 1)
This happens simultaneously and at set prices. Almost any currency in the world can be paired, but traders do not work with all of them.
There are very popular assets, and there are those that almost no one trades, since they do not provide income (the price, for example, has not changed for years and there is no point in making purchase/sale transactions).
Where to open an account
When using the correlation factor, it is critical that the broker supports as many assets as possible. As for Forex companies, I can recommend AMarkets - more than 20 stock indices, CFDs on commodity market instruments, cryptocurrencies and other assets. There are also bonuses in the form of cashback spreads, good incentives for new clients, and Islamic accounts.
I will present the main trading conditions in tabular form.
| Company | AMarkets | ||
| Rates | Standard | Fixed | ECN |
| Minimum deposit | 100$/100€ or 5000₽ | 200$/200€ or 14,000₽ | |
| Recommended capital | 1000$ | 50 000$ | |
| Leverage | 1 in 1000 | 1 to 200 | |
| Spread, points | Floating, from 1.3 | Fixed, from 3 | Floating, from 0 |
| Commission | No | 2.5$, 2.5€ or 175₽ for 1 lot one way | |
| Minimum Margin | 1$ | 5$ | |
| Stop Out | 20% | 40% | |
| Exiting client transactions to the interbank market | No | Yes | |
| Ability to place pending orders inside the spread | No | Yes | |
| Requotes | Eat | Their absence is guaranteed | |
| Open an account | |||
How to read a currency pair
Regardless of which currency pairs are selected for work, the decryption is always identical. As stated above, the first currency is called the base currency, the second - the quoted one. For a certain amount of the quoted one they buy the base one. And quotes indicate the amount that needs to be paid in the second (quoted) currency for the first (base) currency in the designation.
So, the quote for USD/JPY = 95.78 reads like this: 1 US dollar can be bought for 95.78 Japanese yen.
Quotes are provided by brokers online, the values are constantly changing depending on how the prices of the currencies included in the pair increase/decrease.
It should be noted that the quote always indicates the amount that must be paid in the quoted currency for one unit of the base currency (not for 10, 100, etc., but for 1).
Results
The abundance of currency pairs does not mean that each of them is worth taking into account. Even if the strategy allows you to work on 7-8 instruments simultaneously, traders are limited to majors and a couple of crosses. one on all pairs at the same time ; for some of them, brokers offer high spreads, which also affects the difficulty of predicting their movements.
The effectiveness of trading directly depends on the selection of assets for trading . Don't take this lightly. Any remaining questions, ask them in the comments - I will answer everyone. There, share your thoughts on the topic of selecting assets for trading.
If you want to stay updated on my blog, subscribe to Telegram . It ensures that no new material escapes your attention. With this, I bid you farewell for a moment. See you soon, and good luck in investing! I hope your endeavors have already begun to generate stable income.
If you find an error in the text, please select a piece of text and press Ctrl+Enter. Thanks for helping my blog get better!
Types of currency pairs
There are three types of currency pairs. Most traders prefer to work with the main ones, some trade cross rates and it is very rare to find those who choose exotic pairs. However, you can trade Forex with any of the following assets.
Major currencies
The main currency pairs in Forex are those that include the US dollar. As a rule, these are the currencies of the most economically significant countries - the USA, the European Union (not a country, but the association has its own currency), Great Britain, Australia, New Zealand, Japan, Switzerland, Canada, etc.
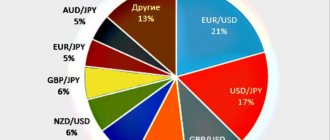
List of the most popular Major currency pairs:
These currency pairs are the most liquid - they are in demand, they are actively traded, constantly sold and bought, moving rates either down or up. If we consider the shares of traded currencies on the market, the situation is as follows: the American dollar takes 86.3%, the euro 37%, the Japanese yen 16.5%, the British pound 15%, the Swiss franc 6.8%, the Australian dollar 6.7%, the Canadian dollar 4.2% and then even less .
It is obvious that the US dollar is the leader in trading, which is primarily due to its status as a reserve currency in many countries.
According to the IMF report for 2009, about 62% of world reserves are stored in USD. Today, if the situation has changed, it is not so significant as to take away the leading position from the dollar.
The most important major currency pairs are dollar/euro, dollar/yen (Japan), dollar/pound (British), dollar/franc (Switzerland). Changes in pair quotations are influenced by the economic turnover of countries for which the constituent currencies are national. If the GDP of one state grows more actively, then this currency strengthens, if the economy of another develops better, it strengthens.
An important factor influencing quotes is the interest rate of the countries' central banks. If one central bank offers a higher rate, people want to buy that currency, which strengthens its position relative to the other. The same rule applies vice versa.
Trading major currency pairs attracts many traders, but it is not as simple as it might seem. The logic of the movement of currency pairs is not always clear, but may involve many factors: for example, the euro/dollar is influenced by a huge number of economic and fundamental factors, prices are constantly changing and not everyone knows how to work with the long-studied and most popular asset.
Cross pairs
Cross rates are currency pairs that do not include the US dollar. They usually demonstrate less activity compared to majors. Cross rates are still tied to the dollar, even though USD is not included. It turns out that first the base currency is exchanged for the dollar, and then for the quoted one.
Graphically it looks like this:
Calculations in numbers:
- EUR/USD = 1.10327 (current rate of the euro/dollar pair)
- USD/JPY = 123.465 (current dollar/yen pair rate)
- EUR/JPY = 1.10327 x 123.465 = 136.215 (current rate of the euro/yen pair)
All currency cross rates can be divided into the following categories: with the euro, yen, pound sterling and commodities (with the New Zealand, Australian, Canadian dollar). The largest trading volumes were observed with the EUR/JPY, EUR/CHF and EUR/GBP pairs. Sometimes they work well with CHF/JPY and GBP/JPY.
Charts in MetaTrader 4, their analysis, forecasting, signals to enter the market are practically no different for these currency pairs in comparison with the main ones. But price movement has its own characteristics.
Things to remember when working with cross-rates:
- This type of currency pairs is a secondary indicator, therefore it also depends on the USD, as well as on monetary policy and the economy of the respective countries. Everything is taken into account together.
- Thanks to the analysis of cross rates, it is possible to determine the direction of the trend and future changes in quotes of major currencies, since they are always in interaction.
- Classic trading works well with yen pairs (except for the combination with the Swiss franc and the Canadian dollar), but they are not suitable for beginners, as they can present many surprises.
- Cross rates exhibit increased levels of volatility and, if done correctly, provide greater profits over the same time period than trading major pairs.
- Until recently, trading this type of pairs had a disadvantage - the spread was very large and it was not possible to use these currency pairs for scalping. But today brokers offer normal spreads.
Exotic couples
Exotic currency pairs are the national currencies of small European countries (where the euro does not exist - the Norwegian krone, for example) and banknotes of developing countries in Africa, Asia, the Middle East, South America, etc.
These assets are traded very rarely, usually with small volumes and minimal liquidity. This type of pairs is considered very risky to work with, since the volumes are small, events in the economy and politics can be unpredictable, there is little historical data for analysis, as well as strategies, indicators, and tools for working with them.
Exotic currency pairs are the intersection of banknotes of small countries with the American dollar, as well as with each other. For example: USD/MXN (US dollar and Mexican peso), USD/RUB (Russian ruble), EUR/DDK (Danish krone), etc.
These pairs, as a rule, have high spreads, low liquidity, and poorly predictable price changes. You can work with them as an experiment, but before adding a currency pair to the trading terminal, you need to think carefully.
What are mirror pairs
There are currency pairs that move in the opposite direction on the chart or move synchronously: that is, when the price falls on one chart, it rises according to the same pattern (or also falls, if we are talking about synchronous movement) on the other.
As an example of synchronous movement, we can consider CHF/JPY and EUR/JPY.
This is the franc to yen exchange rate:
And this is the euro exchange rate also in yen:
You can see a lot of similarities in the graphs. Trends work in the same way: when a downward trend is clearly visible on one chart, the same is naturally visible on the other. This concerns synchronized movements.
When the graphs are mirrored, this is also noticeable. As an example, consider the movement of EUR/AUD and AUD/CHF.
This is the Euro exchange rate in Australian dollars:
And here is the exchange rate for the Australian dollar in Swiss francs:
Mirror Forex currency pairs interact based on the principle of correlation - interdependence. This principle is very important for trading and was first identified and used by experienced traders quite a long time ago.
The table below demonstrates how Forex currency pairs are correlated:
Correlation is the mutual connection of two financial instruments. And the important rule is that any changes in one instrument lead to changes in another.
Types of correlation:
- Negative – when prices on two charts move in opposite directions (these are mirror pairs).
- Positive – when quotes move synchronously.
Below is a table of correlation coefficients for currency pairs:
Knowing the peculiarities of how pairs interact with each other, a trader can successfully use this knowledge in trading.
Which ones are best to trade?
When thinking about which currency pairs are more profitable to trade on, you should take into account a lot of factors: knowledge, skills and experience in trading, personal preferences.
Usually, beginners are advised to choose the main pairs as the most popular and understandable ones - many strategies, indicators, and other tools have been created for them, there is a lot of theoretical information, and examples of trading by more experienced masters. The most popular currencies for trading on the market (and the pairs in which they are included) are the American dollar, euro, Australian and Canadian dollars, Japanese yen, Swiss franc, British pound. Euro/dollar is considered the most liquid and predictable instrument; any strategy can be implemented on its chart.
Example strategy for trading EURUSD:
Trend movements are clearly visible on the EUR/USD chart; prices can be predicted and worked with different analytical methods. The spread is usually small. You can also carry out news trading on the euro/dollar, since the exchange rate depends on events in several countries.
AUD/USD and NZD/USD are well suited for long-term trading - the currencies of New Zealand and Australia have low volatility, prices do not change very sharply, positions can be left open over the weekend (remembering the gaps, of course).
GBP/USD is also good for trading, but there is high volatility here, since the pound often breaks through resistance/support levels, breakouts can often turn out to be false.
Before you start working with a currency pair, you need to carefully study all the information about it. Much may become outdated - for example, USD/CHF is still indicated in some places as a highly technical instrument, but on January 15, 2015, everything changed (on this day, the Swiss National Bank stopped maintaining the franc exchange rate and “let it float freely”).
First tactics
The use of currency relationships was first noticed and used to their advantage by analysts at large hedge funds. These large-scale financial organizations identified mirror currency pairs, compiled a list, and then actively used correlation to insure open positions on individual assets. This tactic has become widespread due to its effectiveness and remains relevant to this day. Well, since it is used by financial market tycoons, why not private traders get a little profit from using it in their trading.
The relationship between individual trading instruments on Forex has a fundamental basis, since the economies of individual countries are closely related and important events for one state are instantly reflected in the exchange rate of another. As already mentioned, the relationship can be direct and reverse, and this should also be taken into account.
Commodity currencies
This is the name of the currency pairs of states that mainly earn money from the export of one or another raw material. These can be precious metals (gold, silver, platinum), oil, sugar, etc. This group often includes the currencies of countries that are developing. So, for example, in Madagascar, the export of raw materials accounts for 90% of the total share of exports.
Example strategy for Gold:
Major commodity currencies of the world:
- Canadian dollar (CAD)
- Australian dollar (AUD)
- New Zealand dollar (NZD)
- Brazilian real (BRL)
- Norwegian krone (NOK)
- Chilean Peso (CLP)
When trading commodity currencies, a trader must pay attention to what is happening in the country in the field of import/export, and how prices for raw materials change.
For example, in 2014-2016, the CAD (Canadian dollar) became cheaper in relation to the American dollar USD. There are two factors at work here: the dollar is strengthening against all currencies of the world, and oil has fallen in price by almost 3 times (oil is the basis of Canada’s exports).
It is not surprising that the currency has weakened - traders who know how to analyze news, markets and trends have certainly taken advantage of this.
The main criterion for selecting currencies for trading
When choosing, pay attention to several criteria:
- Liquidity . In economics, this term refers to the ability of a product to be quickly sold or bought. In simple words, liquidity directly depends on the number of sellers and buyers. The higher the liquidity, the lower the spread - the difference between the Bid and Ask prices is reduced to a minimum, and for ECN deposits it can reach zero. I recommend that beginners take an educational course about ECN accounts; brokers offer spreads from 0 points on them. For some trading techniques this is critical.
- Factors influencing the movement of a currency pair. Pairs with low liquidity are more difficult to predict; they are more influenced by the news factor and regulator actions.
- Spread . The smaller it is, the better.
- Hours of maximum liquidity . They must coincide with the trader's active hours, otherwise you will miss the main array of signals.
- Volatility . There are instruments for which, even during the work of Europe and the USA, movements are relatively weak; such assets are not suitable for all traders. If you come across this term for the first time, read the post “what is volatility”, it talks in more detail about this characteristic of financial instruments.
Among all world currencies, several of the most popular ones stand out. Billions of are traded on the Forex market every day . Not only large players, but also ordinary traders can make money from this.
The leader in demand is the American dollar . About 60% of the world's reserves are stored in the US national currency. Also popular currencies include the euro , pound , Japanese yen , Canadian dollar , Australian and New Zealand national currencies .
Forex brokers do not provide statistics on trading volumes; to determine the most popular instruments, you can rely on data from Bank for International Settlements. The report for 2021 shows that the situation has not changed , the most popular currency remains the dollar , and EURUSD is the leader in trading volumes.
The abbreviation EME stands for emerging market currencies. In the histogram in the figure above, each of the listed pairs can be used for trading.
Start trading with AMarkets
The best pairs for beginners
When thinking about which currency pairs are best for beginners, it is worth considering several aspects of the issue.
Main criteria for choosing a currency pair:
- Liquidity is the so-called popularity of a currency; it is influenced by the supply/demand ratio.
- Predictability - it is desirable that future price changes are easily predicted, all movements are understandable and justified.
- Volatility is the intensity of changes in value over a certain period of time (the range in which the price can change).
Which currency pairs should beginners choose:
- All major pairs except USD/CAD are poorly forecasted using technical analysis and are only suitable for night scalping. Also not very suitable are USD/JPY (risky, often produces surprises such as central bank intervention, etc.) and USD/CHF (low volatility).
- Beginners are advised to choose highly liquid and low volatility pairs. It is better to first give preference to calm assets that are well analyzed. As mentioned above, GBP/USD and EUR/USD, AUD/USD and NZD/USD are good.
- USD versus EUR is the smallest spread, well predicted by technical analysis, not very volatile, and does not involve serious risk. It is also important that the network provides a lot of information regarding this currency pair, many tools (strategies on our website, indicators, etc.).
- USD with GBP – high volatility (and higher levels of profit/risk), there is a lot of information on the pair, the forecast is more or less clear.
- USD/JPY – low spreads, smooth trends.
- Beginner traders are advised to choose currency pairs with a spread in the range of 0-3. If it is more than 6 points, trading will be very expensive with considerable losses.
But it is worth remembering that not all brokers have the same requirements, and it is better to choose a broker from our RATING , where the trading conditions are already indicated.
It is better not to choose exotic pairs - they are poorly analyzed. At first, it is better for a beginner to trade with one asset, without dividing his attention into several at once. When you manage to successfully trade on one of the main pairs, you can switch to cross rates if desired or add another asset.
As a trader gains experience, he can try futures on currency pairs. Futures contracts are instruments of the exchange market that make it possible to enter into transactions with underlying assets (currencies), but at a predetermined price and at a certain time.
Futures have their advantages - operational safety, transparency, the ability to estimate the size of open positions, trading volume and hedge risks, and the absence of price manipulation.
Correlation signals
The most important application of such analysis is price prediction and confirmation of trading signals.
For example, analysis of the EUR/USD
showed growth.
To ensure that the forecast is correct, you need to receive reverse confirmation on USD/CHF
.
Sometimes, to confirm trading signals and analyze the market situation, a comparison of three assets that are minimally related to each other is used. EUR/USD, USD/JPY and EUR/JPY as examples.
.
If EUR/USD is forecast to go up, then the forecast for the inverse currency pair USD/JPY should signal a fall. If there is no signal for USD/JPY, then you need to carefully study the behavior of EUR/JPY.
The economies of the USA, Eurozone and Japan have different influencing factors, so this analysis is additionally capable of providing information about which country is the driver of market movement.
Currency pair volatility
Volatility is the range in which the value of a currency pair can change over a certain period. So, during the day, one pair can change the price within 1-2 US dollars (112 in the morning and 114 in the evening, roughly speaking), another - by the full 150 (in the morning it costs 250, in the evening - 400). Changes in the amplitude of fluctuations in the value of an asset are a measure of risk and profit.
Volatility can be low or high. The higher the volatility on the chart, the higher the profitability of trading in the short term, but the risk also increases proportionally. A low level of volatility and price dispersion implies less - that is, the level of risk decreases, but also, as a rule, profit.
Volatility is measured over different time periods. Thus, the volatility of one day can be measured by simply finding the distance between the low and high prices on the daily chart. The indicator can change within a trading hour or session; this is a fractal value. Usually, volatility for the previous N candles is taken into account.
For example, to calculate the average volatility for the previous 10 days, it is enough to take the last 10 candles on the daily chart, add them up and divide by 10.
The volatility indicator depends on many factors - the trading session, the number of transactions in the market, the general state of the economy, players, currency, speculation, etc. Measured in points and percentages (more often used for stock volatility).
It is very simple to use knowledge about volatility in trading - the indicator allows you to predict changes in currency prices and successfully enter the market. So, knowing that the volatility of a currency pair is about 100 points per day, there is no point in entering the market along the trend if the price change has already passed 80 points - most likely, there are still 20 left.
And the opposite situation: knowing that the pair passes 200 points in a week, it is worth entering the market at the moment when it has passed only 25 points - most likely, the potential for movement is still large. Volatility may vary, but not significantly for specific trading instruments, as a rule.
An indicator of the strength of currency pairs, which shows the “strength” of a currency in the current trend, can also be useful. It can be a good help in combination with other currency instruments.
Understanding terminology and classification
Without being tied to trading, stable correlation refers to a statistical relationship between two or more random variables . If one of them changes, then a corresponding reaction appears on the other. The simplest example is the connection between oil and commodity currencies, the fall in the value of “black gold” affects their quotes.
The classification can be based on several criteria. connection stability as a basis , then the following stand out:
- Stable correlation . It persists for a long period of time, due to fundamental factors. An example of such a relationship is the cost of gas and oil. The price of blue fuel lags by 9 months compared to “black gold”, these are the features of its calculation. Another example is the price of gold and the state of the global economy. With growing uncertainty about growth rates, investors are moving money into defensive assets, and the yellow metal is one of them. Its price always rises during periods of crisis.
- Erratic or random . At certain points in history, high direct or reverse correlations may form between unrelated instruments. It is impossible to predict how quickly it will collapse. For example, a short-term correlation may form between the price of Apple shares and a CFD on sugar, but it cannot be used in trading.
According to the direction of communication there are:
- Direct correlation . An increase in one value statistically leads to an increase in others.
- Feedback . The growth of one value causes the fall of another. The simplest example is that when oil prices rise , the USDRUB and EURRUB also go up due to the decline of the Russian currency.
Classification is also possible according to the “strength” of the connection :
- ±1,0 – 100% correlation, does not occur in nature.
- 0.7…1.0 and -0.7…-1.0 – strong connection, can be used in trading.
- 0.3...0.7 and -0.3...-0.7 – correlation of medium strength.
- 0…±0,3 – not taken into account in trading; there is no statistically significant relationship between instruments.
Forex market sessions
The Forex currency market operates 24 hours a day, so traders have the opportunity to enter into transactions around the clock. But trading is not effective at all times.
The best time to trade a particular currency pair is when that asset is being traded by a large number of participants and in significant volumes. When the market is calm, you don’t have to open positions.
Trading sessions (Moscow time):
- New York - from 15.00 to 24.00
- Tokyo - from 2.00 to 11.00
- Sydney - from 10.00 to 19.00
- New York and London (when times overlap) – 15.00-19.00
- Tokyo and Sydney – 24.00-8.00
- Tokyo and London – 10.00-11.00
Trading is most effective when the sessions corresponding to the currency pair are working. For example, the most effective trading will be GBP/USD and EUR/USD during the London session and during the first hours of the American session (when both markets are functioning).
An example of a session trading strategy (you can download the indicator from the same link - i-Sessions.mq4 ):
Using correlation to reduce risks
When long-term trading or investing, correlation is used not to find entry points, but to reduce risks . If you have a portfolio of, for example, US blue chip stocks, you can hedge your risks by opening a counter position on the S&P 500 index.
Suppose the portfolio includes shares of companies such as Apple , Intel , Amazon , Facebook , Johnson & Johnson , Visa . At the beginning of 2021, after disturbing news from China, the investor became worried and decided to reduce risks in case the virus escaped from China and the world economy suffered. For the listed assets, an instrument with high correlation is selected. In this example, the ideal option is the S&P 500 index .
The simplest insurance option is to find a broker that supports CFDs on this index, for example, AMarkets. An Islamic account is opened, and a sell transaction is made on it on the S&P 500. After waiting out the period of crisis, the investor closes the short position and compensates for most of the loss on the investment portfolio.
Earnings from pair correlations
Correlation is a certain statistical relationship between two currency pairs. That is, instruments can be dependent on each other and their prices move synchronously (direct, positive correlation) or mirror (reverse, negative correlation, we have already given examples above).
Here it is worth remembering the term “mirror Forex currency pairs” - these are pairs whose value moves in an inverse relationship (often even the charts are similar, but as if in a mirror image). Direct dependence is when pairs move almost identically, sometimes with some delay.
The correlation moment in Forex trading can be used for effective trading, especially if you are working with multiple assets. The correlation coefficient is indicated by numbers from -1 to +1. The range is from -1 to 0 – mirror correlation, from 0 to +1 – direct. The closer the coefficient is to zero, the lower the relationship and the more dependent it is on chance.
For analysis, large calculation periods are often chosen - to determine the coefficient, you need to use at least 100 bars. The daily charts of EUR/USD and GBP/USD, for example, show a direct relationship - usually these trending Forex currency pairs move in the same direction and at a similar speed.
What affects the correlation:
- Region of selected assets - comparison of the development and structure of the economies of states, the predominance of exports/imports.
- The status of foreign exchange assets in the general market, the demand for currency, the volume of their trading.
- The connection of assets with the stock/commodity market is the strongest correlation here.
Fundamental factors tend to change - accordingly, the correlation also changes (strengthens, weakens, changes direction). Relationships are monitored continuously using data from at least the previous 3 months.
When trading multiple assets, mirror correlation is often used as a trend technical indicator, which is especially important when one pair is ahead of another in time. Then you can use the data as a warning signal about future changes. When opening a deal on one asset, they carefully monitor the mirror one and, as soon as changes occur there, they use the information in analysis and decision-making.
Mirror correlation is often used to hedge unprofitable orders and reduce risks, waiting for a trend correction.
But there are situations when one couple makes a sharp jump, and the second does not. Then we are talking about false jumps associated with certain events. More reliable signals are given at older time intervals.
Thus, there is no direct income from currency correlation, but the information obtained from analyzing the relationship of pairs can be very useful.
How to Calculate Correlation in Excel
If you don't like the Oanda tool and want to do everything manually, Excel will allow you to do it without any problems, just like a calculator. However, to obtain reliable results, you need to take an archive of quotes for at least 6 months, otherwise you will not notice strong fluctuations in values.
This data is then copied into the table:
The correlation table uses daily values, which makes the most sense, although, of course, no one is stopping you from importing at least minute ones. Although, I'm afraid this will crash your Excel and your entire computer along with it.
For example, let's take daily data for a month.
Now, in the first empty cell under the desired pair (in our case, EUR/USD, which we will compare with USD/JPY), enter the value “ =correl( “ (without quotes). Or, for the Russian version of Excel, the value “ =CORREL ( “. As you can see, no complex formulas are needed.
All that remains is to select the column with the data range (a rectangle with dotted boundaries will appear). We put a comma.
After the comma, similarly select the price range for USD/JPY. Press Enter and get our correlation coefficient for the selected pair.
This is repeated for other pairs, after which you can make a convenient table with these coefficients for each period, from a week to a year.
You can update such data once a week; it is hardly wise to do this more often - you will get tired much earlier.
Pair correlation indicator for MT4
On the charts, the trends of currency assets with direct correlation are displayed in a similar way - when the value of one falls/increases, the price of the second behaves in the same way. If the correlation is reversed, then prices can move in almost a mirror image. But it can be difficult to visually recognize and analyze all this on your own.
Many traders use a special currency pair correlation indicator for MT4; you can download it from the link - CurrencyPairsCorrelation (archived)
Installing it is as simple as adding currency pairs to MT4 - just use the pre-installed tool or download it from the website (link above) and install according to the usual algorithm.
This option involves more efficient trading, since the trader does not have to monitor several charts at the same time and the tool does most of the work for him.
Building synthetic graphs
The method is suitable for assessing direct correlation. The idea is that a synthetic chart is built, for example, one instrument is divided by another or the difference between them is calculated. If there is a stable connection, then the calculation result will remain in the range.
The corresponding functionality (arithmetic operations with charts) is available on tradingview.com. If the account does not have Pro status, then the synthetic chart will be built on the D1 timeframe and higher - this is the only limitation.
For example, let's take charts of assets with a guaranteed high correlation - the S&P 500 and its ETF (ticker SPY ). Having calculated the S&P500/SPY ratio and plotted a graph of the new asset, we see that it fluctuates around the average value. This confirms the long-term relationship between the instruments.
The same technique can be used in trading. The corresponding strategy will be discussed below.
Correlation of cryptocurrencies through “MF allies”: unknown for financial markets
There are several important Masterforex-V correlation methods for cryptocurrencies, here we will consider only three
- all cryptocurrencies are “MF allies” against the US dollar;
- all altcoins are “MF allies” against Bitcoin;
- The different volatility of Bitcoin and altcoins determines the correlation and trend of their cross rates.
What does this give practically to Masterforex-V traders? We will give only ONE of our conclusions to the public:
1. technical and Elliott wave analysis for ONE ally is a signal for the rest of the altcoins of the TOP 50 cryptocurrencies (for example, about the decay of momentum and an imminent trend reversal).
An example and calculations of a possible trend reversal for Bitcoin from the closed forum of the Masterforex-V Academy. Can you guess at once what is happening with the rate of altcoins to the US dollar at the same time? That's right, they are also trying to turn upward.
2. The “heavyweight” of the crypto market, Bitcoin, has different volatility compared to altcoins.
Question: when Bitcoin rises against the US dollar (BTCUSD), which of the listed cryptocurrencies will fall at the Bitcoin/altcoin cross rates - ETH, XRP, LTC, BCH, EOS, OMG, ETC, XMR, BNB, NEO, IOT, BSV, TRX , DSH, XLM, ZEC, ADA, DASH, XTZ, NEM, LINK
Correlation can be positive or negative.
There are different degrees of relationship between -100 and 100:
- if the correlation is above 70 and positive , then the currencies are moving in tandem.
- If the correlation is above 70 and negative , then the currencies are moving in opposite directions.
- below 60, then the currencies do not move the same way.
Where can I find information about current currency correlations?
There are several websites that track currency correlations between pairs. They present the data in an easy-to-read table:
- Investing.com correlation calculator
- Fxstreet correlation calculator
- Oanda correlation calculator
Correlation table from the investing website