Financial markets operate with a variety of securities, which include stocks, bonds, checks, bills, etc. To make the maximum profit on all these assets and with a low degree of risk, you need to pay attention to such a parameter as the liquidity of a stock or other security. After all, the better you understand the essence of this indicator, the more consistently you will earn money in trading.
Liquidity means the speed and ease with which a stock or bond can be sold at the most optimal price for the trader.
This topic is difficult for traders if they had no financial training in their “past” life before investing. Liquidity means the ability of any paper to turn into cash. Logically, there is a stable demand for the securities you have chosen, they are ready to buy them at your price and provide you with maximum profit.
What it is?
This is the name given to the ability to quickly exchange material wealth for cash at the best price. Its level shows how soon a buyer, if desired, can sell something at market value. In the case of securities, the parameter shows how quickly they can be profitably exchanged for money.
Liquidity of securities and its connection with the market
This indicator is influenced primarily by the market in which the funds trade.
They are divided into two main types:
- stock exchange;
- OTC.
On the exchange market, assets are sold at open auction under conditions of unlimited competition. Therefore, here the liquidity of shares is determined during the transaction.
The following concepts are used to denote this indicator:
- blue chips are sought-after assets;
- junk assets are illiquid securities.
The shares of companies with a risk of bankruptcy or those operating in new markets are most often classified as junk.
In an over-the-counter market, the price is determined by the buyer and seller. The transaction here will be completed much slower than on the exchange. After all, in order to buy or sell securities, you need to find a seller (buyer), an intermediary, or a lawyer who will draw up the necessary documents. Therefore, the liquidity of shares traded on the over-the-counter market will be much lower.
These two types of trading platforms are the main ones, but there are others. For example, where distressed assets are traded. Transactions on such platforms are not really controlled, so the risks associated with them are enormous.
How to analyze them
Analysis of price movements comes down to two main approaches.
First, fundamental analysis. How to determine whether a stock is interesting for investing or not? We need a comprehensive assessment of the company's state of affairs based on production and market indicators. Profit, assets, credit load, etc. Taking certain values, formulas are determined - fundamental analysis coefficients.
Eg:
- EPS is the ratio of net profit to the number of shares. How much can you earn on one piece of paper? One of the key parameters for building a strategy;
- P/B is the ratio of share price to inventory. Inventories are the balance of materials after debts are paid off. With data <1 - the company is undervalued, from 1 to 2 - a fair assessment, >2 - overvalued;
- EV/EBITDA - gives a quick assessment of revaluation or, conversely, compared to competitors. Shows how long it will take for the profit not spent on depreciation, payment of interest and taxes to recoup the cost of acquiring the company.
Secondly, technical analysis. This is the construction of historical charts of price movements with various forms of representing the price curve (simple line, Japanese candles, bars) and various technical indicators that allow, through the built-in mathematical apparatus, to analyze the already accomplished price movement.
Let's take as an example the Sberbank share price chart.
The form of presentation is Japanese candlesticks. One candle - one day, one session. A green candle means the price is rising, a red candle means it is falling. The main body of the candle is the opening/closing price of the trading day, up/down shadows (tails) - what levels it reached during the day. Below is a chart of trading volume.
The rate indicator is the Bollinger band. Shows the deviation of quotes from the average value. Growth and value go beyond the upper limit - a signal of overbought, the lower - a signal to buyers.
ADX - exchange rate indicator. Shows the force of movement regardless of the direction - up or down. Recommendations similar to Bollinger - at the bottom, the strength of the bears is locally dwindling, at the top - the bulls.
There are dozens of such rate indicators.
What is liquidity
Liquidity is the ability to quickly sell an asset at a market price, that is, without discounts. The faster this can be done, the higher the liquidity of the asset. Let's look at examples. Now it will be offensive, get ready.
Real estate is a low-liquidity asset (contrary to what my parents said). You will not be able to quickly sell your apartment at the market price. Even if there is a buyer, it takes time to collect documents, check everything, and formalize the deal with Rosreestr. This is not fast, which means it reduces the liquidity of your apartment. At the same time, the liquidity of each apartment is also different - it’s easier to sell a one-room apartment in the center than a three-room apartment on the outskirts.
A used toothbrush is an illiquid asset. It is unlikely that you will be able to sell your old toothbrush to anyone. Unless, of course, you're Paris Hilton. The brush immediately after purchase loses its ability to be sold to someone at a market price.
A similar example is a new car, which immediately after purchase loses about a third of its value. Some old models can only be sold under a recycling program. The car, contrary to generally accepted beliefs, is a low-liquid asset, on the verge of illiquidity.
Bank deposit - liquidity depends on conditions. For example, in the same Tinkoff Bank I can close my deposit through the application and receive money the next day. But you still have to wait one day, and due to early termination, the accumulated interest is lost.
Where can I see stock prices?
You can view stock prices on the following sources:
- Moscow Exchange. https://www.moex.com. List of traded instruments on this page.
Select an instrument on the left - stocks, bonds according to the list, level - 1,2,3 and trading display mode. So easy to see the course.
- St. Petersburg Stock Exchange. https://www.spbexchange.ru. The most interesting thing that is traded on the stock exchange is shares, bonds, ADRs of foreign issuers. Almost the entire composition of the S&P 500 index is presented. There are more than 770 instruments in total. Data on trading progress and results on the “market data” page. Screenshot of the page where you can see the Central Bank exchange rate.
- TradingView. https://ru.tradingview.com.
- Investing.com. https://ru.investing.com.
- Finviz. https://finviz.com.
- MarketScreener. https://www.marketscreener.com.
- ProFinance Services. https://www.profinance.ru/quote_show.php.
- Yahoo Finance. https://finance.yahoo.com.
- MarketWatch. https://www.marketwatch.com. US post-trade session: https://www.marketwatch.com/tools/screener/after-hours.
- QuoteSpy. https://quote-spy.com.
- Premarket USA. https://money.cnn.com/data/premarket/index.html.
What is bond liquidity?
Liquidity is the ability of an asset to be quickly sold without reducing its own value, that is, to turn into money. When making financial transactions, the degree of liquidity of an object serves as an important criterion for determining its price.
This property groups values into:
- highly liquid;
- low liquidity;
- illiquid.
If bonds can be quickly sold without loss of value, then they are classified as highly liquid. Conversely, low-liquidity and illiquid bonds are very difficult to sell in a short period of time without significantly reducing the price. At the same time, bonds, along with shares, are considered the most liquid assets of an investor.
What is the purpose of assessing the liquidity of a company’s assets?
An assessment of the liquidity of a company's assets is performed to confirm the solvency of the company and the ability to cover existing debts using its property.
When a company's warehouses are full of goods and there are large sums of money on its accounts, it is less likely to require advance payment and it is easier to provide loans from banks, because there is a guarantee of subsequent payments.
Conversely, if the accounts are empty, and all the property consists of the ruins of factory buildings in the industrial zone, then the company is close to bankruptcy and will not be able to fulfill its debt obligations.
Main factors of securities liquidity
There are many factors that influence this indicator. I will analyze the main ones in more detail.
Paper package size
The volume of securities of a joint stock company traded on the stock market has a direct impact on their liquidity. Shares sold in large blocks are more liquid, since owning a block of more than 25% makes it possible to influence the company’s activities.
Such a packet is called a blocking packet. If the controlling stake (more than 50%) does not belong to one shareholder, then the owner of 25% of the Central Bank has the opportunity to make decisions on the management of the joint-stock company.
Spread
This is the difference between the purchase and sale price of a block of shares. Securities with a spread of 0.5% or less are highly liquid.
Daily turnover
Quite a subjective factor. However, an investor may decide to invest in a stock knowing that it is in demand.
Interest of market sharks
If serious people show interest in shares in certain joint stock companies, liquidity increases.
Coefficient method
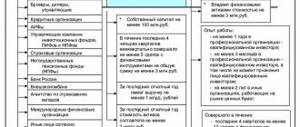
The coefficient method of liquidity analysis is the simplest. It includes:
- Determination of the composition, frequency of calculation and limit values of liquidity indicators
- Analysis and assessment of the state of liquidity indicators based on:
- comparison of actual values of indicators with standard, limit values;
- analysis of the dynamics of actual indicator values;
- carrying out factor analysis of changes in actual values;
Selecting ways to eliminate inconsistencies identified based on the analysis
Liquidity standards of the Bank of Russia
Currently (July 2010) the Bank of Russia has established three mandatory liquidity ratios:
| Standard | Name | Description | Limit value |
| H2 | bank instant liquidity standard | Regulates the risk of a bank losing liquidity within one business day | ? 15 % |
| H3 | bank current liquidity ratio | Regulates the risk of a bank losing liquidity during the 30 calendar days closest to the date of calculation of the standard | ? 50 % |
| H4 | bank long-term liquidity ratio | Regulates the risk of a bank losing liquidity as a result of placing funds in long-term assets | ? 120 % |
All commercial banks in Russia submit a monthly report to the Central Bank of the Russian Federation on the status of these indicators.
Are liquidity and profitability the same thing?
No, although they often go in pairs.
Based on the return on securities, you can determine the amount of profit that the assets have brought since the moment of their purchase. And liquidity will show how quickly this was done. This is always a positive value that has several levels.
To calculate the profitability, it is necessary to subtract their initial cost from the funds received from the sale of securities and divide by the starting capital. If the price of shares at the time of sale is lower than at the time of purchase, then the profitability will take a negative value.
Example of calculating position volume
Let's assume that the capital for trading in financial markets is $2000. The above signal appears to enter a buy signal for a breakout of the level on the market for the USDJPY currency pair (Fig. 3).
Positions on this trading account are opened quite rarely, and the acceptable risk from the current capital is 3% per trade.
The risk in points is 211.
The point value for one USDJPY contract at the time of this article is $9.15.
Input data for the formula:
- Capital: $2000
- Risk as a percentage of capital: 3
- Risk in points: 211
- Point value per contract: $9.15
Position volume can be calculated extremely simply. The numerator is capital multiplied by risk as a percentage of capital and 0.01. The denominator is the risk in points multiplied by the cost of a point for one contract:
Position volume = (2000 * 3 * 0.01) / (211 * 9.15) = 60 / 1930.65 = 0.0310776
It is impossible to open a position of exactly this volume on this market, so we will round the resulting value to the nearest acceptable one - 0.03 contracts. If the acceptable risk in this transaction is 3% of capital, you need to open a position with a volume of 0.03 contracts.
If the transaction is closed with a loss, its size will be: (211 * 9.15) * 0.03 = $58, which is equal to 2.9% of the capital. Due to the rounding of the position volume, an error arose, however, it is clear that the formula allows you to “sew” a previously known and acceptable level of risk into the transaction.
Liquidity assessment methods
There are several dozen such methods of varying complexity. But the two most common ones can be identified:
- Fundamental analysis. The issuer and its financial statements are thoroughly studied. The solvency of the company, its stability in the market and prospects are assessed.
- Quantitative analysis. It is based on the study of quantitative indicators.
Accuracy in determining position volume
In the Forex market, you can trade fractional contract values, for example, buy 1.63 or 0.82 lots. The larger the trading capital, the more accurate the position size calculation will be, however, in most cases you will have to round the resulting value.
If you are trading in a market where such splitting is not possible, but the position size required to enter is less than one whole contract, you need to look for a smaller contract size. For example, open a position with several mini-contracts, mini-futures.
Rice. 4. Euro FX Futures. Contract size for CME and MOEX
The second option is to look for similar futures in other countries or markets. Sometimes you can find a completely suitable instrument with a lower cost of the entire contract (Figure 4).
If it is not possible to find the required volume, then, according to the trading plan, there is no entry into the market, since it is not possible to open a position with the planned level of risk.