Basic models, patterns and signals of VSA analysis
A trader needs to focus on finding financial instruments that have high liquidity. When looking at a chart, it should be easy to spot a powerful trend. These are the conditions that you should pay attention to when working.
If you study the classical model, it will become clear that it is based on an analysis of the market situation. Traders pay attention to accumulation and distribution, and they also look at the stages of growth and decline.
During the period when accumulation occurs, as well as during distribution, there is no volatility in the market, so there are no movements required for the trader to make a profit. In such a situation, orders are grouped at approximately the same level.
Large players enter into trades in large lots, during the accumulation period they open positions in parts, and when distribution occurs, orders are partially closed. This results in classic VSA signals being visible on the chart. Traders at this moment need to determine what decision the major players are making, and then act similarly.
Before making a trade, a trader should open the chart and see if there are major players in the market. There are no strict rules of analysis, the rules are changeable, and everything depends on how the volume and price of the asset behave.
The trading method is widely used in Forex, it is used by traders working on stock and commodity exchanges, as well as specialists trading futures.
Each market has its own peculiarities in the use of volumes. Liquidity indicators matter, but the general philosophy, which is based on working together with major players, remains the same for all markets.
You can get FREE training in trading using the VSA method from professional traders - HERE ⇒
Weak market participants vs strong players
Natural selection works in the market: the strongest wins. Those who are stronger look for the weak points of the stock crowd. When they find them, they use various stock exchange manipulations to get their money.
It's simple: to survive in the market, you don't need to be among the weak. You should work like a strong player works. When a trader is in a crowd of weak participants, he creates all the conditions for losing his own deposit.
Why do speculators side with weak players? It's about fear, the fear of admitting your own mistakes. The reluctance to admit your own negligent attitude towards trading forces you to blame anyone and anything for negative trading results, but not yourself.
VSA Analysis - History of the Method
Traders often wonder what VSA is. This is an acronym that stands for Volume Spread Analysis. The method was developed for use in the stock market. It appeared in the first half of the 20th century, the founder is Richard Wyckoff. His work was subsequently continued by Tom Williams, who worked on what is now called VSA volumes. Thanks to him, the method took the form it has today.
The Philosophy of Richard Wyckoff
Richard Wyckoff was born in the USA, at the age of 25 he was already the owner of a brokerage company. He devoted a lot of time to trading on the stock market, tried different methods, analyzed. Based on the information received, he created a method that traders use today, it is called the Wyckoff method. The use of volume is the basis of many strategies that bring stable profits.
Richard specialized in speculative trading, and he classified as speculators only those market participants who had their own strategy, traded in accordance with it, and entered into transactions after a thorough analysis of the situation and taking into account their plans. He compared his other approach to work to gambling.
When studying Wyckoff's trading philosophy, we can highlight the following:
When analyzing graphs, you do not need to take into account various factors. Everything that is needed has already been reflected in the value of the asset and in volumes.- The Wyckoff method is universal; it can be used when working on different time frames. It is suitable for all markets - from futures to options and currencies.
- Supply and demand influence the price; they are behind all its changes.
- The market price level depends on what decisions traders make, so trading on the stock exchange cannot be called an exact science.
- Specialists should give preference to technical analysis.
- Indicators based on mathematical analysis are inferior to volumes, but VSA signals can be used.
- The price of an asset will rise as long as there are people willing to purchase it. If there are people willing to sell the asset, the price goes down.
Richard believed that when identifying turning points, one should pay attention to the psychology of investors, and not to mathematical analysis.
Wyckoff method
Traders who are becoming familiar with the Wyckoff method will note that the following charts can be used when working with VSA:
- bars;
- waves that are useful to consider when working in the stock market;
- Tic Tac Toe.
Richard used all 3 types when working. He needed candlestick analysis in order to determine which direction the price was going. After that, he determined where he would enter the trade and where he would exit it. He needed the candles to set a stop loss.
Turning to the tic-tac-toe chart, he assessed the movements and was interested in the price momentum. After that, he set a goal that he intended to achieve in the trading process.
He studied a wave chart reflecting how the price of a group of assets behaves in order to select suitable securities. He stopped at those that moved faster than others in the group.
Market Mechanics by Wyckoff
Richard believed that when the demand for an asset equals its supply, the price is in balance. In this case, a flat occurs in the market. As soon as an imbalance occurs, prices begin to rise or fall.
If we consider the price movement, we can identify the phase when accumulation occurs. After this, an upward trend begins and is replaced by the distribution phase. After it, the trend changes its direction, and quotes begin to fall.
Application of Wyckoff methods today
The trading philosophy that Wyckoff developed is still used today, but new traders should understand that the Wyckoff method is a general system. Without knowledge of how the market works, it will not be possible to use it. Each market situation is individual, and this must be taken into account.
Template application will not bring profit. Beginner traders often lose money when they misunderstand VSA signals. They suffer losses on false breakouts, which can occur suddenly and be aggressive. Often the movement phase may be longer than it was previously, or shorter, and this needs to be taken into account.
Let me remind you that you can get FREE training in trading using the VSA method from professional traders - HERE ⇒
VSA Analysis by Tom Williams
Williams was born in 1929; he started on the stock exchange with day trading.
In his work, he relied on the Wyckoff method, but added candles. At the beginning of the 20th century, the spread (by which in this method we mean the difference formed between the max and min of the bar) and volumes were interconnected. When computers appeared, Tom decided to implement automation. This led to the creation of the TradeGuider platform, which was created specifically for working with volumes.
It showed patterns, and traders began to receive signals that they used to work in the market. Volumes are used to work on the stock market; there are indicators for QUIK.
Modern view of the method
The volume method is used by professional traders and private traders. It is suitable for work by specialists trading on the stock exchange and foreign exchange. VSA has proven itself well when concluding transactions on the commodity market and when working with futures.
It will be more difficult for beginners to grasp the principles of trading if they are not familiar with the basic concepts. They are better off starting with pricing rather than delving into bar-by-bar analysis. It is useful to remember the patterns, practice the strategy on a demo account, and then move on to making trades.
Basic models, patterns, signals of VSA analysis
Before starting work, you need to see if the instrument is liquid. If the demand for an asset is high, this means that large players have entered the market and make transactions in large lots.
This causes the market to move, a trend arises that the trader must take into account. When deciding to enter into a transaction, it is necessary to take into account the stages of consolidation and wait for the right moment to enter the market. The VSA indicator can help you make a decision; to activate it you need to press just one button on the terminal panel.
4 stages of distribution accumulation
When the market is flat, traders expect a strong movement. This leads to consolidation of orders at the price level. When a major player arrives, he opens an order with a large lot, and movement begins.
Classic signals include the following:
- level test;
- shaking out;
- up-trust.
A private trader must understand which direction the price will go and then enter the market in that direction.
VSA principle effort/result
In this case, the trader must concentrate on the volume of a group of bars or one candle, while he needs to take into account the spread (in the sense of VSA).
For example, when the price moves up, it is considered to be strengthening. If the spread of the candle is higher than average with increasing volume values, then this indicates that there is high demand for the asset. The opposite situation is also true.
VSA signals of growth/decline and price reversal
Professional traders use the Wyckoff method.
It contains about a hundred patterns, among them the most popular are the following:
- shaking out;
- level attack;
- up-trust;
- surrender;
- climax.
Beginners should first undergo training, study the basic patterns, and learn how to find them on charts. After this, you can proceed to testing on a demo account, and only then enter into transactions on the market.
And once again we attach a link to FREE training in trading using the VSA method from professional traders - Take the course ⇒
Reversal (change of trend) or continuation of trend?
It is also no secret to anyone that the movement will either continue or change (a reverse will occur).
Many traders, after a strong impulse movement, necessarily wait for a global price reversal, explaining this by the fact that it is already very expensive, it’s time to go back. This is an incorrect and, moreover, very dangerous judgment.
In our case, a reversal may occur with a higher probability after leaving the downward state of equilibrium (in an upward trend).
Until this market phase has begun, trading is carried out in the direction of the main trend in anticipation of its continuation.
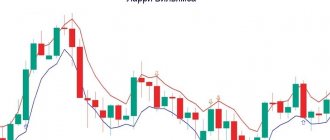
Let's illustrate this schematically: