Scalping indicators are special technical tools for trading on the Forex market, which significantly simplify chart analysis and decision-making algorithm in the process of short-term trading.
Scalping is a type of short-term trading that involves concluding a large number of transactions in the shortest possible time and making money on small price fluctuations.
Taking into account the fact that transactions are concluded not for months or even for days or hours, but most often for minutes, the best indicators for scalping must meet certain requirements - to be extremely accurate and quickly respond to any market changes. After all, even a second or minute delay can cause the loss of a good moment to conclude a profitable deal.
Scalping involves a large number of opened trades during one trading day, so indicators for this type of trading are often made signal or arrow, which greatly simplifies working with them. If the work is structured correctly, a trader has the opportunity to make a good profit.
And even though the amount of income in one transaction is small, if dozens of successful positions are opened per day, trading can yield large profits.
Indicator for scalping 3RDGenMA. Download
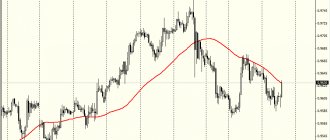
We will start with a simple one, although this tool is considered an indicator, I would still be more inclined to think that this is a mini-trading strategy. The bottom line is that we only need two moving averages, the intersection of which will give signals to buy or sell. It is worth noting that for different time intervals, it is necessary to use different calculation periods, everything will look like this;
- Minute time interval - moving with a period of “60” and moving with a period of “240”
- Five-minute time interval - moving with a period of “12” and moving with a period of “48”
- Fifteen minute time interval - moving with a period of “16” and moving with a period of “96”
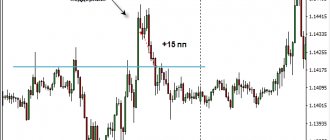
The picture below shows how the price chart should look after installing the 3RDGenMa tool;
3RDGenMa indicator on the chart
- A buy position is opened if a lighter moving average crosses from below to a heavy moving average above. We will place a safety stop according to the classic version, namely at a nearby minimum peak, while the take should be no less than the stop loss multiplied by two
- A sell position is opened if the light moving average crosses the heavy moving average from top to bottom. The stop is placed at the nearest peak high, the take should also be twice as large as the stop loss
You can also exit trades based on a reverse signal. Based on this, we can conclude that such a trading strategy involves constantly being in an open position. Personally, I don’t like to exit based on opposite signals; I prefer to trade a fixed take, since using fixed methods it is much easier to calculate capital and risk management.
Post about the best indicator for Binary Options, read and download for free
Additional points
Finally, I would like to note that you should not think that by downloading Forex indicators for scalping, you will immediately be able to reach a good level of income. This is especially true for beginners, since for successful trading it is still necessary to understand the main market factors.
In particular, you should take into account the influence of fundamental factors, monitor news releases on traded instruments, take into account key support and resistance levels, follow the global trend, become familiar with reversal patterns, and so on. This general preparation will greatly improve the quality of your trading, while helping you avoid stupid mistakes.
And finally, I would like to say that you should not chase complex Forex systems and indicators for scalping. The above tools offered to your attention, with proper preparation, may well become faithful and reliable assistants; the main thing is to choose the one that best suits your trading style and calmly test it first on a demo account in order to identify strengths and weaknesses in practice. After the test is completed successfully, you can safely start real trading, remembering the tips given above and not forgetting to set take profit and stop loss. The latter must be mandatory, since many people when scalping sin by sitting out losses in excess of the norm, counting on a reversal, and doing this is strictly contraindicated!
Indicator for scalping ATR 3LWMA. Download
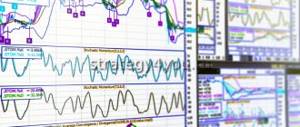
This type of instrument belongs to the category of basement indicators; after the trader “throws” it onto the chart, he will see three moving averages in the window. The red moving average is a signal moving average, the Blue moving average is a slow moving average, and the Blue moving average is a fast moving average. Just like in the example with the indicator above, ATR 3LWMA needs to be configured for a specific time interval
- Minute time frame - signal moving average - period 13, slow moving average - period 34, fast moving average - period 21
- Five minute time frame - signal moving average - period 12, slow moving average - period 33, fast moving average - period 18
- Fifteen minute time frame - signal moving average - period 21, slow moving average - period 55, fast moving average - period 34
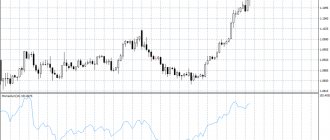
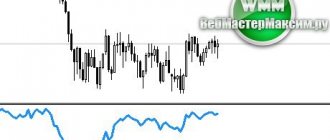
An example of the indicator display in the figure below;
ATR3 LWMA on the price chart
The authors note that the indicator achieved the best performance indicators with average market volatility, that is, there is no need to take signals during the Asian session, as well as when important macroeconomic news comes out, fifteen minutes in advance and after.
Article about the most accurate indicators for trading on the foreign exchange market, read and download
As for the signals, everything is simple and classic here: a long position is opened when the signal moving average crosses the other two moving averages from bottom to top, and a short position is opened when the signal moving average crosses from top to bottom.
Competition with trading robots
You can’t talk about scalping without touching on the topic of algorithmic trading. 20 years ago everyone was trading against each other. Now there are programs that anyone can get on the Internet. These programs work on the algorithms of popular technical analysis indicators and automatically find entry points and open transactions.
Major hedge funds are investing in the development of neural networks ahead of humans and the development of high-performance quantum computers to create a flawless trading machine that will make them money 24/7.
So soon we all as traders may become uncompetitive. By the way, today this is one of the reasons why many traders are disappointed in the market and are looking for more “solid” income that robots cannot take away.
Indicator for scalping BB OsMA. Download
This tool is a little more complicated than those discussed above, since in addition to moving averages, it also has Bollinger Bands built into it. Similar to the previous one, it belongs to the type of basement tools; it consists of two moving systems, but their operating algorithm does not consist of classical intersection, but of identifying the distance between them, which is ultimately displayed either in red or white dots. The second tool is the now legendary Bollinger lines (bands). As for the trading interval, here it will already be limited, the creators developed the tool exclusively for a five-minute time frame, of course, you can adapt to other intervals, but still the best indicators will be on a five-minute time frame.
BB OSMA on the terminal chart
- A long position is opened if the OSMA point touches the lower Bollinger band, after which it changes from a red dot to a white one. The stop is placed behind the line, and profit is taken after the price reaches the opposite border of the channel
- A short position is opened if the oSMA point touches the upper Bollinger band, after which the white dot changes to a red one. The stop is placed behind the Bollinger band, profit is taken at the opposite channel border
RSI Bollinger Bands
We like:
- High-quality technical indicator.
- Comes with options and display settings.
- Extremely accurate for trend breakouts.
- Includes alerts, arrows and other convenient features.
- It's easy to predict breakthrough trades and market volatility.
Flaws:
- Can be a little intimidating for new traders due to the number of features and information on the screen. Beginners should take the time to learn its features and understand which options suit their trading style.
Indicator for scalping SQUEEZE RA. Download
Intended for use at intervals less than five minutes. After installation, a basement window opens, in which the readings are visualized in the form of histogram bars of four different colors.
- Blue bar - located above the zero mark, indicates that the bullish trend is intensifying
- Blue bar - located above the zero mark, indicates that the bullish trend is weakening, a possible rollback
- Orange bar - located below the zero mark, indicates that the bearish trend is intensifying
- Yellow bar - located below the zero mark, indicates that the bearish trend is weakening, a possible rollback
Squzee ra display on the MetaTrader chart
- A long position is opened after the indicator draws a blue histogram bar; it is best to open an order immediately after the first closed blue histogram bar. In this case, the possible price movement will be large, and as a result, the possibility of taking a large profit will also be maximum. We set the stop a couple of points lower than the peak minimum extremum; the position should be closed on the first blue bar. It can also be noted that when the first blue bar is formed, you can move the order to breakeven and let the profit grow, but this will be a riskier option
- A short position is opened after the indicator draws a red histogram bar, the opening occurs on the first bar, the stop is set at the local maximum, preferably a couple of points higher, to avoid market noise, the deal is closed when the orange bar changes to yellow.
Jurik PPO Laguerre
We like:
- Accurate forecasting of tops and bottoms on all timeframes.
- Added Jurik Smoothing, which helps eliminate false signals.
- Beginner-friendly and easy to assess market conditions at a glance.
- Extremely versatile.
- Looks good on charts.
Flaws:
- Scalpers often find that extreme signals are few and far between.
- No alerts (yet).
Leading indicator for scalping Extrapolator-sincMA. Download
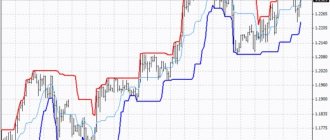
One of the rare indicators, which belongs to the group of leading indicators for scalping, the algorithm was calculated based on the developments of Fourier expansion of functions. Thus, you can see a moving curve near the candle, which will seem to continue the price movement and indicate its possible movement.
Since data from history is taken to calculate this curve, it would not be wise to trade during the release of the most important macroeconomic indicators. In addition, the creators note that on higher intervals the indicator is not as effective as on the one-minute and five-minute charts. Moreover, if in classical technical analysis the proportions say that the higher the interval, the more accurate the signal, then with this indicator the opposite is true, the lower the interval, the more accurate the signals.
leading indicators for scalping Extrapolator
Positions are opened based on the direction of the curve moving average; if the curve draws a parabola upward, then we look for transactions to open long positions; if the parabola of the curve is directed downward, then we look for moments to open a short position.
Chaos Visual Averages
We like:
- Excellent accuracy and ability to predict tops and bottoms even on the smallest time frames.
- Visually pleasing and easy to see market conditions.
- Strong back testing results.
- Alerts.
Flaws:
- Extreme overbought and oversold conditions can cause traders to enter prematurely during strong trends, resulting in drawdowns before the trends finally come to an end.
Indicator for scalping IND Correlation. Download
After installing the tool, a basement window will open, which displays two sliding lines, which are calculated using correlation methods. As we remember, correlation tells how the rate of one quote relates to another quote. To calculate the correlation, the indicator is the average price movement of a financial asset over a certain time period, which is usually calculated in bars or candles. After the correlation values are obtained, they go through the correlation formula and only after that, based on the calculated readings, two moving averages are constructed, which indicate how one quote relates to another.
ind corellation indicator for scalping
In the indicator settings, you can select the leading quote and the trailing one, that is, in fact, you need to select those quotes for which you want to calculate the correlation, for example, Euro/Bucks and Bucks/Swiss Franc are inversely correlated assets.
To open a particular order, you need to understand the approximate correlation component, which can be viewed in the correlation tables. In the classic version, correlation is determined by values from +1 to - 1. Where +1 will mean a strong direct correlation, and -1 a strong inverse correlation.
Hull Moving Average Mountain Histogram
We like:
- Accurate and beginner-friendly trend trading.
- Tried and tested Hull's moving average formula.
- Works very well for swing trading using a multi-timeframe mode (our favorite is the 4-hour MTF displayed on the 30M chart).
- Comes with advanced pricing options, custom widths, average types, and beginner rows.
Flaws:
- Nothing special, other than the fact that this is an often overlooked metric that deserves more confidence.
Let's sum it up
Scalping is considered the most complex method of speculating on stock exchanges and requires a trader to have an excellent understanding of the market, a quick reaction and, of course, a certain psychological preparation. If you are just starting your trading career, then it is best to use medium-term trading strategies.
In general, as for me, it is best to use automatic trading systems for scalping, now I mean trading robots, but this, of course, is my personal subjective opinion.
Adaptive Jurik Filter
We like:
- Djurik's adaptive filter is known as Mrtools' current favorite indicator.
- This indicator works accurately and has proven its ability to extract profits from the market.
- A wide range of options are available.
- Can be used by all traders right out of the box.
Flaws:
- This is an incredible indicator for technical analysts that includes many advanced trading options that can overwhelm new traders. For novice analysts, caution is advised when using advanced tools such as this one.
Color RSI
We like:
- RSI color using the standard 14-period setting.
- A super strong top and bottom indicator that has an extremely high success rate.
- Easy to use for beginners.
- Will give you correct reversal signals 99% of the time on daily, weekly and monthly charts.
- The colored overbought and oversold areas of the oscillator can easily help you in trading and manual testing.
Flaws:
- The RSI is an incredible indicator, but it cannot be used on smaller time frames. The guaranteed best time frames for RSI are daily, weekly and monthly charts.
If you liked the article TOP Forex indicators, share it with your friends, colleagues, and acquaintances on social networks using the buttons below.
| TOP 14 Forex Indicators |
| Download the 14 best proven Forex indicators for MT4 without redrawing. To download files from this category, authorization is required. If you are not registered, please register. | Date File size Downloads | 02.02.2020 1.01 MB 396 | ||
Double ZigZag without redrawing
The classic ZigZag indicator has a controversial reputation among traders. It often gives accurate signals, but at the same time it is often late.
The popularity of this instrument has not passed without a trace. Traders began to improve the indicator in the hope that the signals would be more accurate. Now you can find dozens of different modernized indicators on the Internet, some of them are even sold.
Now I would like to talk about one free version - double Zig-Zag without redrawing. The download link is also below.
He looks a little different. No lines. Dots instead.
The deal is opened after the dot appears. Blue is a downward signal. Orange - for promotion.
Let us note the main drawback that affects almost all types of ZigZag tools - delay. If this is a critical factor for you, you will have to choose from other signals.