Many beginners in trading wonder: is trading on the Forex currency market possible only with the help of indicators? The answer to this question is no. Indicators did not appear with the beginning of trading, but later, and it was possible to earn good amounts even when there were no indicators yet.
There is an opinion that truly experienced and successful traders almost never use technical analysis indicators. The reason for this is the lagging signals that indicators show. In this regard, the most professional trading methods are considered to be strategies that are based on price-forming factors, and not on indicators.
Trading without indicators allows you to make big profits, because the trader watches everything that happens in real time, and not with a time lag, as indicators show.
Using the price chart, you can obtain a sufficient amount of information to make successful, and most importantly, prompt decisions on entering/exiting the market. Moreover, the chart also shows the trend, which makes it possible to predict further price movements. On price charts, you can plot support and resistance levels, within which the value of an asset usually fluctuates. According to the schedule, you can predict the beginning of the purchase/sale of assets by large investors. The chart also allows you to refuse to place stop orders on large positions.
Trading strategies without the use of technical indicators have shown successful results on many Forex market instruments. Indicator-free methods can be used during any trading sessions. They also give an idea of the optimal ratio of profit to risk.
Next we will look at some indicator-free strategies.
Classification of breakdown systems
I don’t say how true this will be, but within the framework of this article, let’s agree to call the type of system a set of different systems that are identical in their basic idea: trend, reversal, breakout. That is, the type of trading system answers the question “What will we trade?” We will call a system class a set of trading systems within one type that use a common approach to finding trading signals. A more appropriate question here is “How will we trade?” So, what classes can there be within this type of system as a breakdown system?
Candles
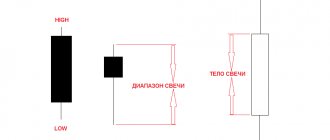
Candles on the chart do not move chaotically. Each candle contains information about the maximum and minimum prices. It is worth considering that one candle is equal to 5 minutes on a 5-minute chart. This means that as many as 5 such candles appear on the minute chart. Approaching important levels, the candles form reversal patterns. Based on these models, you need to build a trading strategy by levels:
- Approaching the maximum level in an uptrend movement, the candles can build the 4 most important patterns for a reversal and generate a sell signal. These are the models.
- When approaching the minimum price level in a downtrend, 4 options for reversal models for buying are possible. The models will be as follows.
So, then everything is simple. We determine the trend, see that the price is close to the marked level, and expect the formation of a pattern. You need to make sure that the same model is formed that will turn the price in the opposite direction. We make a decision to open a deal. It is very important to take into account the fact that when trading on a 5-minute chart when trading using models, we set the expiration period of the transaction to 10–15 minutes, since the formation time of one candle is 5 minutes. Otherwise, there may simply not be enough time to form a new candle.
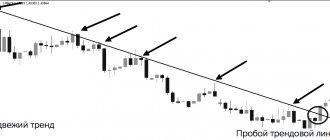
Breakout of the trend line
This is one of the oldest breakout trading models. On a rising trend, a line is drawn along rising lows, on a downward trend, a line is drawn on falling highs. As with all classes of breakout strategies, it works well on the period from H1 and above.
Of course, the market is not always in a trend and you can find a suitable trend line. And even if a directional movement is found, trend ones are quite subjective. Therefore, this class of trading systems is practically untestable - if you repeat the test several times in a manual testing program, for example Forex Tester 3, you will most likely get slightly different results.
There are also quite a few indicators that detect trend lines automatically, but I haven't come across any that do it well.
Martingale strategy
This technique was developed for playing roulette. Its essence is to double each subsequent bet until the moment of winning. Some traders successfully use this strategy, although it is considered very irrational. Let's look at an example. The first purchase is limited to 1 dollar, the next - 2, the third - 4, etc.
As a rule, the third order brings a loss, but in the end there is a profit. The Martingale strategy is especially popular among beginner traders, while professionals use it with caution. For successful trading, important factors are an impressive deposit size and detailed market analysis.
Breakout of support and resistance levels
This class of breakdown systems is also classic and one of the oldest. The entry signal for such a strategy should be not only the fact of a breakout of a certain level or range, but also an analysis of market behavior near the consolidation boundaries. In such strategies, stops are usually set at the last high or low level before the breakout, and profit is taken in the amount of the amplitude of the consolidation range or the previous movement.
There are always support/resistance levels, on any asset and on all timeframes. A true breakout of the level means strong trading momentum, which makes it possible to take profit with minimal risk.
Fibonacci levels can also serve as excellent breakout entry points. I did not separate such systems into a separate class, since these are also just price levels.
As a rule, they wait for the breakdown of such Fibonacci levels as 38.2 and 50. Such a strategy will not necessarily be counter-trend, because levels can also be built based on pullback movements in an existing trend. To determine the basis for building levels, as a rule, the ZigZag indicator is used. It helps to carry out all constructions automatically, thereby avoiding subjectivity.
There are many tools available to build different levels. On the forum in the indicators section you can find indicators of pivot levels of various construction methods: round levels, Murray levels, Fibonacci levels, levels built using Fractals, and others - there are hundreds of them. And this gives a lot of scope for studying the effectiveness of using one or another method of determining levels in order to find the most effective way to construct them for this class of strategies. Perhaps this is where the indicator lies that is ideal for building an advisor based on a system for breaking through support/resistance levels.
Forex breakout strategies and their features
The main idea of breakout trading techniques is that the price moves within a certain range for a certain time, after which a forceful breakthrough necessarily occurs. At this moment, the price breaks through one of the boundaries of the range and reaches a new level. Then the construction of a new price channel begins and the cycle repeats again after some time.
For breakout strategies, it is very important to be able to correctly plot strong price levels and channels on a chart, as well as distinguish a real breakout from a false one. To filter signals, you must be able to correctly determine the main trend of the chart. Therefore, breakout trading techniques work best on volatile currency pairs.
It is recommended to choose a graph interval that is not very low. For example, when trading on TF M1, many breakouts will be false, since there is a lot of market noise on the chart and the price constantly makes unjustified impulse jumps. But on H1, trading will be calmer, and the number of false breakouts will be significantly reduced. We also recommend that you read in more detail about the hourly timeframe on Forex and the rules for trading on it. In the article you will also find examples of other trading techniques for the H1 chart.
Breakout of moving averages
The SMA and EMA lines, especially the standard set with periods of 20, 50, 100, 200, are the strongest price levels, and their breakdown means leaving the average value zone and forming a new trend. In general, there are many ways to calculate moving averages, as our forum member Pavel888 wrote about in this article.
Typically, a signal is generated by a close above the high or below the low of a breakout candle. However, this class of systems in its basic version currently brings quite a lot of false signals - the markets have changed a lot with the advent of such a phenomenon as online trading and with the ability to carry out complex mathematical calculations literally instantly. Therefore, this class of systems, like other classes, began to evolve. But unlike other classes, it has turned into a completely new class of systems - volatility breakdown, which we will talk about a little later.
Despite the fact that this approach is considered outdated, there are a huge number of different moving average indicators, and even if you cannot build a profitable strategy of this class, its development will give you a lot of useful experience. There is a set on the forum, also compiled by Pavel, containing more than 600 different moving average indicators for every taste.
In fact, there is no need to use moving averages specifically. You can easily work with an indicator such as Envelopes, taking buy trades when the upper limit of the indicator is broken and vice versa for sells. In essence, this will remain the same class of trading systems, just slightly modified.
Breakout of the price channel
Historically, trend line breakout patterns have been followed by channel breakout patterns, which are based on support and resistance lines calculated from past highs and lows. The trader buys when prices rise above the high of the last n bars (upper boundary of the channel) and sells when prices fall below the low of the last n bars (lower boundary of the channel). Channel breakout systems are easy to program and very simple to understand. The simplest and most common example of a channel is the Donchian channel:
This channel is built based on the highs and lows of a certain number of bars, in our example the last 60 bars. When this channel is broken out, the market is entered.
The most famous example of a strategy of this class is the Turtle System by Richard Dennis. Like all breakout strategies of this class, it is very simple from an automation point of view, as you were convinced of when you wrote an advisor on this system. However, the basic system showed good results until 90-95 of the last century and without various modifications in the last twenty years it has shown virtually no profit, forcing traders to complicate and improve their trading systems.
As a rule, exits for such systems are made when there is a breakdown in the direction opposite to the open position. In the Turtle system, entries are made when the 60-day Donchian channel is broken through, and exits are made when the 20-day channel is reversed. It is best to place protective stop loss orders linked to volatility, for example, using the ATR indicator. The best results are shown by a coefficient within 2 – 3 ATR, depending on the instrument. An alternative exit from positions linked to the time the transaction is held is also often used. For example, all positions that were opened, say, 30 days ago are closed. This approach helps when the system gets into a sideways movement and hangs around for a long time without a significant increase in profitability.
This class of trading systems is actually profitable if all elements of the system are carefully worked out. The basic concept, as I already said, ended the period of good profitability in the last century.
Another interesting option for constructing a price channel is by session or by range within certain hours. An example of this approach is the BigDog strategy. According to the rules of the strategy, a price channel is determined with a starting point 3 hours before the opening of the London session and an ending point at the opening of the session. Thus, we get the price channel of the morning calm, the breakdown of which we will trade.
The trading system does not show very high efficiency, but, with proper modification, it may well serve as the basis for developing a strategy. To work on it, it is recommended to use a short trailing – within 10-15 points. It is also advisable to try to take trades with channels that do not exceed 20 points in height and completely avoid trading with channels over 50 points.
Another option is to use the highs and lows formed, for example, during the Asian session. This approach is called breaking out the highs/lows of trading sessions. The most profitable can be considered a breakout of the highs and lows of the Asian session.
Another interesting option for building a price channel is using the Ichimoku cloud:
Of course, this is not a holy grail, however, the approach is original, interesting, provides decent accuracy, good profitability and a risk-to-reward ratio. If carefully developed, a trading system using this idea will be able to enter trades at the very beginning of new trends and exit virtually at their completion. I think very few major players use this technique, which is why it remains effective to this day. By the way, the author of this system is the famous Swedish trader and analyst Lars Larsson, who claims that he achieved 80% of profitable transactions when trading binary options from the modified strategy.
The modified version uses filtering of trades using the Awesome Oscillator indicator, but for binary options the number of profitable trades is critical, and not the ratio of profit to loss. Therefore, for Forex, you can do without additional filtering, having carefully thought through the support of transactions, possible profit targets and loss restrictions. To be fair, it is worth noting that the author offers several different options for entering a position - a breakout option, which we have analyzed, and a trend option, based on the reverse intersection of the lines forming the boundaries of the cloud.
The class of systems based on price channel breakouts performs better in tests than all other classes of breakout strategies, despite sometimes not very stable results.
The essence of non-indicator trading
By trading without using indicators, it is possible not to miss anything directly in the present and this is extremely important for making a profit. The fact is that indicators tend to look back to the past or forward to the future, which is not enough for success.
The price chart provides more than enough information to formulate a rational decision within the current framework. Based on the chart, you can not only trade successfully, but also predict changes in the trend. This data can then be used to achieve superior profitability.
In addition to the price chart, you will need to pay attention to volume indicators. Based on this, you can see the levels of support and resistance, and it becomes clear how purchases/sales from major players will occur.
The main strength of working without indicators is interaction with currently relevant information.
By using indicators that analyze information in the past, you can miss the most important things affecting the market at the moment. The essence of non-indicator trading is that it is a highly accurate entry technique that gives a position in profit in a fairly quick time.
With this approach, large stop losses are not used, and the technique itself has proven to be workable for almost all instruments (tested on futures, stocks, etc.).
With its help, a trader can work equally successfully on the Russian, European and American markets. Including strategies without indicators in your Forex trading activities will be most appropriate within ultra-urgent time intervals. This allows you to get the maximum reward to risk ratio.
No. 1 Internal bar or Inside bar
The “Inside Bar” strategy is simple and based on a graphic type figure of the same name. “Inside Bar” is a simple strategic approach without indicators, one of the most optimal options for binary options.
It gives a very reliable indicator to clearly see the moment-signal for making a decision on further actions. This type of figure includes a candle (bar), which is distinguished by the fact that it completely fits into the previous candle (bar). This should include the minimum and maximum (low, hugh) price. Also, such a bar is also called a container bar.
Unfortunately for traders, it is quite rare to see such a figure. Key features of the strategy:
- The graphical representation is simple;
- Output data is indicated explicitly;
- The likelihood of a profitable situation occurring is very high.
In a situation where the current candle displays the 0th index value, and the previous indicator was equal to one, it is necessary for the current bar to take on the appearance of an internal one.
Things to remember:
1. A rising bar (otherwise known as a bullish bar) of the internal type will become a signal to open a long position, following a further pronounced move along the downtrend behind the container falling (bearish) internal bar;
2. A falling inside (or bearish) bar will be an indicator that you need to take a short position, following the container rising bar even when there was a discernible upper trend.
Further, the analysis is carried out as follows: an order is placed to close the transaction at the nearest resistance-support indicator, formed on the basis of the previous trend. Additionally, you should consider the following points regarding Stop loss:
- On long position options it is set to low (min);
- On short ones – high (high).
Break-even trading is inseparable from the ability to correctly set stop loss (“stopping monetary losses”). It is a kind of blocker and loss limiter, as well as the outflow of money from the deposit. At the moment there are 2 main expert opinions:
- Using Stop loss is mandatory for all traders who care about profit;
- Often, using stop loss gives many problems, since it is not possible to clearly determine the volume of the limit amount; changes in the market occur very dynamically.
The “Inside Bar” tactic is one of the trending ones. How else can this strategy be explained: in the case when, after a significant rise or fall in prices, an inside bar is formed, this will tell the trader that there has been a decrease in volatility and there is a temporary “respite” in the movement. The formation of an inside bar occurs at the junction of 2 trends and this should serve as a signal that the market mood has changed.
The movement will soon resume in the direction of the trend. Situations often occur when, after an inside bar has been formed in a situation with horizontal price movement, the trend continues.
No. 2 Pin bar
Pinocchio Bar is the most repeated trading pattern on chart images. Often used by traders in Forex trading without indicators. It is a bar (candlestick) with an extremely short body. Has one shortened and 2nd extended shadow-nose.
This name comes from the name of the tree boy with the long nose from the fairy tale Pinnochio. The “nose” of the candle should be clearly visible against the background of other surrounding bars.
This model was discovered by advisor and financial analyst M. Pring, author of “On Price Models.” The decision to use the term “Pinocchio Bar” (or Pin bar for short) is based on the fact that the key candle of the model is comparable to the nose of a wooden boy from a fairy tale - the longer the nose, the stronger Pinocchio is lying and the greater the signal regarding a trend reversal.
In a situation where the opening and closing of the bar takes place closer to the edge. It is worth noting that the difference between Close and Open prices is not too significant - the body of the bar will be very short.
In an ideal situation, the body of the candle should be within the area of the previous bar. The technical aspect of the Pin Bar is that it is a reversal type pattern. Accordingly, after the appearance of such a model, there is an increased likelihood of a change in terms of price direction.
It is necessary that the change be carried out in the other direction from the “nose”. Those. the elongated shadow is located under the body of the bar. This means that after the shadow closes, the price of the currency instrument will increase.
Otherwise, the “nose” is higher than the body, which means a price reduction can be expected. Regarding the Pin bar strategy, you should know such a thing as a “false” candle - it should be skipped and cannot be interpreted. How does she look:
- The shadow (“nose”) is not clearly defined;
- The body is not located within the previous bar;
- The body is far from one end of the bar;
- The “nose” does not clearly extend beyond the nearest bars.
In Forex trading using Pin bar tactics, many use this pattern on its own, but a much more accurate signal will be received when it occurs within certain conditions. This may include: occurrence at Fibonacci levels, bottoms or tops of trends, moving averages, etc. The signal can be considered clear when the shadow of the candle bounces off the listed lines.
#3 Support and resistance
The Support and Resistance (Su-Re) approach allows you to effectively build strategic steps in Forex. It can be completely classified as non-indicator. Makes it possible to extract 100-200 punds per month when trading on a four-hour chart (USD, EUR).
But the inventors of the approach do not deny the possibility of using auxiliary indicators for those who cannot yet visually determine important points that reflect the state of the market. We are talking about identifying the current trend, graphical markings regarding resistance and support levels.
Trading tactics “Support and Resistance” are based on the horizontal levels of the same name. They are formed by the lows and highs of bars. Breaking through the levels when the moment of consolidation occurs acts as a signal for the trader about the beginning of a trend.
This approach does not require auxiliary indicators (although you will need to draw lines, at least in your imagination). What other features does the approach have:
- Well marked and low Stop loss level;
- Quite a large percentage for profitable positions.
Among the disadvantages are unclear target levels. Conditions with fixed data for support, as well as closing a transaction due to the volatility (often very rapid) of the market can often work against the trader .
Therefore, one of the important points for all strategies is not to accept the rules as unshakable and constantly work to improve the strategy, making it more individual for yourself. How to generate income and what simple sales concepts apply to the Su-Re strategy:
- The signal bar closes below the support line (accordingly, the price must reach to break through the level), the opening of the transaction will be carried out at the opening of the next candle;
- An already open position will be followed based on setting a fixed take profit of 40 pips; upon reaching 45 pips, Stop loss is set at a price equal to the opening of the order and after 80 pips we set it at +20 pips.
Regarding purchases, such a strategy has its own principles. First of all, the price must break through the resistance level in a special way. The signal bar needs to close above the line.
The trade is opened at the opening price of the next bar. Support for an open position is carried out in the same way as described earlier for sales.
No. 4 Martingale system
The Martingale system is one of the most controversial and controversial, and has both its ardent adherents and opponents. Initially, the system was created by a man named Martigues, who lived near Marseille, for roulette players.
The strategy is very simple. Although many do not see the difference between a casino and Forex, the differences are very large and have strategic importance, that is, you cannot use the strategy in the form in which it was intended for playing roulette.
Just like in a casino, in Forex there is a certain factor that helps reduce a trader’s chances of winning (Swap or swap factor). In the case when the bet (position) moves to the next day, the broker takes payment for the use of funds. In some cases, the swap can have a positive value. Then the broker charges a small reward.
Such a system is truly win-win, except for one nuance - the mathematical expectation in the system is zero , that is, playing countless times, the sum of winnings will be equal to the sum of all losses.
In fact, the strategy cannot be called exactly a trading one - it is a betting system that is also applicable to trading. Example of how the strategy works:
- We take a minimum bet of $1;
- If you win, we take it and place a bet again in the minimum amount;
- The strategy works from the first loss - having lost the minimum bet (in our case, $1), the next bet will be $2 (doubled);
- In case of winning, the lost 1 dollar is subtracted from the received amount and the player makes a profit of 1 dollar for the entire series of bets;
- No matter how much bets are doubled, there will still be a win at some point, and the session will be closed in profit.
Why is Martingale so popular in Forex? Its particular demand is mainly among beginners, and most experienced traders are not very good and are cautious about the approach.
But in essence, Martingale as a money management strategy is an irrational system. The approach has one more unpleasant feature - it is poorly suited for profitable trading systems. An important point is the presence of connections between transactions.
Volatility Breakout
Newer and more complex are volatility breakout models, where the points whose crossing triggers a signal are based on volatility boundaries. Volatility boundaries are located at a certain distance from the current price (for example, the closing price), and the distance is determined by the current market volatility: when it rises, the boundaries move further from the current price, when it falls, the boundaries narrow.
Most often, the ATR or Std Dev indicator is used to measure volatility in this class of systems. Thus, to calculate the channel boundaries using the standard deviation, the Bollinger Bands indicator was built, and the Keltner Channel indicator was built for ATR.
The underlying statistical idea is that if the market is moving in a given direction more than expected from a normal swing (as reflected in volatility), then there may be some force involved, i.e. a real trend. Buy when the price rises above the maximum volatility limit, sell when it falls below the lower limit.
Many of this class of systems were very popular in the late 80s, but are now quite rare. Personally, I have never been able to get satisfactory performance from systems in this class, but perhaps I am simply unable to design effective filters to minimize false breakouts. Or maybe the modern market really isn’t suitable for such systems. This assumption is also supported by many market researchers and their independent tests of a class of similar systems for the foreign exchange market.
Pattern 5-0
The 5-0 pattern comes from wave theory. It is a reversal pattern, which consists of five segments, which we will denote in the example below with letters for convenience.
In order for the found model to be close to ideal, the following rules must be observed:
- The starting point O is above A.
- Point B refers to the XA segment at 1.13 - 1.618 Fibonacci.
- C in relation to AB lies at 1.618-2.24.
- AB and CD are approximately the same length.
When point D appears, you can look for an entrance. In the example given, it is a buy entry. For sales, everything is mirrored.
A stop can be placed behind point B, and a profit can be taken when the price reaches the nearest strong resistance or support level, if we are talking about sales.
Breakouts on oscillators
This class of strategies is based on the breakdown of levels in the readings of a particular oscillator. An example of such a strategy is the Rustle of Morning Stars for the H4 period, which is based on a breakdown of the levels of the Awesome Oscillator indicator by Bill Williams.
Another option is a breakdown of overbought/oversold levels:
This example uses a breakout of the 100 and -100 levels of the CCI indicator. A moving average is used to determine the trend and filter trades against it. For this class of strategies, it is not very important which oscillator to choose; what is much more important is the most effective way to determine the direction of the current trend.
The idea here is exactly the same as for all other breakout trading strategies - if the price has broken through the overbought or oversold level, it is very likely that this movement will continue.
To exit a position, as a rule, it is recommended to focus on the reverse crossing of the previously broken level by the oscillator.
Market entry methods
Models based on a breakout may also differ in the method of entering the market. Entry can take place at the open or close of the day, or intraday entry using orders at boundary levels. More sophisticated methods allow you to buy or sell at the border, i.e. try to enter the market on a pullback, when, after breaking through a certain border, prices briefly return to it.
The simplest option - entering at the opening of a new candle, allows you to test breakout systems quite quickly and accurately, because for such options the movements occurring inside the candles of the selected timeframe are not important.
When working with stop or limit orders, it is very important to use tick data and testers that support changes in the spread value during testing, because an inaccuracy of just a couple of tenths of a point can lead to the activation of a pending order or, conversely, to missing certain transactions. At the same time, it does not matter at all for what period the trading system is being developed - it will still be very demanding on the quality of testing and trading results for different brokers may differ radically.
That's why I personally do the following:
That is, after the candles break through a certain level, the strategy involves, for example, placing a pending stop order slightly below the shadow of the breakout candle. Instead of placing an order, I simply start tracking the deferment level and as soon as the candle closes below it, I enter a trade on the market at the opening of a new candle. This eliminates the need for me to use tick data and overall increases the reliability of the system, albeit at the cost of a slightly delayed entry.
Profitable indicator-free strategy “Three Candles”
The Three Candles strategy is based on candlestick chart analysis. It is suitable for those traders who can devote no more than a few hours a day to trading. All work will be carried out on a daily schedule. The currency pair can be any.
Open the selected asset on the D1 chart and analyze the last 3 candles. If they are all bullish and their extreme points are consistently rising, then you can open a buy position. A protective Stop-Loss order should be placed several points below the minimum value of the previous candle. It is better to record profits gradually. As soon as the income reaches 30 points, you need to move the trade to breakeven and add a trailing stop.
A sell transaction is opened under mirror conditions: if three bearish candles with successively lower extremes are observed on the chart, then a sell order can be opened. In this case, the stop loss is set slightly above the high of the previous day’s candle. You can not use take profit, but fix your profit in stages using a trailing stop.
The strategy is considered profitable, since the income from one transaction can be 100 points or more. Moreover, even if any of the transactions turns out to be unprofitable and is closed with a stop loss, the profit from subsequent successful orders will cover all expenses.
What is a true breakdown
There is already a blog article on breakouts and ways to enter trades. The classic definition of a breakout is simple: it is the price crossing a strong price level, after which it is more likely to move in the direction of the breakout than to move back. For a breakout to occur, something serious must happen in the market to move the price some distance.
It turns out that if the price approaches power levels, then four scenarios of behavior are possible:
- A rebound from the level without a real break through the closing of the candle and subsequent reversal;
- A rebound from the level without a real break through the closing of the candle and further consolidation near the level;
- False breakout of a level, when the price returns back after some time;
- A true breakout of a level, when the price consolidates beyond the boundaries of the broken level and continues to move.
It is believed that the more unsuccessful breakout attempts, including false breakouts, occur, the more stable and significant a particular price level is considered, and the greater the market effort required to actually overcome it. For a reliable breakout, at least 2-3 tests are needed on the period from H1 and higher, and the more visible rollbacks, the stronger the impulse towards a new movement.
The following properties are attributed to true breakdown:
- A breakout candle closes above the level in case of an upward breakout and below in the event of a downward breakout;
- It is advisable to have a distance from the level to the closing price greater than the average volatility level. In other words, the price must close above or below the level at a distance no less than the ATR reading with a period, for example, equal to 7;
- It is also desirable that the price stays behind the broken level for 2-3 candles without closing above the level for sales or below for purchases.
A false breakout is considered to be a breakdown by the price of a certain key level, followed by a quick (1-2 candles) reversal in the opposite direction. The concept of a false breakout is directly related to market psychology. This is a manifestation of the “herd” reflex in the market, when small players try to catch the outgoing movement without serious analysis. As a result, buying occurs at the tops and selling at the lows.
Here are several criteria for filtering false breakouts:
- It is advisable to analyze the main trend and key price levels on higher timeframes than for entry. If the medium-term trend continues, and in a short period attempts to break out against the trend are visible, then there is a high probability of ordinary speculation in order to collect stops of market plankton, which constantly opens positions at highs and lows. The longer the analysis period, the more reliable the breakdown will be;
- If the direction of the current breakout attempt in the medium term is the same, then the chances of the “truth” of the breakout are much greater;
- In addition to the fact of the breakout, it is worth analyzing the candlestick patterns that carried out the breakout. A “true” breakout is very often formed by a candle with a large body and small shadows, closed behind a key level. This means that the market is making serious efforts towards a breakout.
No. 6 Bilateral trade
Two-way settings for entering trade are used when there is a need to place orders to enter the market. This may result in doubling the chances of a successful transaction at certain points.
Initially, you will need to overcome your preconceptions about what direction the market will move when viewing a price chart. There is always a chance that the market will move in any direction.
Two-way setups apply both levels to enter the trade. A long position is opened if the price resistance level is broken from above, and a short position is opened from below. Two-way systems will function best when they fit into large cycles that involve price movements in any direction.
ADX Trend Filter
One of the problems with using breakouts is that there is a tendency for extreme sawtooth trading to occur if the system detects a breakout and no real trend follows. One possible solution is to use a trend indicator to filter out breakout signals. Many traders use the popular ADX indicator.
Eliminating markets where there is no trend, “sawtooth” trading and protracted transactions will somewhat improve the results of the system. ADX is used to filter breakouts according to White's research (White, 1993). A trend is considered to exist when ADX, calculated over the last 18 days, reaches a new six-day high. Entries are made only when there is a trend.
But is filtering by ADX really useful? We already clarified this in the article to which I gave a link above. I will only add that for breakout systems, the use of ADX can still slightly improve the final result.
Conclusion
Thus, indicator-free strategies can and should be used. It is important to pay attention to support and resistance levels, market phases, price charts, and candlestick patterns. By refusing to use indicators, a trader begins to better understand events in the market, which allows him to open trades with greater confidence. Such analysis also gives more profit due to the increase in the period of transactions: the analysis is carried out and positions are not closed prematurely.
0
Author of the publication
offline for a long time
Advantages and disadvantages
The disadvantages of breakout systems include the fact that breakout models, like many other models based on trend following, can enter the market with a delay, sometimes so late that the movement has already ended. In addition, a position may be opened on a small price movement that does not allow for profit.
Another hypothetical problem, according to many traders, is that with the widespread availability of high-performance computers, simple methods based on breakouts no longer work well enough. It is believed that due to the widespread popularity of breakout systems, markets have adapted to them, and the effectiveness of the use of breakout vehicles has decreased due to increased price noise near the boundaries where orders of breakout-based systems are placed. This circumstance causes these systems to trigger too often, especially in active markets characterized by high volatility.
The general property of breakout systems is that they work better over long periods and in trending markets. A properly constructed breakout trading system should solve the problem of noise near market entry points.
A separate problem is the width of the channel for the breakout strategy. If the thresholds are set too close to current prices, there will be a large number of false signals, which will lead to sawtooth trading - price noise will trigger orders in one direction or the other. Since such movements do not represent real trends, the trades will, at best, not bring profit, causing a blow to the trader’s capital.
If the boundaries are spread too widely, the system will take too few trades and enter the market too late for any important movement. With the optimal setting of the channel boundaries, a theoretical system based on breakout models can be very effective: frequent and small losses caused by the lack of continuation of the movement or price noise will be compensated by significant profits during large market movements.
To reduce the number of false signals and reduce sawtooth trading, breakout-based systems are sometimes combined with indicators that are supposed to determine the presence or absence of a trend in the market. If there is no trend, then entry signals generated by the system are ignored; if there is a trend, they are accepted for execution. The problem is that the indicators do not always function accurately or do not have time to react quickly enough, lagging behind the market and making the system work imperfectly. Otherwise, any trader using them in combination with a breakout or other trend-following pattern would get rich very quickly, since the trading strategy would only enter significant trends, trading smoothly and steadily.
No. 7 Final strategy without using Price Action indicators
Price Action involves using only price when trading without any indicators. Price movements are read based on patterns and price models.
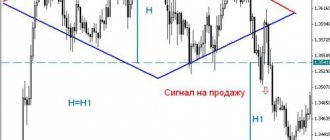
Price movement occurs in a wave-like format. If the movement has started, then the trend in direction remains. When a trader enters a period of small correction, this is an entry point with fairly favorable indicators.
Having looked at the indicators of the graphic data, we connect the base with the vertex. Then you will be able to notice the movement of the trend - first down, and then up. The 1st half of the chart will give entry points for selling when the price moves up, and the 2nd - when it rolls back down.
In the strategic tactics of Price Action, attention is paid to the shadows of the candles. Looks at data on price deviation relative to Open/Close levels. When the shadows are elongated, it becomes clear that the price met resistance and was reversed. This may indicate that the market began to move too rapidly due to dangerous players who influenced such a reversal.