Candlestick patterns and figures are often used to analyze the market. Some of them consist of 2-3 and even 1 bar. Other figures are made up of many candles and appear on the market rarely. But they are the most accurate and allow you to earn profits of hundreds of points. One such pattern is the Diamond pattern. This is exactly what will be discussed in the article.
Diamond figure education
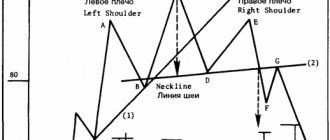
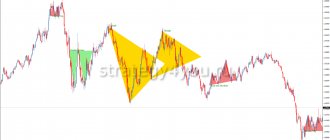
So, the diamond pattern is obtained through a fairly large number of movements. This is a much more complex model compared to Head and Shoulders in terms of its constituent elements. At the same time, the simplest graphical constructions allow you to quickly and accurately determine that the Diamond figure is in front of you, but up to this point what is happening on the chart looks quite unusual. There are two main phases of pattern formation:
- Left half of the model. It forms the end of a trend, but not in the way we are all used to seeing it - an expanding formation appears on the chart. That is, the price follows the trend, say, up, then turns around and corrects. After this, the trend seems to resume and breaks the previous high. Then the downward reversal occurs again and the correction minimum is updated. And again growth with the update of the maximum. This is a rather complex design, at such moments traders often lose money, because the stop for many transactions is placed beyond the nearest extreme, and after the transaction is triggered, they are often turned over and get a stop again. In general, if we see the beginning of expansion, then it is better to just wait - this could be either the beginning of the formation of a diamond shape, or simply chaotic behavior of market participants caused by news or some other factors.
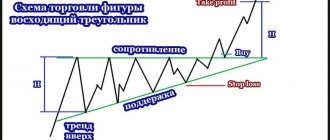
- Right half of the model. It is very similar to the left one, it is also a lot of movements, but each subsequent oscillation is smaller in range than the previous one, that is, the range decreases. In essence, this is an ordinary triangle, which we often see on the chart. The duration of the contraction is often approximately equal to the duration of the expansion, but this is not necessary - there are examples of a short expansion and a very long triangle. In general, this does not in any way affect the development of the Diamond pattern.
Models in different directions of price movement
In order to suggest the formation of a model, it is enough to see 3 consecutive updates of the extremum in the left half. This will allow us to draw formative lines, which will give us a clear picture of the expansion and possible boundaries of fluctuations. It is worth noting that a strong movement right in the middle of the figure, which ends the formation of expansion and begins the formation of contraction, can serve as a good confirmation signal that we are developing the Diamond pattern. It is not always there; it also happens that instead of one such movement there are two, forming a V-shaped turn. It does not affect the model itself; for us, the main thing remains the diamond shape. The number of movements inside the figure can be different - usually it is 4-5 movements in each triangle, but there can be more, or 5 in one and more in the other. The variability is quite large, but the key point lies in the forming lines, and how many fluctuations there were is of secondary importance.
Fundamental conditions
This aerobatics figure means an active struggle between bears and bulls, so there are periods of growth and decline, and optimally these should be periods of equal time. But in reality, the first section is longer.
At the bottom of the market - after a downward trend - sellers are gradually exhausted, that is, we are waiting for an upward move. Bullish trend - the upper range of the market - buyers are weakening, we are waiting for the victory of the bears. Interestingly, it takes more time for a downward reversal to form; according to market psychologists, speculators are much more active in selling than buying.
In any case, the price within the pattern should behave like a compressed spring and periodically return to the central line (volatility line), so that the overall direction of the pattern should be horizontal.
The Diamond figure in all variants is considered unstable and quickly “breaks” due to speculative volatility characteristic of foreign exchange assets.
Where is the Diamond figure formed?
Diamond is usually classified as a reversal pattern, so most often we will see it at the end of a trend. This applies to a greater extent to time frames from hourly and higher. Since the figure itself appears to be a complex structure that outwardly resembles consolidation, the following are identified as the reasons for its formation:
- A major player takes profit on his position. This has no confirmation, but usually the volumes within the Diamond pattern increase greatly, and this always indicates large infusions into the market. Until the first half of the model is formed and the second begins to form, we have no confidence that this is Diamond, so we consider it as a simple consolidation. And in older periods, such consolidations usually precede a trend reversal.
- A major player gains a position. In principle, everything is the same, transactions are directed in the same direction as when taking profits. However, it is quite possible that both processes occur simultaneously or sequentially; we will never know the truth.
Fast and large movement separates the two halves of the pattern
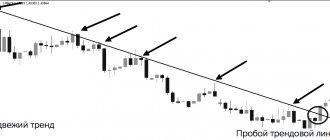
Also, the Diamond pattern can often be found after a very strong and dynamic trend. Usually this is some kind of news movement, but the news is not of local, but rather of global significance, that is, it does not play back literally within a couple of hours. It usually happens like this:
- There is a trend that has been developing relatively calmly.
- It turns out that economic statistics. A publication, press conference or anything else that has a strong impact on the price and it accelerates, sometimes almost vertically.
- Then a trade occurs with the formation of either a consolidation or a Diamond pattern.
- After the end of formation, the trend reverses and now the price is moving in the opposite direction just as dynamically.
It has been noticed that large periods usually give good and accurate signals, while on small periods from one minute to fifteen minutes you can often see a breakout of the diamond in a completely different direction than expected, which is often found in Forex. In this case, the shape itself is simply a coincidence, and the stop was nothing more than a simple consolidation within a short-term trend. In general, it’s not worth looking at short periods; this complex pattern works out poorly in them; it’s mostly fortune telling, not trading.
Such situations are not uncommon, so you should always wait for a breakout in the right direction
Pattern Specifications
Externally, the Diamond looks like a reversal figure of two Triangles, united by common extremes. A prerequisite is the parallelism of the two channels of support/resistance lines. A slight volatility in the zone of boundaries and main extremes does not change the overall picture.
The optimal configuration would be the Diamond pattern, then the time of growth and fall within the pattern is approximately the same. But just as in real diamonds there are stones with defects, the Diamond model on the real market is most often formed as a parallelogram with offset vertices.
Technical analysis requires that the divergent stage be at least three waves, and the second part of the pattern must have two. In real life, such a ratio of waves is obtained extremely rarely, but the principle - compression should be faster than divergence - is always fulfilled. But the more waves are placed in the pattern area, the stronger the movement will be after the breakout. There must be a consolidation zone approximately in the middle.
Trading according to the Diamond pattern
The Diamond figure is one of those few patterns that are traded according to a unique scenario; almost every candlestick pattern gives us a variety of entries, but here everything is quite simple. So, you can enter the market in two ways, which differ little from each other:
- We open a deal immediately after the price breaks through the forming line. The order itself should be placed at a short distance from it, since the breakout may be false, and the price will continue to move up and down within the model for some time. Some use not the generatrix itself, but the nearest extremum, that is, the point where the price previously turned around while it was still inside the diamond. This is not the best option, because the stop size will increase and the take size will decrease.
- We open a deal after the price retests the broken generative line. This is relevant only when the Diamond figure itself formed quite slowly, and before its appearance there was no rapid movement, which was mentioned earlier. In this case, a retest is likely, but it is better to stick to the first option. A retest trades well when a pattern has formed on a chart, say, on a daily scale, and we look at the retest itself on an hourly or half-hour scale. In this case, you can actually enter very well and quickly break even.
Trading using the Diamond pattern
You should not try to enter the market until the forming line is broken. Many traders lost money on this. The fact is that movements inside a rhombus are usually intense and change direction sharply. At the beginning of the day, the price may fall continuously, and by the evening it can return, and nothing will help to recognize this reversal. Those who decide to ignore this advice should understand that in this case they should trade only in the direction of the expected development. And don’t forget that the pattern often looks almost complete and suddenly breaks - the price moves further along the trend, and this diamond-shaped formation remains in the form of a complex correction.
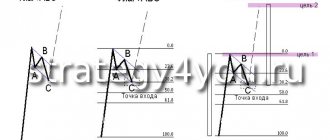
Regardless of how the market was entered, our loss limit is always outside the border of the Diamond pattern itself. The fact is that when there is a breakdown of the generatrix, there can be a sharp rebound and then a powerful movement begins in the opposite direction with a breakdown of the opposite generatrix. This does not mean that the figure is broken, it will just take some more time to complete its formation. But if the extremum is overcome, that is, the price goes further than the border of the diamond, then in this case we can say that the pattern is broken and it is here that it is reasonable to record a loss.
An example of a situation showing the need to place a stop beyond the extremum
Profit can be recorded in different ways. It all depends on the context of the formation of the Diamond figure. Which of the following methods to choose is up to everyone to decide for themselves; over time, sufficient experience will appear and it will be possible to correctly choose from the following:
- Take profit is equal in size to the Diamond range. That is, we measure the distance from the minimum to the maximum and this is the distance we set aside from the breakdown level of the generative line. Here we can draw an analogy with Price Action, where many models trade exactly this way. As a rule, the pattern is worked out to this level and beyond. That is, this is like a minimum goal.
- If the pattern formed after a big movement, then in this case the potential for working out will be much greater than in the previous version. You need to compare the size of the resulting diamond with the movement that preceded it. If it significantly exceeds the model itself, then it is reasonable to use 75-100% of this movement as a guide, that is, in the most favorable scenario, the price will return to where the formation of the last trend movement began before this diamond-shaped consolidation.
In principle, nothing prevents you from combining these methods and taking profits gradually, for example, dividing the entire area of the expected movement into several parts and taking part of the profit at each mark. This will reduce the final result, but at the same time save at least part of the profit if a reversal suddenly occurs. It is also recommended to set breakeven after the price has retested the generatrix or has already moved far enough from it.
Setting a stop loss
A rather important point is to determine the size of the loss limitation. In simple models, the choice is usually small - either for one extreme, or for the second, if there is one. In the case of the diamond pattern, we can have as many as 5 of these extremes. Therefore, here everyone determines for himself, but the best option would be to protect yourself as much as possible and remove the stop behind the central movement in the pattern.
Setting a stop loss when trading a diamond pattern
Also, as an option, you can use the second side of the triangle - the forming line, but not only local punctures are possible, but also more complex formations. That is, at the moment when it seems that the diamond pattern has already formed, the graph will draw a few more fluctuations, changing the overall scale. As a result, it turns out that the technical analysis figure has worked and the stop has been received. Therefore, you should not be greedy; in the long term, without excessive reinvestment and trading in approximately the same volumes, this reversal pattern will bring considerable profit.
I also recommend reading:
Trading in rubles on Forex. Features, factors influencing the USD/RUB exchange rate
Typically, the trading environment discusses the possibilities and prospects for movement in major currency pairs. It is, in general, understandable – [...]
Basic relationships
Formulas are used to solve problems. Diamond is no exception. Relations are used to determine unknown parameters of a figure. However, there are times when one formula is not enough because several components need to be linked into a single calculation process. To use formulas correctly, you should introduce a class of some notation:
- A rhombus is denoted by a set of Latin letters ABCD.
- Equate the sides to a certain number given in the general form: AB = BC = CD = DA = a.
- Diagonals: smaller - m2 and larger = m1. Their intersection point should be designated by the letter P.
- Angles: ∠ABC = ∠ADC and ∠BAD = ∠BCD.
- Characteristics of an inscribed circle: diameter D and radius R.
- Perimeter and area (dimension): P and S respectively.
Perimeter and area
The perimeter of a rhombus is a characteristic that is equivalent to the value of the algebraic sum of all its sides. Area is a parameter of a geometric figure that shows its dimension in a certain geometric space. It should be noted that the value S exists only for a figure in two-dimensional space. In three dimensions, you need to consider the volume of a geometric body. In addition, a volumetric body has a cross-sectional area parameter. This quantity is two-dimensional.
The perimeter is calculated using the following formula: P = 4 * a. It should be noted that the value of a can be expressed through diagonals, area and other characteristics. The basic formula for the area of a rhombus is: S = a * BP = a * DP = a * AP = a * CP. In addition, the dimension can be found using the following relationships:
- S = a 2 * sin (∠ABC) = a 2 * sin (∠BCD) (via the sine of the acute angle).
- S = 2 * a * R.
- S = (m1 * m2) / 2.
- S = (4 * R 2) / sin (∠BAD).
- S = [(m1)^2 * tan (∠BAD / 2)] / 2 = [(m2)^2 * tan (∠ABC / 2)] / 2.
In the last formula, for a larger value of the diagonal m1, the tangent of the acute angle should be taken, and for m2, the tangent of the obtuse angle. You need to pay special attention to this, because at this point beginners make many mistakes, confusing diagonals and angles.
Finding the side
Finding the length of a side is very simple, since mathematicians have performed proofs of some identities. They offer ready-made solutions in the form of formulas that allow you to correctly express one quantity in terms of another and substitute the necessary numerical values:
- a = S / BP = S / DP = S / AP = S / CP.
- a = S^(½) / (sin (∠BAD))^(½).
- a = S / 2 * R.
- a = [(m1)^2 + (m2)^2]^(½) / 2.
- a = P / 4.
It is necessary to note that trigonometric functions are used in some relationships. The last relation is the formula for determining the perimeter. If it is known, then it is easy to calculate the side value using the inverse formula P.
Formula for calculating area
1. By side length and height:
The area of a rhombus (S) is equal to the product of the length of its side and the height drawn to it:
S = a*h
2. By side length and angle
The area of a rhombus is equal to the product of the square of the length of its side and the sine of the angle between the sides:
S = a2*sin α
3. By the lengths of the diagonals
The area of a rhombus is equal to one half of the product of its diagonals.
S = 1/2 * d1 * d2
General information
A rhombus is a quadrilateral. In geometry there are several types of the latter. Each figure has its own relationships, theorems and formulas. In addition, mathematicians identify specialized algorithms that make it possible to accurately and without errors determine the type of figure.
Scientists have developed a learning algorithm that allows you to move on to solving complex mathematical exercises in a short period of time without any financial investment. It consists of the following elements:
- Information about the rhombus: signs, properties and theorems.
- Formulas for finding some parameters.
The study of any figure always begins with its definition, since on this basis basic knowledge arises.
Properties of a rhombus
And you can turn everything around this way. If you accurately determine that this is a rhombus in front of you, then the following properties will be characteristic of this figure:
- The diagonals of a rhombus intersect each other at right angles.
- The diagonals of a rhombus are also the bisectors of its angles.
And there is one more property that helps solve various problems in geometry lessons. It sounds like this:
The sum of the squares of both diagonals of a rhombus is equal to the square of its side multiplied by four.
Perimeter of a rhombus
To determine the perimeter of any quadrilateral, you simply add the lengths of all its sides.
In the case of a rhombus, this is quite simple, since they are all equal to each other. And then the formula for calculating the perimeter is:
As you might guess, the letter “a” here is the length of the side of the rhombus.
There is another formula for calculating the perimeter of a rhombus - through the diagonals. It is more complex, but it may well be useful when solving various problems.