The advantage of intraday trading is the ability to collect the maximum possible number of points that the price of market assets passes during the day, as well as the absence of nervous tension that occurs when holding an open position for several days. However, when trading intraday, it is almost impossible to use fundamental analysis, so the main tool used for forecasting is indicators. In this article, we will look at a number of tools that are used by traders during intraday trading.
Daily schedule: advantages and disadvantages
In trading, everything has its advantages and disadvantages, including daily charts. However, you will find that the disadvantages listed below are not really critical and in many ways they can even be called advantages.
Let's take a look at how trading on the daily time frames can improve your trading. But first, let's remember the words of Ed Seykota:
Constantly looking at charts is like playing roulette. You'll end up spending the entire day playing the game. I only check my charts once a day after the market closes.
You learn to be patient
Patience is a key quality that is necessary for success in trading. If you trade daily charts, you will have to learn patience. This will increase your chances of success and allow you to use only the most reliable and profitable entry points.
You can do your own thing all day long
In trading, you not only have to sacrifice your time, but also put some of your money at risk. When you trade daily charts, you have the whole day free to do your thing and make money. This will allow you not to rely only on trading and diversify your income.
And there is a big plus here: you will be sure that if you fail in trading, you will not sit with your hat in your hands in front of the subway entrance, but will continue to go to your regular job and earn money.
You automatically filter out market noise
During the day, a variety of events can occur that will affect price movement. The daily chart allows you to filter out intraday spikes in volatility and focus only on the closing price of the trading session without being distracted by anything else.
The technical signals and patterns that appear on these higher time frames are much more reliable than the patterns you encounter on lower time frames. In many cases, price movement on lower time frames is simply market noise.
Reliability
The closing price level, which is the result of a full day of struggle between buyers and sellers, is a reliable signal of the current state of the market. When making your trading decisions, you should always pay attention to signals from higher timeframes.
Many novice traders who come to financial markets strive for short-term trading on intraday timeframes. These traders believe that by trading on lower time frames, they have more trading opportunities and thus can make more profits in the long run.
While this type of thinking may sound logical in theory, it is actually just a myth. You must realize the fact that support and resistance levels, chart patterns, price action patterns, indicator signals are much more reliable on higher time frames.
The price movement on the daily chart is smoother and you can usually get a real idea of where the market is heading. This is a little more difficult to do on lower timeframes.
By analyzing the market at the end of the day, you will be able to assess your risk and potential profit with a much higher probability than on an hourly or 15-minute chart. The fluctuations in supply and demand that occur on the daily chart are much more accurate than on lower time frames.
Trade Cost
Your broker's spreads and commissions are the same whether you want to make a trade for a 20 pip profit or a 200 pip profit.
For example, if you want to take a trade on the USDCHF pair and it has a spread of 2 pips, then you will have to pay 10% profit on a take profit of 20 pips versus 1% profit on a take profit of 200 pips. This is a huge difference in cost.
So, if you are a short-term trader, you should not underestimate the cost of spreads and commissions that you will have to pay your broker on an ongoing basis.
You avoid overtrading
Overtrading is one of the main problems traders face. When you use the daily time frame, you focus on the global picture of the market and you don't have to constantly open new trades. You can only choose the best setups.
Some traders are addicted to trading and feel a psychological need to constantly enter and exit the market. It's like an adrenaline rush that they constantly need. Obviously, this can be counterproductive and even lead to the loss of the entire deposit.
There is another type of trader who tends to constantly monitor their positions and analyze charts. These traders are very active and it can be very difficult for them to close a trade. They also tend to be emotional traders who tend to act on intuition.
The best advice I can give to any trader who has difficulty controlling their emotions in the market is to analyze the market only once a day.
You find the strongest trends
When trading, you should always try to take the path of least resistance. This means that if the market is moving in a certain direction, the price will likely continue to move in that direction until factors appear that indicate a reversal.
The daily chart can help you in analyzing the real trends in the market. Typically you will need to view 120-150 candles. This is a ballpark figure that works for my daily strategy for analyzing potential trends.
Here are some simple methods for identifying new and established trends in the market using the daily chart.
Fluctuating Highs and Lows – During an uptrend, the market will make higher highs and lower lows. Conversely, during a downtrend the market will make lower lows and lower highs.
The 50 and 200 period SMAs, the two most commonly viewed moving averages on the daily chart, are the 50 and 200 period simple moving averages. Compare how the price relates to these averages. Watch for moments when price crosses these levels, as this can be a clue to future price movements.
Trend Lines – As simple as they are, trend lines are invaluable when it comes to identifying trends and potential turning points. Be alert to trend line breakouts as this could be an early warning of a reversal.
You only need 15-30 minutes to analyze the market
You don’t have to spend entire trading sessions in front of the monitor and analyze the market in robot mode, which usually leads to its reanalysis. You can easily look at the chart and determine whether there is a signal to enter the market or not, and then place an order to open a trade.
You will be able to use a variety of trading instruments
This is one of those advantages that help diversify risks and, therefore, facilitate capital management.
Possible risks are reduced
Every trader should have a detailed risk management plan. As part of this risk management plan, you should consider factors such as the average risk per trade, the risk-to-reward ratio, how you will handle drawdowns, and the maximum amount of leverage you will use.
Some new traders believe that they cannot trade on daily charts because they would have to place a stop loss at a relatively large pip distance compared to a smaller time frame. They think they will take too much risk relative to the size of their small account.
However, this assumption is completely wrong. Even if the average daily range of a trading instrument is much higher than the hourly or four-hour range, the only thing a trader needs to do in this case is to reduce the position size to accommodate the potentially larger stop loss. And by doing so, you will actually reduce your leverage, which in turn will reduce your overall risk exposure.
Let's illustrate this with an example.
- Scenario A: Long – 1 lot of EURUSD with a 30-point stop ($300 risk).
- Scenario B: Long – 0.2 lots of EURUSD with a stop of 150 points (risk of $300).
Both Scenario A and Scenario B have the same $300 risk, but in A we trade a full lot and in B we use 0.2 lots. So Scenario B uses 1/5 of the leverage of Scenario A.
Now let's say we open each position on Friday and hold it over the weekend. In the new week, EURUSD will open 200 points lower with a large gap.
Well, if that happened, in scenario A we would lose $2,000, but in scenario B we would only lose $400. This is a big difference due to leverage.
Reducing the likelihood of getting into an emotional state
The psychological aspect of trading plays an important role in the overall outcome, which is why so much has been written about trading psychology. By trading on daily charts, you are looking to enter the market with fresh thoughts, which means you increase the likelihood of opening a profitable position.
On higher timeframes you can learn to be more disciplined. Our human factor works against us, especially when we are too active in the markets. The daily chart helps us slow down and helps us trade less.
You have plenty of time to enjoy life
Isn't that why we started trading? It is foolish to deny the fact that almost everyone comes to the stock exchange for the sake of money and financial independence. And chaining yourself to a monitor screen for 8 hours can take away from you what you have been striving for.
To be an effective trader, you don't need to spend your entire day analyzing charts. In fact, trading less frequently and selectively can lead to better results. And as an added bonus, you can also keep your day job so you always have an extra source of income.
What are the disadvantages of daily charts?
- They provide much fewer entry points compared to lower time frames.
- You will need a larger deposit to trade.
- The risks will be greater since your stop losses will be wider.
- Trading will become slow and boring.
However, how significant are these shortcomings? Let's look at some of the most common objections I've heard when it comes to trading higher time frames.
Best Forex indicators for intraday trading
Beginners to the Forex market should study indicators - special programs designed to help traders. Here are the best Forex indicators for intraday trading, which are the easiest to understand. They are used for technical analysis and forecasting, and also help make trading decisions more streamlined.
There are a lot of similar programs, they are divided into several categories:
- Trend - designed for a pronounced trend and are useless during a flat;
- Oscillators are called flat oscillators and work well with sideways movement and weak trends;
- Volume indicators - thanks to statistics, they allow you to interpret the mood of trading participants in the currency pairs market.
Experts do not recommend using more than 2-3 indicators at the same time. There are quite a lot of tools for analysis; let’s name the most understandable and beginner-friendly indicators for intraday trading: Adx crossing, Stochastic, RSI. Perhaps their popularity is explained by the fact that these indicators are among those pre-installed in the popular trading platforms of the largest Forex brokers.
I can't trade the daily chart because...
I constantly hear objections to trading on higher time frames. Here are the most common arguments.
There are too few trading opportunities on the daily charts
No one disputes that there are tons of trading opportunities every day on all time frames. However, how high are they? If they are not quality, then they are not worth the risk.
Any trader who has traded first on lower time frames and then switched to higher ones will tell you that the quality of setups is much more important than their quantity.
My deposit is too small
This argument has long lost its relevance. Thanks to the ability to trade micro-lots, as well as use cent accounts, the daily timeframe has become accessible to everyone.
Although holding each position may take much longer than on lower time frames, it won't take you too long to grow your trading account.
Don't forget, if you lose 50% of your deposit, you will need 100% of the profit to get back to breakeven. By choosing quality over quantity, you protect your capital at the same time.
Stop loss of 100 points? It's too much!
In fact, the distance from your entry point to your stop loss does not matter. Only two things matter: risk-to-reward ratio and position size. A wider stop loss does not mean more risk. In addition, your profit size can be 200, 300 or even 400 points.
You can also change your position size according to your current trading setup.
Trading on the daily chart is boring
In fact, I love boring trading. Trading doesn't have to be exciting. In fact, if your trading isn't boring, you might be doing something wrong.
Achieving consistent results in trading is a constant search for what works consistently, and not for something fast and exciting. To look for such sensations, it is better to go to a casino. If you want to grow as a trader, you need to accept the idea that slow and boring is good.
RSI
The RSI indicator works well in conjunction with a Forex market analysis tool such as Stochastic and complements it. Helps to open positions, taking into account overbought or oversold markets. Will not help determine how long the current trend will continue.
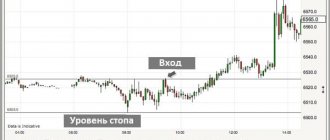
How to trade on the daily chart?
Whether you are a short-term day trader or a medium-term swing trader, you should always pay attention to the daily chart for market analysis. The daily time frame is the most commonly viewed time frame by professional hedge funds, dealing banks, large traders and other large market players that can usually cause major price movements.
The daily forex chart provides the currency trader with an indispensable view of the market from which to build a picture of the long-term direction of the market. This is valuable information that will help you stay on the right side of the market.
Your daily chart analysis will allow you to determine whether there is more buying or selling pressure in the market, and will also help you avoid buying in major resistance areas and selling in major support areas. You should analyze the last few months of price movement on the daily time frame and try to understand:
- Is the market trending? If yes, in what direction?
- Is the market in consolidation? If so, where is the upper and lower range?
- Where will the next higher resistance level be?
- Where will the next lower level of support be?
- Are there any patterns in the graph?
- Is price close to a weekly turning point or an important round number?
- Where is the moving average for the period 50 and 200 relative to the current price?
Make sure that you plot key support and resistance levels at the same time as you go through your checklist. Once you analyze the market based on all these questions, you will be able to trade more confidently and make better trades.
MACD
There is also an oscillating MACD (Moving Average Convergence Divergence) indicator.
It is used like this: the trader looks at whether the lines on the histogram below the price movement chart of the exchange asset are above or below zero. If the lines are above zero for a significant period of time, this signals an uptrend, and vice versa. Accordingly, signals to buy or sell a specific asset are lines crossing zero in the corresponding direction. There are two lines in the MACD indicator – “fast” and “slow”. Their intersections also generate additional signals for transactions. When the fast line crosses the slow line in an upward movement, it is a signal to buy, and vice versa, when this line falls below the slow line and crosses it, traders consider this as a signal to sell.
Market analysis from biggest to smallest
Trading using top-down analysis is something every new trader should do. With this type of analysis, you usually start by looking at higher time frames, such as monthly or weekly charts. And gradually you descend to the younger ones. Only after you have done this can you analyze intraday timeframes.
This multi-time frame approach can help a trader select the best trades and filter out potentially losing trades. One of the most important time periods to consider when analyzing multiple time frames is the daily chart. This is where major market participants do most of their analysis. And this is where you will find the best support and resistance levels.
Most professional traders want to know what is happening on the daily timeframe, no matter what timeframe they are trading on. It doesn't matter if you are a day trader or a swing trader, you should try to trade in the direction of the prevailing trend.
If you only rely on one time frame for trading, you are reducing your chances of a successful outcome to your trade. For example, you may trade a correction that will be short-lived and miss out on strong trends.
Let's discuss, as an example, the possibility of combining the daily chart and using the H4 timeframe. This style of trading fits the definition of swing trading. Swing traders typically hold trades for 2 to 7 days. Swing trading provides traders with ample opportunities to regularly interact with the market while minimizing transaction costs.
You can start by plotting the main levels on the daily chart, including support and resistance levels, trend lines, and Fibonacci levels. You can then zoom out to H4 to analyze price interaction with these levels and find a point to enter the market.
On-Balance Volume (OBV)
Trading volume is a valuable indicator in itself, and OBV allows you to extract even more data.
This indicator measures the cumulative selling/buying pressure by adding volume on days of upward price movements and subtracting volume on days of falling prices. Ideally, volume confirms trends. A rising price usually goes along with a growing trading volume, and vice versa, the volume decreases when it falls.
In the chart below, Netflix shares are rising, as is trading volume. And since OBV did not fall below the trend line, this is a good indicator that the price will continue to rise, especially after small declines.
Read reviews, market analytics and investment ideas on the ITI Capital Telegram channel
Trade like a hedge fund manager
Each of us wants to achieve the same success as George Soros, Bill Lipschutz or Stanley Druckenmiller. However, most traders are depriving themselves of the opportunity to make money by continuing to trade on 5 minute charts, which is the exact opposite of how these great traders trade.
Even if you use 1-hour charts, your trading will still differ from the trading of large companies and market makers. Can you imagine George Soros risking billions of dollars on the 1-hour time frame? How about scalping for 5 minutes?
I am not saying that trading on higher timeframes is the only way to make money in trading. As Jack Schwager once said:
There are millions of ways to make money in the financial markets.
However, this is not about what is possible. It's about what is most realistic. On daily charts, your chances of success will be much higher.
Stochastic Oscillator
The classic indicator - Stochastic Oscillator, is used to determine the current position of the closing price; the averaging period is chosen by the trader. Convenient for short-term trading, as it is more accurate due to taking into account highs and lows. The most accurate results are obtained on the side of the price. In trend areas, it is recommended to use it together with a trend indicator.
Don't reinvent the wheel
If we know that most billionaire market strategists base their decisions on the daily and weekly charts, then why do so many traders continue to use the 5-minute chart?
Perhaps they believe that lower time frames will lead to more trade setups and therefore greater profits? Or do they feel pressure to live up to the image of a trader who must constantly open and close trades?
However, there are always exceptions to the rules. I'm a big proponent of finding a trading style that best suits your personality. Everything you do as a trader should resonate with your personality. If you need a lower time frame and that's the only time you feel comfortable on, then so be it.
But just know that the big money has always been and will always be on the daily and weekly charts.
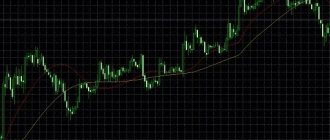
Exponential moving average
“Moving average” is the general name for a group of functions whose values at all points are equal to the average of the original function taken over the previous period. Typically, this type of instrument is used to smooth out short-term price fluctuations and highlight the main trends (cycles, trends). This is especially important in volatile markets.
The Exponential Moving Average allows you to reduce the lag by giving more weight to recent price values compared to more distant prices. This makes it possible to react more effectively to all current changes in value (compared to the standard moving average). The weight given to the last price value directly depends on the period of the moving average: the shorter it is, the more weight the last price has.
So, for example, a 10-period EMA gives the price a weight of 18.18%, a 20-period EMA gives it a weight of 9.25%.
It can be determined by two methods - in the form of a percentage moving average or a periodic one. In the percentage SS, the only parameter is the percentage (weight), in the periodic one, the period.
Basic formula: Here:
- i is the current moment;
- i-1 – previous point in time;
- K – equals 2/(n + 1), where n denotes the period of the average in bars.
Ways to change the period of an exponential moving average:
- By changing the coefficient K itself.
- By changing the moving period - in this case, the coefficient K is considered as 2/(1 + N), N is the set period.
So, for a 10-period EMA the coefficient will be as follows:
The EMA calculation uses all price indicators for the construction period, but over time the influence of old prices decreases and disappears. For shorter EMAs, old prices move away faster. On real charts, the difference between MA and EMA is not too big, but there is.
The exponential moving average more accurately reflects market prices, but tends to react very strongly to changes in value. Traders often use it for short-term trading in order to instantly catch the price. Here the choice is always between sensitivity and the desire to reduce the number of false signals. The more sensitive the indicator, the greater the number of false positives.
An exponential moving average takes a set of data and feeds the average price value, follows the price, works on all time periods. Typically, this indicator is used in combination with other instruments.
The main features of using EMA: use with other indicators and methods of technical analysis, use to determine the current trend and find places to set stop loss. EMAs can also be used as resistance/support zones in order to receive signals after the lines cross.
Example of an EMA strategy - EMA 50 (13 and 4) + Stochastic:
One last question
Are you trading for fun or for profit? Think about it. Trading can turn into a drug and you will feel the need to constantly trade and be in the market. However, this is a dangerous path.
Are you addicted to trading? Once you realize that you are taking too many trades, move to daily charts and limit your trading to a few trades per week.
The purpose of this article is not to dissuade you from using lower time frames. Finding the time frame and trading strategy that best suits your personality and lifestyle is critical to your success.
However, too many traders continue to ignore the daily charts. Most of them think that lower time frames will lead to more trades and higher monthly profits. However, this is far from the truth.
The best traders in the world base their decisions on daily and weekly charts. This gives them the best chance of profiting from the market over a long period.
We all know that approximately 90% of traders cannot make a stable profit. We also know, due to various forums and telegram chats, that most traders are stuck on the 1 hour or 5 minute chart. Is this just a coincidence? I do not think so.
Try switching to a daily chart for one month, start using price action and see your results.
Tools
The main tool that is used to predict intraday price changes are programs that calculate price movements over a certain period and display the result in the form of graphical elements. As input, they use information about the state of the price of a market asset at a certain point in time. These data (opening price (day, hour, week), closing price, average price, as well as maximum and minimum prices) are tied to the analyzed time period. We wrote more about this in the article “The Best Forex Indicators”
There are programs in the trading platform that the broker offers to its clients for conducting transactions, and they are available in almost every platform. In addition to those available within the platform, the trader can use third-party software tools (provided they are adapted for use on a specific platform).
However, it must be said that the range of programs that are built into the trading terminal by default may be quite sufficient for successful intraday trading. Depending on the algorithms with which programs calculate price changes, they can show trading volumes (number of contracts or transaction volumes), direction and strength of the current trend, overbought (oversold) of an asset.