Even the longest trend ends someday. On the chart it looks like a stop followed by a reversal. But how to determine a trend reversal? And the most important thing is to find the place and time of this event. Perhaps this will not be a reversal at all, and not a large pullback or correction of the current trend.
This article presents trading strategies that contain high-quality and high-probability reversal signals (candlestick patterns, models, etc.). With their help, you can make the most of trading trend reversals.
Everyone knows that it is most profitable to trade with the trend. However, what could be more profitable than catching a trend at the very beginning of its emergence?
What is a trend?
A trend involves a tendency for prices to rise or fall over a period of time. There are two types of trend trends - bullish and bearish.
In a bullish trend, the price of the deal makes higher bottoms and higher tops. Thus, the trend line acts as support during a bullish trend.
Bearish trends are opposite to bullish ones. In this case, it creates lower highs and lower lows on the chart. In this case, the bearish trend line can be drawn through the highs.
There are various trend indicators, but one of the simplest and most effective ways to analyze trends is to use trend lines.
A trend line is a diagonal line on a chart that connects several tops or bottoms on a chart. The main function of a trend line is to act as support or resistance for price movement.
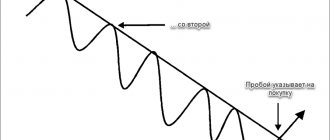
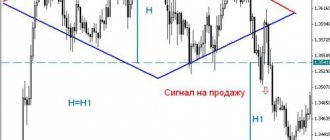
We see a bearish trend line that acts as a resistance line when the price moves down. The arrows point to places where the price tests the trend as resistance. On the seventh interaction of price with a bearish trend, we get a bullish breakout. The price closes above the bearish trend line, implying that the trend is broken and the price direction is likely to change.
In a trending market, there are two types of systematic price movements that are important to understanding the trend. These two types of price movements are called impulses and corrections.
Trend impulse is the price movement that occurs after interacting with a trend line and after the price bounces in the direction of the trend. Trend impulses result in large price movements over a relatively shorter period of time.
Corrective price movements follow the impulse and return the price to the trend. A correction on the chart is not so attractive for trading. Traders without sufficient trading experience should stay out of the market when the price is in a correction phase. The reason for this is that corrections are relatively smaller and often last longer than impulses.
As you can see, the price is making higher highs and higher lows, which indicates that the chart is in a bullish trend. Note that trend impulses result in relatively large price movements in the direction of the trend. The third correction on the chart has approximately the same duration as the last impulse and later leads to a breakout of the trend.
Three phases of the market cycle
The theory presented below will be useful to you and me to better understand the psychology of stock trading, and also be fluent in terminology.
During its movement, the price rate goes through several phases. The ability to see them on charts, combined with an understanding of the processes taking place, opens up excellent opportunities for successful trading.
The material presented below is based on the theory of Charles Dow and the views of professional trader Alexander Wolverin (in particular, I somehow like his formulations better).
Suppose we see the following schematic picture on the chart of a financial instrument.
Let's select phase No. 1.
Before this phase, the market was falling. With any movement, someone necessarily makes money, someone loses. On the previous fall, those bears who opened sideways (let's call it phase 0) made money.
They made very good money on the downtrend and came to the conclusion that it was time to close. The reasons may be different: either you have simply earned a lot, or there are assumptions that good economic news will come out soon and it will become problematic to continue the downward trend.
So, the bears are closing their positions and leaving trading. A strong, assertive tendency weakens. This is noticed by the bulls - traders waiting in the wings to play bullish. They do not know where exactly the fall will stop completely (or they, like the bears, are counting on certain fundamental factors), but they believe that the downward trend has already exhausted itself. The bulls are starting to buy. Active purchases by large players (majority shareholders - we’ll talk about this in the article “Financial Market”) lead to an even greater slowdown of the downward trend, already exsanguinated by the departure of the bears.
The result is that the bearish trend changes to sideways. Phase No. 1 worked perfectly, the desired goal was achieved. The name of this phase for Charles Dow (in the same article about the financial market I will talk about it) is the accumulation phase, for Alexander Wolverin it is primary accumulation.
Fundamental analysis at this time says one thing: “Everything is bad!” If we analyze large time intervals, sideways after a downward trend on the charts coincide with periods of serious crises in the state. By the way, so that you fully understand what we are talking about, take a look at the material “Fundamental Analysis of the Forex Market”.
As the Batman character Harvey Dent said: “The darkest night before the dawn.” Phase No. 2 begins. Dow calls it the participation phase, Alexander Wolverin calls it further accumulation. The criteria for an uptrend are emerging, average traders begin to see it and join in trading on a new bullish trend.
The result is that the bullish trend is strengthening. As a rule, this happens against the backdrop of improving macroeconomic indicators - the state is emerging from the crisis, prosperity begins again, everyone is happy.
The third phase is exhaustion. Professional traders who opened sideways in phase No. 1, as well as middling speculators who traded with the trend, begin to close their positions either against the backdrop of impending fundamental changes, or due to already sufficient profit. However, as we see, the trend does not weaken, but even accelerates before turning sideways.
The reason is this. Analysts on television are beginning to urge the population to buy certain assets, predicting rising prices. As a result, the crowd (which cannot even be classified as average traders) rushes headlong into the pool. People do not understand what they are doing, but they buy a financial asset, succumbing to the awakened thirst for profit.
There are a lot of people, prices are making their last desperate push. At the top of the peak, the bears get to work: they open bearish trades, the crowd’s dreams of getting rich are dashed, a side trend is formed, essentially primary accumulation, but with the goal of reducing the price of a financial asset.
The third phase, or more precisely, the type of behavior of people during the period of its formation, is a very common phenomenon, which even received a separate name - crowd frenzy. History knows many interesting cases. One of these is Russian people and the dollar exchange rate. When the price rose to 70 - 80 rubles, analysts on almost all channels said: “Buy! It will rise again soon!” People lined up and bought dollars. The result was that the currency dropped to 57 rubles, and the crowd was duped.
I highlighted in red a short-term consolidation - a period of desperate struggle for fading hopes, which ended, of course, with the defeat of the masses and the victory of the bears.
We’ll talk about two other similar situations related to tulip bulbs and the cryptocurrency called “bitcoin” in the article about price.
One more moment. Short sideways trends or consolidations within an uptrend are a “position acquisition zone.” Here the bulls are opening a lot of bullish trades, but the trend cannot yet explode upward. You need to gather a lot of speculators who open downside trades from the resistance level (counting on the completion of the current trend and the upcoming price decline), in order to then sharply knock them out, take the money and continue to form an upward trend. The same applies to sideways during a downtrend.
This has two important consequences. First. If the market has been going up and has stalled sideways, it is always easier for it to continue its trend if there is no fundamental or other evidence of an upcoming reversal: you just need to accumulate strength at the expense of amateurs and sweep them out of the way. Smart people, seeing a sideways trend, will not take it as 100% proof of a market reversal (criteria for the formation of an upward/downward trend are needed).
Secondly, a lot of people were trading in the sideways and consolidation zone, there were a lot of Stop Loss there. If the market goes into a correction and approaches the zone of previous consolidation, it can reverse from its middle.
Under what conditions does a sideways trend exit and the previous trend continue or a new trend begin? Conditions vary. Either large players inflate the price and make a “throw out”, or news comes out that pushes the market in a certain direction.
When we get to technical analysis, I will note that at the Stop Loss level when trading in a sideways trend, it is necessary to place pending stop orders so that the market, if it takes you out with a powerful push, opens a position for you in the direction in which it decided to move.
How to find trends?
We already know that an uptrend consists of rising highs and rising lows. A downtrend consists of decreasing highs and lows.
But what if you see a graph that looks like this?
Is this the end of a downtrend and the beginning of an uptrend? Or is the price within a trading range? There is a problem in identifying trends if you use higher highs and lows - it will always be a subjective approach. Therefore, use the 200-period moving average (MA) to accurately determine what the current trend is in the market.
Depending on the timeframe, the market can move in different trends.
Downtrend on the weekly chart.
Uptrend on 4-hour.
It is a mistake to try to trade trends on different time frames. Instead, focus only on the main time frame and trade only on it. However, your trend trading can improve if you analyze charts on different time frames.
Checklist
Below you will find the entire list of tasks that you would like to complete to fully master the topic discussed .
- Open the chart of any trading asset and learn to visually identify upward, downward and sideways trends ;
- Choose the concept of your future trading strategy. Think about how you will trade: with the trend, during a flat period or against the main trend ;
- Determine the time interval on which you will track the trend;
- Choose one way in which you will determine the trend;
- ADX indicator in your trading terminal and learn how to use it to determine market strength;
- Make a rough sketch of your future trading strategy;
- Test your trading methodology on 40-70 transactions, identify shortcomings and begin to eliminate them ;
- Test your strategy again and get ready to work with a real deposit.
Why does trend trading have an advantage?
Trend trading increases the percentage of your winning trades, provides a good risk-to-reward ratio, and can be used on any market and any time frame.
Let's take a graph with points a, b, c, d and e.
Look at the price movement and ask yourself: do you want to buy at points c, d or e? Or enter short at points a or b. You will most likely prefer points c, d or e because one look at the chart makes it clear that long positions will have a better chance of success.
Trends not only increase your chances of profiting from price movements, but also provide an opportunity to enter the market with a good risk-to-reward ratio. Counter-trend movements are always weaker than trend movements, and if you manage to enter at the beginning of a trend or as it continues, you will make a good profit with little risk.
Let's imagine that you set small profit targets, but use a very large stop loss or no stop loss at all. This will result in you taking profits frequently, but a few bad trades will reduce your trading account significantly.
However, if you use a small stop loss and do not limit your profits, you will experience frequent losses. At the same time, just one transaction will be able to compensate you for all the losses you have incurred and bring significant profit.
What types of trends are there?
Most traders believe that a trend consists of higher highs and higher lows. But this is not enough, because trends are different. Some of them are better to trade with breakout strategies, and some are better to enter only on pullbacks. There are three types of trending markets that we will introduce.
Strong trends
Buyers control the price and it is confidently moving up, there is only a slight selling pressure. This type of trend will have small pullbacks - around the 20MA level. In some cases, this type of trend will be so strong that it will move up without any pullbacks.
In this type of trend, it will not be easy to enter corrections, because corrections will be too weak or there will be none at all. Therefore, it would be best to try to catch such a trend at the beginning of its movement and enter it at the breakout. If the trend has already gained strength, you can switch to a smaller time frame and look for entry points on pullbacks already there.
Regular Trends
Buyers still control the price, but sellers are more active. This happens because someone takes profit or enters against the trend. This type of trend will have pullbacks to the 50 MA level.
You can also enter regular trends when the level is broken, but you must be prepared psychologically to withstand a possible strong rollback to the broken level. You can always enter this type of trend later on its pullback to the 50 MA.
Weak trends
Buyers and sellers fight for control, and buyers gradually begin to gain the upper hand. The price will move with large pullbacks outside the 50 MA.
Soon the previous trend may change its direction. Therefore, the best strategy would be to enter the market at support and resistance levels.
PS Answers to the test
- Using a trend line, a trader can project the path that the price will follow in the future. Additionally, it acts as a reference level, which is equivalent to support/resistance.
- A . The line connecting the five lows is much stronger than the one that withstood only two contacts with the price. The greater the number of touches, the higher the value of the level involved .
- B. _ If no price highs or lows are formed over a long period, this means that the chart is enclosed in a fixed price range with a maximum upper and lower point. This consolidation is called flat and indicates a balance between market sellers and buyers.
- A . Two consecutive highs is a classic definition that is typical for an upward trend movement.
Thank you for your attention, that's all for today. Don't forget to subscribe to new articles on my blog and share useful material with your friends . See you again!
If you find an error in the text, please select a piece of text and press Ctrl+Enter. Thanks for helping my blog get better!
Where to set a stop loss in trend trading?
There are three places to logically place stops in trend trading: behind moving averages, behind the previous pullback, and behind dynamic trend lines.
Moving averages
In a market with a strong trend, the price tends not to go beyond the 20 MA. Therefore, you should place your stop loss below the 20MA.
If the trend is calmer and does not go beyond the 50 MA, place a stop behind the 50 MA line.
Previous rollback
You can always place a stop loss under the border of the previous trend retracement.
You can also use trend lines to set a stop.
To avoid false blowouts of your stops, you can use the technique of placing a stop one or two ATRs away from moving averages, the previous pullback or trend lines. Then your possible losses may increase, but your stops will be reliably protected from random price surges.
Features of trend trading
Before you start trend trading, you must first recognize the potential trend. Experienced traders will tell you that “The trend is your friend!” because the rewards from a trending instrument are much greater and such trades may involve less risk. Let's discuss several trading methods for potential chart trends.
As we already know, if the highs and lows of the price are rising, we are in a bullish trend. If the highs and lows decrease, then we are in a bearish trend. In all other cases, we do not have trend conditions.
Every two points on a graph can be connected by a straight line. However, if the third point is on the same line, then we have a trend. Thus, confirmation of a trend usually comes after the price tests the trend on the third touch and bounces off it. When you see a rebound, you can enter the market in an attempt to catch the new trend.
The first two arrows point to the tops of the trend. These are the first two points used to draw the trend line. Now we will sit back and wait for the third price interaction. Next we notice a strong bearish response from the trend line. This will be considered our confirmation of the trend and will prepare us for a short position. The fourth arrow confirms the trend. Thus, the return and rebound from the trend gives us another trading opportunity.
Forex trend lines
So, a trend is the main key to a trader’s success. The basis of the basics in the market! I have already told you earlier how to identify trends using the Price Action method without additional market analysis tools.
Now I will teach you how to determine the Forex trend using trend lines.
It's very simple. Take two values (maximum or minimum) and connect them with one straight line. On the live chart there is a graphical tool called that.
- For an upward movement, a line is drawn below and the minimum values are connected.
- For a downward trend - at the top, that is, we connect two maximums.
The main purpose of trend lines is to determine support and resistance, the price movement channel. A trend is considered stable as long as it is within its limits and bounces off the trend lines in the direction of its continuation. The more price rebounds, the stronger this level and the more difficult it will be to break through in the future. But in the event of a breakdown (which will happen sooner or later), the price breakthrough will be powerful, by a large number of points. This is how experienced traders raise a lot of money in one trade.
Once the price breaks the trend level in the opposite direction, the trend is officially considered over.
I gave a clear example on the live chart. The price remained above its support trend line, periodically bouncing upward from it. I marked the moment of the breakdown with a red arrow. The price breaks the line downwards with a strong jerk and consolidates below. This was followed by a rollback to the former support line, which now began to act as resistance. Well, then the trend changed from upward to downward.
By learning to identify such moments in the market, you can become a successful trader and earn huge money thanks to Forex!
In theory, everything is simple. In reality, it is not always possible to connect two dots so perfectly and get a clear market trend. The more such points, the more stable it is.
And sometimes it can be difficult to find these two points. Everything is simple and clear in the history of quotes. It’s a completely different matter when you monitor the chart online, when the price behaves chaotically, as it pleases. And sometimes there is simply nothing to grab onto! And here a common mistake of beginners appears - they begin to think and complete the drawing, since the Forex trend line should be smooth and beautiful, as shown in the textbook!
The golden rule for constructing trend lines: it is built using two points, and the third confirms it.
In the example in the screenshot above on the Live Chart, the third point acts as a confirmation point.
Now let's talk about the optimal distance at which these lines should be from each other. It depends on the timeframe you choose. And just the subjective opinion of each trader. This all comes with experience, and in the future you will intuitively identify these zones.
One thing I can say for sure! If two such points are too close to each other, then such a trend is not considered reliable.
The angle of inclination also affects! It is believed that the steeper the angle, the less reliable the trend line will be. And even if it is built on points located at fairly ideal distances from each other. It is still not a fact that with such a sharp trend the price will rebound from the level. With strong growth, an equally sharp correction will follow. Therefore, it is better to look for a Forex trend that will be calm and uniform, in the absence of serious events and news on the fundamental background.
Now let's talk about the breakdown. This is the most important part of technical analysis, which signals an upcoming possible trend change. I have already given a vivid example of this above. But there are also false breakouts, after which the price returns to its previous movement channel.
How to recognize this? Only with the help of additional technical analysis tools. And of course - experience! A trader learns throughout his career, constantly learning something new. Because the market itself is developing and does not stand still.
To trade effectively, you should not paint your chart with many lines. I have already given many times unsuccessful examples of beginners who believe that the more indicators they put on the chart, the more accurate the signal will be. Here's an example:
This will not give you anything good except a complete mess in your head! The same applies to drawing Forex trend lines:
How to Effectively Use Trend Lines for Successful Forex Trading
First of all, you need to be patient. If you want to earn extra money as quickly as possible and enter into frequent transactions in order to quickly get easy money, then this is definitely not the place for you. Here you need to learn composure and calmness. Experienced traders can wait several days for a profitable trade. But the result will pay off later!
Train your powers of observation and scrupulousness to better recognize when to open trades when:
- the price bounces off the trend line as support/resistance;
- makes a breakout followed by a trend change;
- a false breakout that ends and the price returns back to its previous channel.
These are the three main strategies you need to learn to trade. And each of them has its own methods for confirming signals. As such, I recommend studying candlestick patterns, graphical analysis figures, technical indicators, Pivot points and lines, Fibonacci and much more. All together this constitutes a huge science called market analysis. Although it is difficult at first, it is very interesting!
When building your strategy, you must pay attention to all the little things, try, test, supplement and remove unnecessary indicators:
- pay attention to which candles were formed during breakouts and in areas of trend levels;
- on what timeframe this happened;
- whether this behavior in the market was accompanied by any news that was published before;
- did you use horizontal support/resistance lines in parallel with trend lines;
- what indicators were used, which ones complement the signals well, and which ones show false ones.
All this makes up the overall trading strategy, which is honed over time and experience. Well, of course, based on your mistakes.
Trends and trading volume
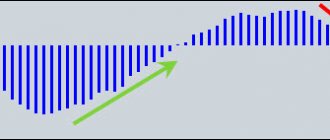
Volumes are useful for identifying new trends. The reason for this is that in many cases the price begins to trend upward after an increase in volumes. Thus, impulsive trend movements appear during high trading volumes. Corrections, on the other hand, appear when trading volumes decrease. When volumes are high, there is a lot of activity in the market. Thus, large volumes provide an indication of emerging impulse waves.
This time you see a volume indicator. Note that trading volumes largely respond to impulses and corrections, as shown by the arrows above. At the same time, when volumes begin to fall, we see that the price enters a consolidation phase, which subsequently leads to a breakout in the bullish trend.
Buy at the lows, sell at the highs
Imagine this situation. You go to a supermarket and see apples on sale for $1 per kilogram. You buy a kilogram of apples at this price. The next day you return to the supermarket and notice that the same apples are selling for $2 per kilogram. Will you buy them this time? Probably not, because the price is too high now. You'd better wait until the price of apples drops and buy pears that day.
How does our example of apples relate to trading? It shows our attitude towards price. That's what I mean.
The price looks too high. Will you buy here?
You raise the market by another 1700 points:
Therefore, the first principle of trend trading is: The price can never be too high to buy or too low to sell.
Follow the price movement
Most of us always want to be right. It's nice to enter trades at the very beginning of a price movement and exit at the end of it. However, in real trading this happens quite rarely. There are many factors that appear that cause you to make mistakes and make wrong decisions.
However, if we persist in being right, it will lead us to fatal trading mistakes such as:
- Refusing to accept losses because you always want to be right.
- Averaging because you think that the price will come back anyway and you will be able to win back your losses.
- Trading on emotions.
Therefore, the best thing to do is to calm down and just follow the price movement.
The resistance level is constantly broken by the price, which makes higher and higher lows. We see an upward trend:
The support level is constantly broken by the price, which makes lower and lower highs. We see a downward trend:
If you notice that the price is making higher lows, the resistance level is constantly being broken, it is most likely an uptrend. You may be looking for an opportunity to open a long position.
If you notice that the price is making lower lows, the constant support level is broken, it is most likely a downtrend. You may be looking for an opportunity to open a short position.
There are different ways to enter the market, and there is no better way to do it. You must find the method that suits you best. For example, you can use moving average crossovers, pullbacks or breakouts. Remember that even the perfect entry point will not make you successful, so do not neglect other important aspects of trading, such as risk management, position sizing, etc.
Risk only part of your capital
Trading with a trend is always a possibility of making a profit or loss. We have to be indifferent to our trades because we don't know which trades will be profitable and which will be losses. However, we want to stay in trading for as long as possible without losing all our money. The only way to do this is to risk a small percentage of our capital on each position.
I would suggest sticking to a risk of 1% of your deposit on each trade. This will give you the opportunity to hold multiple positions open simultaneously in different markets. However, there will be situations when the correlation of markets will increase, and thereby the degree of our risk will increase. For example, during a financial crisis, most indexes will tend to be correlated with each other.
Let's imagine the following situation. Your trading strategy is successful 50% of the time and has a risk to reward ratio of 1 to 2. You then end up with four losses and four winning trades.
If you risk 30% of your capital, on the 4th trade you will lose your entire deposit (-30 -30 -30 -30 = -120%).
But if you risk 1% of your capital, you will receive a return of 4% (-1 -1 -1 -1 +2 +2 +2 +2 = 4%)
Having a winning trading strategy without proper risk management will set you up for failure.
Also, do not forget that you will have to earn much more than you lose in order to restore your trading deposit to its previous level.
Before you open a trade, you must know where you will exit it if you make a mistake in the direction of movement. There is no need to sit out losses and watch the price move against you until a margin call occurs.
The only way to make money is to make more profits than losses. That's why we should always get rid of bad deals.
It should be noted that the larger your stop loss, the greater the possible profit, and also the less likely you are to be thrown out of the market by a false move. However, we always err on the side of reducing position size in order to maintain a reasonable risk-to-reward ratio.
You can also use the atr indicator to set a stop loss.
What timeframe to work on
See the direction of the market on the time interval in which your trading strategy is being implemented.
| Duration of the transaction | Timeframe |
| From one month | H4-D |
| From one week | H1 - H4 |
| A day or more | M15 - H1 |
| Less than a day | M5 - M15 |
| Less than 1 hour | M1 |
For a more detailed explanation of this circuit, see the video.
Exercise
Determine the time interval on which you will track the trend.
Don't limit your profits
When trading with a trend, it is best to use a trailing stop technique to take as much profit as possible from the entire price movement.
If we exited the trade at the support level, we would have missed the subsequent move:
Trailing stop gives us the opportunity to take maximum profit:
Ways to rearrange stop loss:
- Based on the moving average.
- Based on price structure.
- By ATR value.
The hardest thing in trend trading is to have enough patience. Because price will often pull back against your position, and you will need to resist the fear of losing your profit and not closing your trade.
There will be situations when a small profit turns into a loss. But you must remember: although your percentage of winning trades will not be that high, the possible profits can be very large.
Trade on all markets
In trend trading, we only make money when there is a trend in the market. However, statistically, markets are in a range most of the time. Therefore, in order to provide our trading system with as many options as possible, we need to trade in different markets using a variety of instruments.
You should follow different markets such as indices, bonds, currencies, energy, metals, agriculture, stocks. Care should be taken to balance your focus across different assets. We should not focus too much on one market and pay less attention to others. For example, we could keep the same number of assets in each market sector. For example, 7 currencies, 7 stocks and 7 indices.
For example, in the first half of 2014, most currencies traded within a 500 pip range and volatility was very low:
However, there were strong trends in other markets at that time:
Trading in different markets will help you reduce losses and increase profits.
Oscillators
The Relative Strength Index (RSI) oscillator is a measure of the price movement of a financial instrument over a specific time period, which is used to compare changes that occurred during a specific period of time in the past. On this basis, the index takes a value of 1-100. The higher the number, the higher the relative strength.
The RSI index is used by many traders to assess whether a given instrument is overbought or oversold. If the index goes up faster than in the previous period, the RSI increases. RSI above 70 is an overbought signal. And if the indicator goes down faster than in the previous period, the RSI will fall. A reading below the 30 level indicates an oversold signal.
RSI itself does not give specific signals to buy or sell, but it does suggest that a trend reversal should occur in the case of this instrument. When the RSI is outside the oversold level and moves lower, it is usually a signal that the market will reverse. The same is true in the other direction.
Market sentiment is also very important. An overbought level in the market means that the uptrend has exhausted itself and is about to reverse. The same goes for oversold levels.
In conclusion, before trading trend reversals , start with a thorough market analysis. Most securities and currencies trade under a variety of market conditions, which include trends, consolidations, and high or low volatility. If you're trying to determine when a reversal will occur, give yourself a checklist that analyzes patterns, patterns, oscillators, and sentiment before taking any action.
Different approaches to trend trading
Trend trading can be divided into two approaches:
- System trading.
- Discretionary trading.
System trading
System trading clearly defines all the rules that you must follow in your trading: entry point, profit location, risk management and trade management.
Most of these actions can be automated by building automated models that will be based on technical analysis with limited intervention by the trader. This approach is widely used by large hedge funds.
The trader can only determine the level of risk and the markets in which to trade.
Discretionary trading
Discretionary trading has less clear rules that a trader must follow. This approach requires constant participation in transactions and is widely used by individual traders. Although discretionary trading is more subjective, it is still based on a trading plan.
Further actions
Select the financial market in which you will try to make money and select a reliable brokerage firm . For Forex traders I recommend Amarkets , for users who have chosen a stock exchange - Just2Trade.
| Company | Just2trade | United Traders | BKS | Tinkoff investments |
| Minimum deposit | From $100 | $300 | from 50,000 rub. | Unlimited, you can even buy 1 share, they recommend starting from RUB 30,000. |
| Commission per cycle (buy + sell trade) | 0.006 USD per share (min. 1.5 USD), 0.25 USD for each application. that is, per lap – $3.50 | “Beginner” tariff – $0.02 per share Average $4 per round | At the “Investor” tariff – 0.1% of the transaction amount, at the “Trader” tariff it is reduced to 0.015% | 0.3% for the “Investor” tariff |
| Additional charges | The ROX platform will cost at least $39/month. (for the American market), for an additional $34.50 they connect Canada/TSE, Level II On the over-the-counter market, the additional fee is 0.75% of the transaction volume (minimum $30), in the case of dividends - 3% from the issuer (minimum $3) | On the Day Trader tariff, they charge $60/month for the Aurora platform, free on other plans | If the account has less than 30,000 rubles - 300 rubles/month. for access to QUIK and 200 rub./month. for access to the mobile version of QUIK, | — |
| Account maintenance cost | $5/€5/350 rub. reduced by the amount of the commission paid | — | 0 RUR/ month on the “Investor” tariff. On other tariffs, funds are debited only if there was activity on the account this month | Free for the "Investor" tariff |
| Leverage | for Forex Up to 1 to 500 for stocks up to 1 to 20 (day) to 1 to 5 (night) | 1 to 20 on the Day Trader tariff, this is the maximum leverage (daily) | Calculated for each share, within the range of 1 to 2 – 1 to 5 | Calculated for different instruments, the calculation is linked to the risk rate |
| Margin call | -90% | Standard -30% of the deposit, in technical terms. support can be set -80% | Calculated based on the risk for each security | Depends on the asset |
| Trading terminals | MetaTrader5, ROX | Aurora, Sterling Trader, Fusion, Laser Trader, Volfix.Net, Pair Trader | My broker, QUIK, WebQUIK, mobile QUIK, MetaTrader5 | The purchase of shares is implemented like an online store, professional software is not used |
| Available markets for trading | Forex, American, European and other stock markets, cryptocurrency | American and other stock markets, more than 10,000 assets in total, cryptocurrency | Foreign exchange, stock, commodity markets, there is access to foreign exchanges | American and Russian stock markets |
| License | CySEC | Lightweight license from the Central Bank of the Russian Federation | TSB RF | TSB RF |
| Open an account | Open an account | Open an account | Open an account |
Check out more related articles . You can start with these:
Stock trading for beginners; Japanese candles for beginners; 10 techniques for candlestick analysis.
Trend Trading Strategy
Trading strategy for trend trading is only 1/3 of your success. Without proper risk management and discipline, even the best trading strategy will not help you trade profitably.
To develop a trend trading strategy for ourselves, we will have to answer the following questions:
- What time frame will I use?
- What will be my risk level on each trade?
- What markets will I trade in?
- Where will my entry point be?
- Where will I exit if the price goes against my position?
- Where will I take profit if the price goes in my direction?
In practice it will look something like this:
- If the price is above the 200 period moving average, the trend is up.
- In an uptrend, we expect two price touches in the area between the moving averages with periods of 20 and 50.
- We open a long trade on the third test.
- The stop loss will be placed 2 ATR from our entry point.
- If the price goes in your favor, the trade will be closed when the price closes outside the 50 MA.
Here are some examples:
An alternative option for trend trading:
- If 50 ema is above 100 ema, we look for an opportunity to open a long trade.
- We wait until the price closes above the 50-day high.
- If the price closes above the 50-day high, we open a trade on the next candle.
- Stop loss is placed at a distance of 3 ATR from the last price high.
Never move a stop loss against your position. Trade as many low-correlation markets as possible. Risk no more than 1% of your capital on each trade.
Trading on pullbacks: how to enter the market following the trend?
A pullback is a short-term price movement against the trend.
What are the advantages and disadvantages of trading on pullbacks? The pullback gives us a good entry point with a good risk-to-reward ratio. However, we may miss a strong trend because sometimes trends move for a long time without pullbacks. We also trade against the current price momentum.
Since most trading instruments remain within a range or consolidation phase most of the time, and market trends occur only about 20 to 30 percent of the time, finding an established trend and a good retracement can be challenging.
As a trader who trades pullbacks, you must act like a sniper. You need to wait, then wait some more, sometimes hours if not days, before entering the market. You need to find an entry point where price is likely to resume its movement along the prevailing trend.
Here are three basic steps you need to take to successfully trade trend pullbacks:
- Identify an existing trend.
- Identify potential reversal areas or market conditions where price may resume trending.
- Find a high quality trading signal to enter the market that offers a high risk to reward ratio.
Rollbacks and trend trading
You've probably heard the wise axiom “trend is your friend.” However, professional traders also know that a trend is your friend “until it ends.”
Most of the time, financial markets remain in equilibrium, where major market participants have access to all major news events and information. As a result, the price fluctuates a little throughout the day, but in the absence of any new information, it usually does not make a particularly strong directional move.
However, after important news is released, if the actual data diverges from the market consensus, we may see sharp price movements because here the market tries to interpret the new information to find a new equilibrium.
Bulls and bears sometimes have a unique interpretation of news data, and they put their money where their mouth is. When a majority of market participants, or even a few large institutional players, believe that the price should rise or fall, such an imbalance in supply and demand can lead to sharp increases or decreases in prices.
You can see pullbacks approaching the previous consolidation zone and serving as price turning points on the chart. Often pullbacks test the previous level of support and resistance. Since traders know that these levels previously acted as support zones, a large number of pending orders accumulate around these price levels.
As a result, when a pullback reaches these price levels, and if there were enough orders in the market in the direction of the trend, the market resumes its movement. Otherwise, support or resistance levels will be violated, and the market may experience a trend reversal.
While identifying a trend can be relatively easy, measuring the likelihood of a trend continuing after a pullback is a little more difficult. However, it is entirely possible if you apply the right technical analysis tools and have a comprehensive strategy for trading pullbacks.
For most new traders, it is best to trade pullbacks rather than look for counter-trend trading opportunities.
What is a rollback?
It is impossible to predict 100% when the pullback will end. However, the rollback must be based on something. He can't just hang in the air. It can be:
A previous resistance level that has turned into support.
Support that became resistance.
Dynamic trend lines.
We receive confirmation to enter a trade when the candle closes in the direction of the current trend. This increases the positive probability of our trade.
However, sometimes this can cause you to miss a good trend move.
Therefore, there is no clear answer: wait for the confirmation candle or not.
- If the price is above the 200 EMA, the trend is bullish.
- Wait for the price to return to the support area.
- Next, expect a bullish candle to appear in the direction of the trend.
- Place your stop loss below the low of the reversal candle.
- Take profit at the nearest level.
The best entry points will be called structural - these are places where several conditions for entering a trade will coincide.
The price approached the resistance level, which previously acted as support. Price concerns dynamic trend lines. A bearish pin bar appears.
The price touches a strong support level. The 200 EMA also takes place at this location. An absorption pattern emerges.
The more structural factors that come together in one place on the chart, the greater the likelihood of getting a profitable trade. However, the number of such setups with all structural factors will be quite small. Therefore, it would be best to find a balance and enter the market in the presence of 2 to 4 structural factors.
Trend trading strategy on pullbacks
The first step is to recognize the trend. If the price makes higher highs and higher lows, then we are seeing an uptrend. On the other hand, if the price makes lower highs and lower lows, we are seeing a downtrend. You can also use two moving averages and confirm the trend when they cross, and also use them to confirm a pullback.
The instrument is in an upward trend. By adding two moving averages, the 13-period EMA and the 21-period EMA, we can get further confirmation. When the fast EMA crossed the slow one, we could see a pullback. However, remember that moving average crossovers act as a lagging indicator. By the time it generates a signal, the market may have moved slightly in the direction of the prevailing trend.
As a result, the reward-to-risk ratio of your trade may also decrease. Therefore, it would be much better if you tried to identify a potential reversal area during a pullback and place your trades using more effective market entry methods based on price action signals.
One of the main principles of technical analysis is the fact that old resistance turns into new support, and old support turns into new resistance. Using this principle, you can quickly determine where the market might turn during a pullback.
Old support and resistance levels provide an excellent place to place your limit orders on the side of the prevailing trend.
You can also use another time-tested login method. In this case, I mean using the major Fibonacci retracement levels.
After the first upward swing, the price retraced to the 23.6% Fibonacci level and then resumed its upward trend. After the completion of the second upward swing, the price rolled back to the 38.2% Fibonacci retracement level, after which the trend resumed. Major Fibonacci levels act as hidden support and resistance zones in the market.
Once you have learned to successfully identify a trend, a pullback, and the potential area where the pullback may end, you can look for an entry point into the market.
A simple pin bar or outside bar near previous support or resistance, or near a moving average, can serve as excellent confirmation that the pullback is ending and the trend is about to resume.
The crossing of the moving average and the downward trend line confirm that the market is in a downward trend. Once the downtrend was confirmed, you could determine that the 1.5750 level acted as significant resistance as the price bounced off this level several times. However, instead of blindly entering the market near the reversal, we waited for a bearish pin bar to appear, which confirmed the end of the pullback.
Technical analysis figures indicating a trend change
The most noticeable and probable are the following technical analysis figures:
- head and shoulders,
- double top and double bottom,
- triple top and triple bottom,
- rounded top and rounded bottom,
- V / inverted V.
Head and shoulders
One of the most popular forms of trend reversal is head and shoulders. Its name comes from the shape, which takes time. You can see the left shoulder, head and right shoulder and when the figure is formed. Once the so-called “Neck Line” is broken, we can say that the trend has changed. The neck acts here as a support line, the intersection of which confirms the downward trend.
While a head and shoulders formation most often occurs before the end of an uptrend, an inverted head and shoulders formation promises the end of a downtrend. Here, the formation of a head and shoulders pattern signifies price consolidation at the very end of the trend. This pattern occurs primarily when the market fluctuates, causing variable market conditions that eventually lead to the formation of a reversal.
Learn more about how to trade the Head and Shoulders pattern.
Double top/double bottom
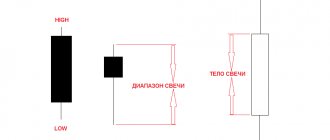
These formations are quite common on charts. Double tops are shaped like the letter M, and double bottoms are shaped like the letter W. However, recognizing them requires experience in chart analysis, and inexperienced traders can make mistakes. During a double top formation, prices rise rapidly with increasing volume, followed by an equally rapid decline accompanied by falling volume.
Then there is another increase, and prices reach a level close to the first peak. The volume here is less than at the first peak. The next stage is a sharp drop in prices. If the price clearly breaks the level set by the first low, then we can talk about the formation of a double top. During this breakout, volume increases significantly. The figure formed in this way promises to reverse the previous upward trend.
The mirror image of the double top pattern is a double bottom. This is a preview of the change from a downward trend to an upward trend
Triple top/triple bottom.
These formations differ from double top or bottom formations in that they contain an additional third extreme. They are similar to a head and shoulders figure, which can lead to differences of opinion among analysts. They differ from head and shoulders in that all the peaks or bases are at the same level. Volume is lower at each peak and increases at the moment of breakout after the third peak of the line defined by the rebound points.
V figure / inverted V
It is most difficult to identify technical analysis patterns during their formation. Formation V is also referred to as a single bottom or single top. They appear when there is a strong uptrend or downtrend and are associated with a rapid change in the opposite direction. V occurs when there is a strong buying impulse following a sharp decline. Prices are rising rapidly, creating a second formation lever. An inverted V formation occurs when the market stalls on the high day of an uptrend and heavy selling occurs.
It should be noted that the angles of each of the arms in the V and inverted V are the same.
Changes in the trend of the figure are also well shown:
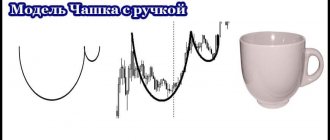
- Cup and inverted cup(cap).
- Pattern 2B
- Closing Price Reversal Pattern
Trend trading strategy using the MACD indicator, trend line and volume indicator
The MACD indicator consists of two moving average lines that interact with each other above and below the 0 level. When the faster line breaks the slower line in a bearish direction while above 0, we expect the price to start trending in a bearish direction. When the faster line breaks the slower line in a bullish direction while below 0, we expect the price to start rising in a bullish direction.
MACD also has a histogram. This histogram displays the exact difference between the fast and slow lines.
If the histogram is positive, then the faster line is above the slow line - a long signal. If the histogram is negative, then the faster line is below the slow line - a short signal.
Divergence is also good for identifying the discrepancy between price and indicator. If the price increases and the MACD decreases, then we have a bearish divergence, which indicates that the trend is likely to reverse. The same holds true in the opposite direction for the bullish divergence pattern. If the price decreases and the MACD increases, then we have a bullish divergence.
One way to trade trends is to combine trend lines, MACD and a volume indicator.
We can try to match the signals from the MACD indicator and a potential emerging trend line and perform a volume analysis. Imagine that on the chart you see the price moving upward. At the same time, the MACD is signaling a bullish cross below 0, which confirms that the price is rising. In this case, we can expect continuation until we see an opposite signal from the MACD.
The stop loss should be placed below the recent swing low.
The same technique works for bearish trends. If price begins to price lower tops and lower bottoms, we use a bearish MACD crossover above 0 to enter a short position.
The chart starts with a bullish MACD crossover. Note that during the crossover and continuation thereafter, the price is in a range. However, during a horizontal movement, trading volumes constantly increase. Suddenly the price makes a higher top, breaking the level of the previous top. This indicates a possible increase in price, and after a short correction there is an opportunity to open a long position.
The price continues to rise with two impulse movements and corresponding corrections. The MACD indicator is now positioned in its upper area, indicating that we may see the end of this bullish trend soon. However, the position should be held until the MACD lines show a bearish crossover as specified in the trading strategy.
What should a newbie do?
Start trading market pullbacks and follow the trend. Once you learn how to make money this way, you can expand and use more complex algorithms. Until this moment, forget about exoticism and all adventurous experiments .
Next, we will look at an example of a simple strategy , the logic of which is based on timely entry after the end of the price correction.
Preparatory part
- Choose any asset you like;
- Set a four-hour timeframe;
- Add two indicators to the chart: Bollinger bands and ADX .
Schedule after completing all preparatory steps:
Purchase
- The price is located in the interval between the upper and middle Bollinger bands;
- The main ADX line is rising;
- The price made a correction to the middle Bollinger Band and formed a “ Bullish Engulfing ” candlestick pattern;
- We buy on a new four-hour candle;
- Stop Loss is set in the range of 60-100 points, Take Profit is 3-5 times more than Stop Loss;
- We do not invest more than 3% of the account into one position .
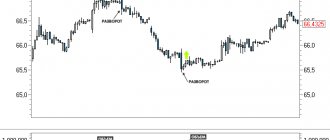
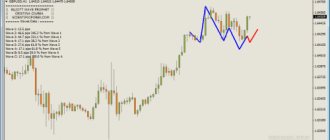
Here is the four-hour timeframe of the GBP/USD pair. After entering the trade, we set Stop Loss at 90 points , and Take Profit was 270 points
Sale
- The price is located in the interval between the lower and middle Bollinger bands;
- The main ADX line is rising;
- The price made a correction to the middle Bollinger Band and formed a Bearish Engulfing ;
- We buy on a new four-hour candle;
- Stop Loss is set in the range of 60-100 points, Take Profit is 3-5 times more than Stop Loss;
- We do not invest more than 3% of the account in one position.
Here is a four-hour timeframe for the GBP/USD . After entering the trade, we set Stop Loss at 80 points , and Take Profit was 240 points
Exercise
Test your trading methodology , identify shortcomings and work on eliminating them .