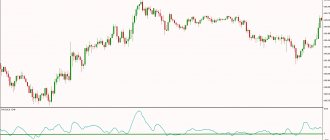
The ROC indicator is a technical analysis indicator belonging to the class of oscillators. It shows the rate of price change over a certain time period (n-periods). As you know, technical analysis of financial instruments is based on the fact that the market always has cyclical nature. At first glance, it may seem that the charts are unique and to some extent this is true, however, if uniqueness were truly an integral and the only sign of price changes, not a single indicator would give a profit to the trader. Any trading instrument - currency pairs, stocks, options and futures - always changes its value in a certain way. This happens due to the nature of financial markets. There is always a struggle between sellers and buyers. Prices change greatly when one or another prevails over rivals, and this in turn gives rise to patterns that are tracked and can be used through technical analysis.
The ROC indicator is a clever oscillator; it quite accurately shows optimism/pessimism in the market. Like any other indicator of the family, it can be used in several ways: to analyze divergences, to track “breakouts” of signal levels directly on the indicator chart. If there is an increase in the ROC oscillator, this means that the bulls are dominant in the market, if the bears are falling. Accordingly, a strong motivation for a transaction can be a situation when, for example, there is a trend in the market, and the ROC indicator gives a signal in the same direction. Would you say this is how all oscillators work? Yes, you are right, but there is a difference, and a significant one. Due to the nature (formula) of the rate of price change, the ROC indicator can also signal the strength of market participants. If we see a strong slope in the roc indicator chart, this indicates a stronger sentiment for the corresponding type of market participants. That is, when working with the ROC indicator, you can conduct a more accurate and comprehensive analysis, which will allow you to earn more.
Another important feature of the ROC indicator is that it can be used on any time frame, up to the minute. The value of the ROC indicator is calculated as the difference between the closing price of the current candle and the candle for several periods before. The roc indicator is a leading indicator, that is, it signals a future movement a little earlier than its actual start. Of course, you shouldn’t think that this is the grail, now you won’t make mistakes. No. This will not happen, because no one can cancel false signals. Any indicator makes mistakes, that's normal. It is important to understand the principles of its operation and, based on them, to build a trading system with a special algorithm for opening transactions, in which the signals will be confirmed in one way or another by other methods of analysis. Therefore, when working using the ROC indicator, do not rush into entering positions, look for additional confirming signals. In addition, remember one more rule: the shorter the ROC indicator period and the smaller the working timeframe, the more false signals there are. Increasing the scale of trading reduces the number of bad trades.
What are info indicators and what are they?
Information indicators are a separate group of technical Forex indicators; they do not directly help in making a decision to buy, sell an asset or exit a transaction. They have a slightly different task. Info indicators provide the trader with all the necessary information on the trading instrument, account status (profit or loss in points, percentages, deposit currency, drawdown), opening and closing times of trading sessions, time until the current candle closes, data on the spread, swap, and so on - in a word - everything that is necessary for comfortable work in the financial markets. It is inconvenient to process this, without exaggeration, colossal information flow of various data in your mind, and it is not necessary - there are a huge number of helpers. We will get to know them today.
This review covers the following types of information indicators:
- Time indicators;
- News indicators;
- Profit indicators;
- Lot calculation indicators;
- Spread and swap indicators;
- Candlestick indicators of higher time frames;
- Information panels;
- Other useful indicators.
They are all relevant for the MetaTrader4 terminal, installed according to standard instructions, most of the files are open source - especially for programmers and all those who like to see how indicators are written. You can download all the indicators from the link at the end of the article, the attachments are in one folder, there are hundreds of items. Well, in fact, it’s simply not physically possible to write and say about everything, all the information indicators - be sure to look at the topic on the forum (link at the end of the article) - there are many more pictures and descriptions of all the useful little things for MT4.
Money management
How to increase profits in trading is only part of the job of a market player. It is in solving this issue that novice traders plunge headlong into the solution without thinking about the budget planning strategy.
Meanwhile, getting positive statistics on your own transactions is the first thing a professional should think about. In most cases, financial market professionals are already thinking about how to save money and ensure a constant, stable income. Using capital wisely and not being left without funds is much more important than one-time successful transactions. Money management is something that a novice trader should accustom himself to.
Money management in binary options is competent capital management, a set of rules, the application of which will minimize risks and maximize profits. Proper management of personal funds has always been considered the key to successful trading in any market.
Money management rules
Minimum bets
When participating in trades, bet the minimum possible amount on an option. Do not transfer the entire deposit and you will be able to continue trading if unsuccessful.
Minimum deposit
When mastering the possibilities of trading, determine for yourself the financial range that you can spend and transfer a minimum of funds to the deposit. It should not be large sums and certainly not your last money. So, in the event of an unsuccessful transaction, you will still have a free cash reserve, which will allow you to continue playing.
Minimum funds
When starting your first steps in binary options trading, do not place all your funds in one trade. This should be no more than 5% of the deposit. You must always have funds available to continue trading. In addition, trust your funds to the broker who guarantees you the best profitability. Remember to minimize losses and do not spend more than planned.
Minimum assets
When trading, do not participate in all possible tradable assets at once. The more transactions, the greater the load on your deposit and the greater the likelihood that you won’t even notice that there will be no funds left. As you gradually explore market opportunities, start with two or three assets and then increase their number. Try yourself in stocks, futures, get acquainted with the stock market.
Minimum emotions
When plunging into trading, do not forget about your emotions: do not give in to emotions and the desire to master everything at once. Trading is not a lottery, but serious work. After three trades, stop trading, remember the risks and have a sober mind. Remember the statistics of the rule of three: all it takes is three failed trades and you will start to panic and try to recover the lost funds.
Money management is your reliable strategy and your closest path to success in binary options trading!
Time indicators
“Time is money,” Benjamin Franklin, one of the founding fathers of the United States, once said. Time is one of the most valuable resources - it is constantly in short supply, it cannot be replenished, it can only be used. In trading, time is one of the most fundamental things - since after opening a position, regardless of the working time frame and strategy, you need to wait for the result - either the position will be closed by a stop order, or the price will go in our direction and you will make a profit. Moreover, the wait can be from several minutes (if you are a scalper) to several months (if you work on D1 or a higher timeframe).
There are a huge number of indicators that show/count time: from various time bars (they count the time until the candle closes) to session ones. The latter will be relevant for intraday traders: as a rule, most strategies are designed for some kind of trend movements, and they do not exist around the clock, but usually when the London and American sessions are in progress. In turn, the time of the Asian session - when market movements are minimal - is used for other trading strategies, as well as for a great variety of advisors - night scalpers. Below are several examples of such indicators.
b-clock_TRO_MODIFIED_VERSION – a simple indicator that shows the time until the candle closes.
iStockTimes_v1_5 – a whole panel where not only time, but also spread, swap, ATR.
Time Universal ( Time Universal_fix ) – the indicator shows the closing time of the candle you need – it will not change the data when switching timeframes. In addition, the font, color and size are selected by the user. Time Universal_fix mod has everything too, but is installed in the basement of any other indicator.
i-Sessions-A is one of the many session indicators. Each new version has additional functions, for example, this one – tracking movement (in points) for each session.
Xi-AsianSession - the indicator specializes in displaying only the Asian session, when market movements are minimal - a paradise for all kinds of night scalpers. I will only say that there are many such modifications; there are also indicators for both the London and American sessions.
The most famous indicators of this type: Candle Time and Spread , Forex Market Hours GMT , i-Sessions , Market Hours , Xi-AsianSession .
News indicators
“There is some time left before the news comes out” - this information can be seen on the websites of many brokers. Indeed, sometimes very important news comes out that the movement of an instrument is reversed and this trend lasts for months. For those who trade intraday, following the news using economic calendars or special indicators is fundamentally important. Agree, opening five minutes before the decision on the Fed or ECB interest rate with a short stop of 10 points is stupid: even if you guess the direction of the news impulse, the widening spread will most likely close your position where there is no price.
FFCal is undoubtedly one of the most famous newsmakers; its review is on the website. In general, there are over a dozen modifications of this indicator, and other news indicators are also written on its basis - which can be downloaded from the link at the end of the article.
NewsInfo is a very fundamental and multifunctional news indicator. In one of the versions it is possible to choose one of four (!) Forex news provider sites. Another trend has been observed recently: news indicators not only show news, but also have additional functionality to disable advisors whose work may be damaged by news volatility.
Truly News Indicator – a feature of the indicator is that you can choose to display news for certain currencies (that is, if you trade GBPJPY, then you don’t need news for USDCNH), as well as select the value of the news (high, medium, low), what will be displayed on the information board. In addition, news candles are marked with flags on the chart - very convenient. We have a detailed review of the indicator on our website.
One more nuance with setting up news indicators.
A). Typically, a trader learns about upcoming news from the economic calendar. Since everyone lives in different parts of the planet and everywhere has its own time, you need to determine the correct local time of news release - the news appears only once. As a rule, all calendars have a time zone setting - both the popular English-language calendar from ForexFactory and the calendar from our website.
b). Next, we need to check whether the time of the news is true or not. It is better to take important news (decision on interest rates, speech by the heads of the Central Bank) - when there may be some significant movement in the market. We look at the time before the news on the calendar, we look at the time before the news on the indicator - the latter either show the time of release, or count down the time until the news, they can also mark the place of release on the chart itself with arrows, flags, lines, inscriptions, lines with inscriptions - which Any trader can have settings here. Everything is adjustable and selectable.
V). And at the moment the news comes out, you will see an atypically large M1 candle on the chart (if you were looking at the minute timeframe), you will see a strong spread widening (if the account has a floating spread - this is what most traders have), the more special the spread indicator will be able to measure and record that your broker learned about Non-Farm Employment Change. And when everything coincides - the economic calendar, your news indicator and the fact that the news is released in local time - you have done everything right. We remember these settings, or even better, save the corresponding template. Most indicators automatically determine everything correctly, but you don’t need to rely only on the indicator - it doesn’t hurt to check (so as not to open by mistake five minutes before Non-Farm). If it so happens that the news came out and the market collapsed, and your indicator only shows the event an hour later, you need to change some parameters in the settings of the indicator itself (some kind of Offset Hours - called differently in different indicators) and everything will be fine.
The most famous indicators of this type: FFCal , NewsInfo , Truly News Indicator , Urdala_News .
Description
The acceleration oscillator is a logical continuation of the Awesome Oscillator indicator and is calculated on its basis. According to Bill Williams, the price of a financial instrument before a reversal or correction reduces its rate of growth/decline.
First, the rate of change in quotes slows down (this is evidenced by the leading AO indicator), and only then does the price reverse. The AC in Williams' trading strategy is an even more subtle tool that measures the acceleration of the rate of price change.
Accelerator Oscillator is calculated using the formula: AC = AO - SMA(AO,5). Where AO is Awesome Oscillator, and SMA(AO,5) is a simple moving average with a period of 5, calculated based on AO.
Awesome Oscillator, in turn, represents the difference between 2 simple moving averages: fast and slow. The first is taken with a period of 5, and the second - with 34. In this case, the average price for the period is used for calculations (the maximum and minimum of the candles are added and divided by 2).
- Example of the MMSA strategy:
Profit indicators
Based on the results of completed transactions, it is fundamentally important to know trading statistics: how many profitable transactions, how many unprofitable ones; profit/loss in points, percentage, deposit currency, and so on. Trading statistics are everything. Of course, services like Myfxbook help traders a lot, but in this case you need to go to a third-party site (sometimes they also freeze) and wait for the data to be updated. And with the use of statistical indicators, we will receive all the information we are interested in right in the terminal - here and now, quickly.
i-Profit is one of the most popular indicators for recording profit/loss in points and percentages; it is discussed in detail on our website. Due to its popularity, there are a considerable number of its modifications (all of them can be downloaded from the link at the end of the article).
Equity – the indicator builds a line of increase/decrease of the deposit right in the basement of the instrument chart. Essentially everything there is the same as in Myfxbook monitoring. For example, if you use trading without stops and with averaging, here, just like on Myfxbook, we will see a divergence between the equity and balance lines (in the jargon of traders, “snot”).
Let's consider another case - on one account, trading was carried out by an advisor and hands. As a result, we have a lot of transactions and it is not clear who got what result, who traded better - a robot or a person. In this case, you need to separately count orders opened manually and expert orders. This can be done in this way - each order has a magic number (Magic Number) - for those opened manually it is usually 0 (zero), for those opened by robots - some number, for example 2222 (you can see it in the advisor settings). In an indicator, for example ProfitInfo v1.5.2 – in the screenshot below –
we select a filter by magic number (the top line of settings; mark -1 means that the indicator takes into account absolutely all orders) and it will only count those orders that have the Magic we are interested in. Or you can view/count orders for a specific comment (second line of settings from the top). When opening a position manually through the “Open order” tab of the terminal, you can write your comment, or you don’t have to do this. But advisors, as a rule, always write their comments on orders. Again, the expert’s comment can be viewed in the settings. In addition, all comments to orders can be seen in the account history - to do this, right-click on any field and check the box next to “Comment”. Next, we enter the comment we are interested in into the indicator - and it will show the result in points and percentages only for those orders that have the comment we are interested in.
The most famous indicators of this type: Equity , i-Profit , Stats_Indicator , TradeHistory .
Lot calculation indicators
As you know, money management in Forex is half the success. Despite the fact that hundreds of books and thousands of articles have been written on this issue, many trading participants continue to lose deposits due to inadequate MM. Moreover, the majority fully understands that risks of 5-10-15% per transaction can easily deprive you of your deposit. Indicators for calculating a lot are designed to help the trader in determining the adequate amount of risk relative to the size of the deposit and the size of stop orders. In addition to the established risk in percentage, you should not forget about such a phenomenon as slippage - stop orders can be executed one point worse, and you will lose a little more (and if your stop hits a gap or news, then it can be executed in 2-3 times more than what you set). The market is unfair, remember that.
lot calculator – indicator for calculating the lot size relative to the stop order. Its position can be changed at the corners of the graph. In the settings, we indicate the stop size in points and the risk in percentage - the indicator does the calculation itself - it will calculate the lot size, indicate the price of one point for such a lot and calculate the potential loss - if the transaction is unsuccessful. You can choose the font color and size.
MAX_LOT – the indicator calculates the maximum lot for one transaction (as they joke on our forum - the risk is “for the whole cutlet”), taking into account the size of the leverage. You can set any leverage in the settings - the data will be recalculated.
The most well-known indicators of this type: #Lot , #Depot Risk , lot calculator , MaxLot , MoneyManagement .
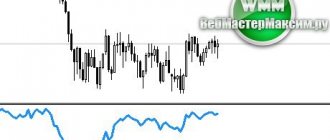
Price Rate of Change indicator parameters
Rate of Price Change
You can configure the period and calculation method of the indicator. Do not touch the calculation method (UsePercent), if you change it, the essence will change. ROC will turn into another indicator with different features, you don’t need that. RPeriod – can be adjusted, but it is recommended to use values from 12 to 15. If you take larger values, the indicator will also lose a significant part of its properties.
Spread and swap indicators
Monitoring the size of the spread (the difference between the purchase and sale prices) for intraday traders and M1/M5 scalpers is fundamentally important. For them, the lower this value, the better. The size of the spread (which can be fixed or floating) depends on the type of account and the market situation. In general, it is worth knowing when spreads are especially large and intraday traders should not get into the market at these moments (this does not apply to those traders who trade on D1 - there stops and profits are measured in hundreds of points and there is no point in worrying about 2 or 8 points of spread):
- on Monday in the first minutes when the market opens;
- on Friday in the last minutes before the market closes;
- when moving from one day to another - every day;
- important news (decisions on interest rates of the Central Bank, speeches by the heads of the Central Bank and presidents of some countries, and so on);
- force majeure situations like Brexit or the fall of Chief.
The rest of the time, the spread, as brokers state in trading conditions for ECN/NDD/STP accounts, can be almost zero, or within half a point (using the example of the well-known EURUSD pair).
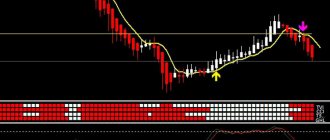
IND Monitoring – the indicator displays the spread in the form of a histogram. Here you can see, especially in the news, how the buying and selling prices vary for a specific instrument.
In the example above, in addition to the indicated indicator (in the basement), two spread indicators are installed to measure it online. As you can see from the histogram and huge M1 candles, important news was released on the EURUSD pair and the spread was greatly expanded by the broker.
CandleSpread_modern – the indicator, in addition to the spread value, also shows the time until the candle closes. Among the features - in the settings you can set a certain spread threshold (top line of settings), above which the reading indicator will display in red (the color can also be selected) - a very useful function for intraday traders - a kind of red traffic light - the spread is large - you shouldn’t get into the market (and sometimes this happens). Everything is customizable here - font size/color/name.
There are many spread indicators. Some of them display a fixed numerical value online, others display the readings in the form of a basement histogram - i.e. You can look at the history of what spreads the broker gives intraday, on different types of accounts, on different instruments, and compare spreads from different brokers. I even put together a TS Spread Monitoring tool for this purpose. There are also indicators that write all this information to a file - it can be useful when testing some advisors.
Swap is a fee for transferring a position within 24 hours. First of all, such information may be relevant for long-term traders who hold a position for several days or weeks - as a result, the amount of accruals can be a pleasant plus to the transaction amount (if it is positive for your position). The swap can be positive or negative; as a rule, in the middle of the week it is charged in triple size (for example, in Alpari the triple swap day is Wednesday). Information about swaps can be found on the broker’s website in the specifications for the trading instrument; you can right-click on the instrument in your MT4 terminal and select “Specifications” and look there. Well, you can just use the profile indicator.
ZFXiSwap – the indicator shows swaps (and more) for several instruments at once.
spread swap – spread and swap, simple and no frills.
The most famous indicators of this type: Candle Time & Spread , Candle_Spread , IND Monitoring , Spread History , spread swap .
Installation procedure
Both AO and AC are present in any MT4 or MT5 terminal, as well as on the trading platforms of many brokers. Adding them to the chart is quite simple:
- Login to the terminal.
- Go to the "Insert" menu.
- Click "Indicators".
- Select "Bill Williams".
- Select the appropriate oscillators.
If you add instruments on a live chart, the sequence of actions is as follows:
- Click on the icon on the top panel.
- Select Awesome Oscillator (the AC indicator is not presented in this list).
- Add it to the chart.
On the Internet you can download both basic and modified versions of these indicators with alerts - sound and graphic signals about a possible trend change. You can focus on them as auxiliary signs. However, you should definitely wait for other signals. In case of contradiction, it is not recommended to enter the market.
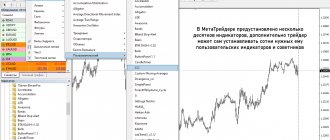
For reference : To add a downloaded indicator, you need to copy it to the “Indicators” folder. You can find it in the “File” section, then in “Open data directory”, as shown in the figure. Then you need to enter “MQL4” or “MQL5”, depending on the terminal version.
Candlestick indicators of higher time frames
Many strategies require checking the situation on a higher time frame before opening a trade - as you know, the longer the time frame, the stronger and better the signal. But if you have several currency pairs in your work, and open two or even three charts with different time intervals and periodically switch between them, it will be quite inconvenient. But there is a solution - indicators have long been developed that can show charts of candles and bars from different instruments and time frames on the main working chart - where you open positions.
stratman-minichart is one of the most famous, discussed in detail on our website. I can only say that the indicator is quite popular and there are many different modifications of it, but in terms of functionality and management they are similar and you will not have any problems with the settings.
MultiInstrument - the indicator right in the window of your instrument will show the chart of the instrument that you type in the settings (in the example below, the EURAUD pair is shown on the GBPUSD chart). Comfortable.
MCP Multi Charts - this indicator will be located in the basement window and show several charts of different currencies at once, indicating OHLC prices - open, high, low, close...
There are also modifications where, in addition to showing other instruments, you can use some technical indicators - not just the USDJPY pair on the pound chart, but also framed by some moving averages or together with the Parabolic indicator. In a word, the trader has a huge choice here.
The most famous indicators of this type: stratman-minichart , OverLayChart , MultiInstrument , MultiCharts .
Trading system
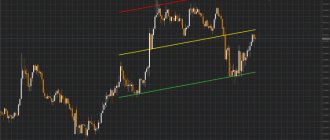
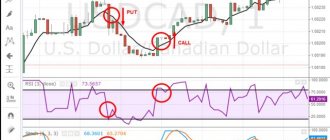
There are several ways to trade ROC:
1. When crossing signal levels 1 or 100 from top to bottom or vice versa, open positions in the direction of the trend;
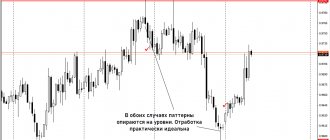
2. If the market is in a horizontal corridor, then open positions when the upper or lower border of the channel is reached in the opposite direction, when ROC signals that it is time;
3. If you see a divergence between the Price Rate of Change and the price chart.
Information panels
For those who do not want to clutter the chart with several information indicators, information panels have been created - where all the necessary work data is in one window, everything is regulated and configured. Thus, one indicator replaces several at once. There are a huge number of information panels, we will look at a couple of them here.
P4L Clock – this panel contains time, spread, ADR and much more. The peculiarity of the indicator is that literally every line can be turned on/off - this way we leave only what we need. There is no point in talking about placing another indicator in any part of the chart or in any basement - it’s all implemented here.
Infopanel TSLS_mod is a very simple and unpretentious panel - in one window we have spread, swap, current time and information about leverage.
The most famous indicators of this type: Bid_View2.0 , i-NASA , infoboard , InfoPanel , Stat Informer .
Expiration
Expiration of binary options (from English Expiration) is the end of the transaction, which will result in the fulfillment of obligations: in the case of a positive outcome of the transaction, the broker transfers funds to the market participant. The role of expiration in trading is great: the income and success of the transaction will depend on this. Binary options have become so popular because you can make money within 60 seconds.
Which expiration to choose is up to you each time: indices or commodities are suitable for short-term trading; for stocks, choose a week as the end date of the transaction; for currency trading - transactions from an hour to a month.
Types of binary options depending on expiration:
Short-term – options whose expiration date is less than an hour. They are very popular among beginners in trading and have a high degree of risk, since it is difficult to predict market movements.
Long-term – options whose expiration period is longer: from a week to more than a month. Popular with professionals because... Before determining expiration, it is first necessary to conduct a detailed analysis of the dynamics of the asset, take into account the economic situation, and other factors that may influence changes in market trends.
Is it possible to extend the expiration of options?
Not all brokers allow you to change the expiration date. Extension of expiration dates is possible only in the direction of its increase. To extend expiration, you need to deposit the remaining funds from the option cost.
Expiration rules:
1. If you are new to trading, when participating in a trade, try to choose a longer expiration.
2. Choose a broker carefully, preferring the platform where it is possible to increase expiration. This way, in case of failure, you can minimize your losses.
3. If you need quick income, choose short-term (from a minute to several hours) expiration for options trading. Don't forget about the risks.
4. If you are interested in stable income, choose long-term expiration for trading. So, in case of a positive outcome, you will be guaranteed high profitability.
Expiration in Accelerator Oscillator strategies
Trading when there is a signal for a rise or fall in prices
In this case, the expiration date can be selected depending on your experience and trading purpose: both short-term (scalping) and long-term.
Short-term trading : more like a lottery, in a short period of time (60 seconds) it is difficult to predict price dynamics, the result is always unpredictable. Recommended expiration : from 5 minutes to 1 hour. This way, you will have time to trace the dynamics of the trend; this is a good and reliable time period that guarantees the movement of the asset in the predicted direction. Expiration more than an hour : you can not only analyze the behavior of the price over a similar period of time, predict the behavior of the price depending on the news, economic and political situation.
Trading on signals below and above zero
Short-term expiration : acceptable, but unpredictable. Both losses and gains are possible. Recommended expiration : 1 hour. The ability to more accurately predict the outcome of a transaction and get a good income. Expiration more than 1 hour : will allow you to accurately determine the price movement; for this, the trader studies the price dynamics, considers touches and returns. With this approach, the bidder can expect good profitability.
Trading using the Alligator strategy
The strategy will allow you to determine in advance the emergence of a trend and price dynamics in the future. At this time, you need to participate in trade. The Accelerator Oscillator and Alligator oscillators are used. A signal to buy a CALL from AC - if the candle closes above the lips of the Alligator - the green line. A signal to buy a PUT from AC is when the candle closes below the red Alligator line.
Short-term expiration : acceptable, but random and unpredictable. Both losses and gains are possible. Recommended expiration : from 1 minute to several days. Thus, the outcome of a transaction can be predicted by studying the behavior of oscillators in previous periods, observing the economic situation, and trend dynamics. Long-term expiration : more than a week. An option for professional traders who have the necessary experience in analysis in conditions of sensitivity to market fluctuations. A good profitability awaits the bidder.
Trading using three indicators
A simple strategy will help you identify buy/sell signals for PUT and CALL options. Consists of three indicators: Awesome Oscillator, Accelerator Oscillator and Parabolic SAR. Buying an option occurs when all indicators show a signal on the same candle.
Short-term expiration : acceptable, but random and unpredictable. Both losses and gains are possible. Recommended expiration : from 1 hour to a four-hour period. An excellent opportunity to observe the movement of the trend, the market situation and get an accurate signal. Long-term expiration : also recommended for trading in this strategy. You will need general market knowledge, analytical skills, and increased profitability.
Stochastic + Awesome + Accelerator Oscillator trading strategy
For trading you will need Awesome (AO), Accelerator (AS) and Stochastic oscillators. All three tools allow you to provide a clear understanding of trends and determine entry/exit points. Stochastic shows oversold-overbought levels. Awesome shows trend states in the market, when Awesome and Accelerator are the same color, this is a signal of a strong trend.
Short-term trading : since it resembles a lottery, the result will be unpredictable, the profitability will be low. Recommended expiration : from 30 minutes to 4 hours. This is a fairly comfortable period of time to see the dynamics of the trend and predict the correct movement of the asset in the predicted direction. Long-term expiration : possible, requires experience and knowledge. You can not only analyze price behavior, but also predict price behavior depending on the news, economic and political situation.
Trading strategy HMA + Awesome + Accelerator Oscillator
A very simple and effective strategy. Three indicators are used: HMA, Awesome Oscillator and Accelerator Oscillator. Buying a CALL option : HMA – line growth, color changes from red to green; Awesome Oscillator - green color; Accelerator Oscillator - green color. Selling a PUT option : The HMA line changes from green to red; Awesome Oscillator - red color; Accelerator Oscillator - red color.
Short-term expiration : acceptable, but characterized by high risks. Both losses and gains are possible. Profitability is low. Recommended expiration : from 1 hour to several days. Thus, the outcome of a transaction can be predicted by analyzing the behavior of oscillators in previous periods, the economic situation, and the presence of hot news. Long-term expiration : more than a week. An option for professional traders who have positive experience in market analysis. A good profitability awaits the bidder.
To test all expiration options in practice, we recommend using the Finmax broker platform; to do this, just go to finmaxbo.com. The advantage of this platform is that you have a choice of expiration from 30 seconds to six months . Here you can not only check the strategies listed in the review, but also find your favorite one among them and get a stable income.
Various useful indicators
In addition to the indicators discussed above, there are many useful goodies that one way or another can be useful to a trader in his work. For example:
Truly ScreenShot Indicator 1.35 is a screenshot indicator, which is discussed in detail in one of the materials on the site. No one will argue that sometimes it is very important to take a screenshot of the screen - to capture your transaction, maybe to record some mistake of the broker on an excessively large spread, and so on. There can be many situations. Another advantage is that there is no need to install third-party programs on the computer, configure them, or search for the folder where the screenshot is saved. All the work here is the same as with a regular indicator. In addition, this indicator can take screenshots automatically with a certain user-specified algorithm - i.e. Even manual intervention is not required, everything will be done as specified by the trader.
i-SignalOfTrade – the indicator informs the trader about all events on the trading account (for example, you have subscribed to signals and want to control the copying/trading process so that the manager does not drain your deposit). Firstly, it catches any trading event, any trading operation on your account: opening positions, placing orders, modifying stops and takes, partial and complete closing of positions, triggering a stop/take. Secondly, the indicator displays event information in five different ways.
i-UrovenZero (and various modifications) is a very useful indicator for those trading grids and locks manually, it shows all the necessary information on the account and open positions, break-even, stop-out and complete withdrawal of the deposit levels. Perhaps it will save someone from big losses.
CandleBodySize (and various modifications) – the indicator calculates the size of the candle in points. Due to its popularity in certain strategies, many mods have been made and various additional functions have been added.
i-Breakeven (and various modifications) – the indicator shows the breakeven level for an open order or a grid of orders. If you are too lazy to count manually, then this process is already automated.
DailyData is a legendary info indicator, it has many modifications, all of them are included in the set. In the example below - all the keys are clickable - we leave only what is necessary on the chart.
DrawProfit v3.0.3 – the indicator displays closed trades on the chart; it can also show the result of transactions: in points, in deposit currency, in points and currency; Well, mark the stop and take levels (I have this option disabled on the screen). A very comfortable bun.
Unfortunately, it is impossible to talk about all the useful indicators here, and this is not necessary. In the info indicators thread on the forum, everything is presented with pictures and detailed descriptions - link at the end of the article.
The most famous indicators of this type: there are a great many of them.
AC and Macd trading strategy
Accelerator Oscillator can be combined with trending algorithms such as Macd. Trading follows the trend, indicator signals should be directed in one direction.
We recommend that you further study other strategies of Bill Williams, which we wrote about earlier.
Signals for a buy transaction:
- The Macd histogram is above zero, which indicates an increase in price.
- One of the above buy patterns (of 4, 3 or 2 bars) has appeared on the Accelerator histogram, the highs of which are gradually growing.
A protective stop loss is placed behind the local minimum.
Signals for a sell transaction:
- The Macd histogram bars are below zero, indicating that the price is falling.
- The AC panel has formed a bearish pattern of four, three or two bars whose lows are gradually falling.
We place a safety stop loss behind the local maximum.
Trades opened using this strategy can be closed at the moment when the trend begins to weaken or slow down. This will be indicated by the Macd signal when its bars move into the opposite zone.
Before trading on your main deposit, it is advisable to test the indicator on a demo account.
We recommend that you further study detailed information about the Awesome Oscillator indicator, as well as strategies that are suitable for it.