The Investopedia portal talks about what indicators are used by traders whose strategies are built around following trends. We have prepared an adapted version of this material.
Note
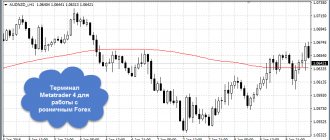
: indicators are just one of the auxiliary tools for working with exchange assets; they do not guarantee positive trading results. In order to understand the use of indicators, you will need a trading terminal (for example, SMARTx), as well as a brokerage account - you can open it online. You can practice using a test account with virtual money.
Best Forex indicators for intraday trading
Beginners to the Forex market should study indicators - special programs designed to help traders. Here are the best Forex indicators for intraday trading, which are the easiest to understand. They are used for technical analysis and forecasting, and also help make trading decisions more streamlined.
There are a lot of similar programs, they are divided into several categories:
- Trend - designed for a pronounced trend and are useless during a flat;
- Oscillators are called flat oscillators and work well with sideways movement and weak trends;
- Volume indicators - thanks to statistics, they allow you to interpret the mood of trading participants in the currency pairs market.
Experts do not recommend using more than 2-3 indicators at the same time. There are quite a lot of tools for analysis; let’s name the most understandable and beginner-friendly indicators for intraday trading: Adx crossing, Stochastic, RSI. Perhaps their popularity is explained by the fact that these indicators are among those pre-installed in the popular trading platforms of the largest Forex brokers.
What is the best way to trade – with indicators or on a “pure” chart?
Charts of currency pairs or other assets provide the same price data that is used in indicator formulas. This allows the experienced eye of a trader to visually identify entry or exit signals without additional tools.
Such trading can be compared to weather forecasting by folk signs by a resident of the outback or diagnostics “by ear” of engine operation by an experienced auto mechanic. However, none of the professionals rely entirely on “feelings”, supporting their forecasts with the readings of weather instruments or computer diagnostics of the car.
Even a professional trader can miss a signal on a “clean chart”. The use of formulas allows you to automate technical analysis, increase the number of simultaneously traded instruments, reducing the number of errors, and reduce losses.
A system created based on indicators can be programmed as a trading robot that will take trading to a completely different level. Even a beginner can understand signals from the intersection of the Moving Average or oscillator zones. They will help him find unambiguous entry/exit points and will not allow a professional to miss a deal.
Some signals, such as divergence, cannot be seen with the naked eye. You cannot refuse to monitor the long-term indicator - the moving average with a period of 200 days, which has become a “template” for institutional investors.
Adx crossing
The Adx crossing indicator belongs to the trending ones from the ADX (Average Directional Index) family and shows the strength of price movement. Graphically, it is expressed as a green circle (signal to buy) or red (indicates that you need to sell). This indicator works well for scalping.
Why is it stupid to look for a “magic” indicator?
We are dealing with a limited number of variables: price, time, sometimes volumes.
That is, any indicator, if it is not informational, receiving data from external sources, does not carry any “new” information, but only passes the same data through another formula.
So how can the indicator show you something that is not on the chart?
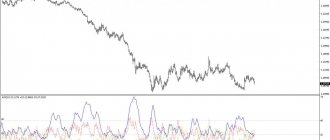
Stochastic Oscillator
The classic indicator - Stochastic Oscillator, is used to determine the current position of the closing price; the averaging period is chosen by the trader. Convenient for short-term trading, as it is more accurate due to taking into account highs and lows. The most accurate results are obtained on the side of the price. In trend areas, it is recommended to use it together with a trend indicator.
MACD indicator
Forex Moving Average Convergence Divergence demonstrates the convergence (convergence) and divergence (divergence) of moving averages. It is plotted as the difference between two MAs, displayed in the format of vertical bars. The signal line is the moving average of the MACD line itself. The indicator is an oscillator and is used to analyze trend strength.
To build the indicator, EMA with periods of 26, 12 is used, the signal line is the moving average (period 9).
The formula looks like this: MACD = EMA12 - EMA26 - EMA9*(EMA12 - EMA26).
This oscillator is usually used to confirm signals: when the MACD bars are located above the zero line, the trend is upward; if below, the trend is downward. A confirmation buy signal is relevant when the MACD histogram is located above the zero line, a sell signal - the histogram should be below the zero line.
Convergence/divergence can be considered an additional signal. A signal appears when the price forms new, higher highs and the indicator bars are located at a lower height compared to the previous high. The bullish trend begins to weaken, the price may go down. The same rule works in the opposite direction.
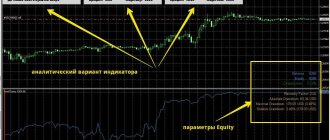
Signal on the chart:
Example strategy - Double MACD:
RSI
The RSI indicator works well in conjunction with a Forex market analysis tool such as Stochastic and complements it. Helps to open positions, taking into account overbought or oversold markets. Will not help determine how long the current trend will continue.
Mtf_Ib_Scan indicator
Designed to search for pinbars simultaneously on all time frames, this is very convenient and allows you not to miss more than one signal. It is believed that the pinbar is one of the most significant Price Action patterns. Information from other time frames is displayed in the upper left corner.
Settings
- BarsBack — number of bars for analysis
- Arrow - arrows in which direction the signal is (buy or sell)
- PaintBar - change the color of the bar when located
- m5, m15, m30, m60 — search for patterns on TF data
Trading strategies for short-term and intraday trading
Traders use about a dozen trading strategies for short-term and intraday trading. It is difficult for beginners to keep up with rapid market changes, so experienced brokers recommend using indicators for better guidance in margin trading. Such transactions involve increased risk. To avoid losses, especially much attention must be paid to technical analysis.
As an example, we can cite several intraday trading strategies that use highly liquid assets and operate with the shortest possible time frame. They are universal and specific. Universal ones are applicable in any period of time, and specific ones are focused on time frames from M5 to M30. The easiest to learn trading strategies for short-term and intraday trading are:
- From horizontal levels;
- For a breakout of the morning flat;
- Scalping;
- Trading on the news.
Price Action Pattern Indicator – MDZ Indicator
Unlike the two previous tools, the signals of the Price Action MDZ indicator can be used as a basis for entering the market. This algorithm not only determines important candlestick setups on the chart, but also performs a bunch of other additional functions. For example:
- Marks trend lines on the chart.
- Indicates strong horizontal price levels of resistance and support. Patterns found nearby signal a trend reversal.
- Reveals patterns not only on the working chart, but also on other timeframes. Suitable for multi-timeframe strategies.
- The window with additional information indicates all the important information about each found setup, including those that were discovered at higher intervals.
The disadvantage of the tool is that it is impossible to configure patterns in the settings. All a trader can do is enable or disable the search for key levels on the chart, as well as configure the visual display of the instrument and the sound alert function.
However, despite such meager settings, the tool can be used as a basis for receiving trading signals. At the same time, the patterns themselves will play a rather secondary role here and act as a confirming factor for opening a transaction.
The main focus of the indicator is on building strong price levels. Therefore, MDZ PA Indicator will work best in strategies where trading is carried out on a rebound from horizontal and trend levels.
Trading from horizontal support and resistance levels
A universal strategy that works well on time periods M15 and M30. Initially, a horizontal level is highlighted based on 2 local extremes, taking into account the selected time frames. The probability of making money is higher during the Asian session. Trading is carried out in two directions: for a breakout of the level and for a rebound.
After breaking through the level, they wait for prices to return to their previous levels, and after that they enter the market. If the price has bounced off the level, then wait until the first candle marked after the rebound is broken. After 3-5 local extremes, the probability of breaking through the level increases, and the probability of forming a maximum and minimum decreases.
At the nearest price peak outside the horizontal S/R level, a stop loss must be placed. These are pending orders that will automatically trigger if the price passes the designated level. You can also use the nearest local maxima. It is necessary to estimate the planned losses; the size of the take profit depends on them. It must be greater than the amount of losses.
Bollinger Bands indicator
The Bollinger Bands indicator (aka Bollinger Bands) is a technical tool that was created more than 30 years ago by financial analyst John Bollinger. The indicator is still relevant today; it is used to build a volatility channel, which allows you to determine the trend.
The Bollinger Bands tool uses the following parameters: the number of days for the moving average and the number of standard deviations. The most popular values are 2/2.5 standard deviations, which allow one to estimate volatility.
How to use the indicator:
- The curves narrow/widen in accordance with the strength of the movement in the market.
- As the curves approach one another, the market becomes stronger. Energy is released as soon as the chart breaks through the closing price of one of the extreme curves (standard deviations). If the upper curve is broken, it is a buy signal, and the lower curve is a sell signal.
- After a breakthrough has occurred, the movement will be close to the broken line.
- If during a correction the market reaches SMA20, this is a signal to add positions, because the moving average here acts as support (buy) or resistance (sell).
- It is worth closing trading positions when the market breaks through the SMA20 at the closing price. This happens because if, when touching one curve (upper/lower), the market pushes away from it and breaks through the middle curve, it will definitely reach the opposite curve. For example, if the market reaches the upper curve, returns and crosses the closing price level of SMA20, then it returns and reaches the lower curve.
An example of a strategy on the indicator - Bollinger on steroids:
Trading for a breakout of the morning flat
Operations called trading for the breakout of the morning flat are typical for the Asian session. At the same time, price movement remains within a narrow corridor. Currency pairs are actively traded in the European and American sessions. It is necessary to build a trading strategy focusing on the impulse change in the currency pair that occurs when leaving the range of the Asian market.
The trader is helped by using the I-sessions indicator. The tool must be downloaded and installed in order to see highlighted time periods on the charts of various sessions. You need to enter the market after the closing of the final candle in the Asian session. First, they place pending orders outside the established range. Then, after the first order is triggered, a stop loss is set in place of the second.
If there is a strong movement, the deal is closed in parts; it is possible to use a trading stop. To prevent losses, transactions that were not closed within one day should be closed manually before exiting trading.
Moving averages
Moving averages “smooth” price data: a smooth line represents the average price over a period of time.
Which moving average will be used depends on the selected time period for trading. For investors who implement long-term strategies (including those built around strong and long-term trends), there are 200, 100 and 50-day moving averages. There are several ways to use these indicators. One of them is to analyze the moving average angle. If the line basically runs horizontally over a long period of time, this means that the price of the asset does not have a pronounced trend, it is within certain limits (“flat” in the terms of stock traders). If the line goes at an angle, then there is a trend - upward or downward, depending on the direction.
An important point: moving averages cannot be considered as a tool that can in any way predict the future behavior of an asset. The indicator only shows what happens to the price, on average, over a certain time period.
Crossovers are another way to use moving averages. For example, you can display a 200-day and a 50-day moving average on a chart in a trading terminal. In this case, a buy signal may be the moment when the 50-day average crosses the 200-day average, moving upward. Conversely, a sell signal will be when it crosses the 200-day line in a downward direction.
Since the price is usually more volatile than the moving average, this method generates a large number of false signals.
Another option is to use moving averages as support or resistance levels. In the example below, the price seems to be pushing away from the line running under the chart - in this case, the moving average will be the support level. If the price tries to “break through” it and bounce down, this is a resistance level.
Scalping
Scalping involves setting a certain threshold for closing a position. It is necessary to constantly monitor the situation and make quick decisions. Setting a stop loss on a position that is as close as possible to the asset price will ensure maximum profit. For losses, the rule is used - the position is closed when the trend moves by 5 points. It is recommended to enter the market when the trend is moving confidently; in the future, the position is closed if the trend changes its direction.
For intraday trading using the scalping strategy, you should choose assets with high liquidity and bright trends. These could be options or cryptocurrencies with high volatility. During the day you need to have time to make money on high fluctuations. If the price has passed the average movement range during the day, then it is no longer worth entering the market.
conclusions
KVI positions are a very important element of an optimal pricing strategy, since they are the key products for which the retailer sets prices. Companies are increasingly using solutions to collect data and optimize prices as consumers increasingly buy and collect information about their purchases online.
Therefore, retailers should take advantage of every opportunity technology can provide to make their KVI line item offerings as flexible and personalized as possible.
We have detected that you are using Adblock and blocking advertising on our site, we ask you to add our site to the exclusion list, since our content is provided free of charge and our only income is advertising on the site. This is necessary for the further development of the project. Instructions for disabling AdBlock. Thanks for understanding!
You have an outdated browser. Please update!
You have an outdated browser. Please update!
You have an outdated browser. Please update!
You have an outdated browser. Please update!
You have an outdated browser. Please update!
Products that influence the buyer's perception of the price level in the store.
The buyer remembers the prices of such goods and compares them when visiting other stores. If prices for KVI goods do not exceed the acceptable level of psychological perception, then the buyer believes that the cost of other goods is optimal. That’s why prices for KVI items (indicator products) are so important for store sales.
Trading on the news
To successfully trade on the news, you need to be aware of all financial and economic changes in the market. If the advancement of a trend depends on them, then it is necessary to learn about any change as early as possible.
In his work, a trader can use a calendar of significant events and take into account special tables of their impact on asset rates (for example, currencies) on the stock market. It is necessary to monitor trends on higher timeframes. More complex strategies require deep knowledge of the market and the mechanisms of its development.
Organizational matters
The first and most common mistake made by retailers is the desire to indiscriminately monitor and reprice the entire assortment. This mistake is especially often made by representatives of small and medium-sized businesses who do not use tools such as ABC or KVI analysis for their products (not to mention such rare assortment segmentation as head, core & tail products or XYZ analysis).
ABC analysis - identification of unprofitable or low-profit groups of goods. It is based on the division of goods into three categories (group A: 20% - assortment and 80% - sales; group B: 30% - assortment and 15% - sales; group C: 50% - assortment and 5% - sales). It can be carried out both for a separate brand or product category, and for the company as a whole.
DigiTalk - all about business and digital promotion
Nectarin, a full-service agency with 14 years of experience, is at the microphone.
- Cases, analysis of tools and life hacks for clients and marketers;
- Global and Russian trends in digital marketing and creativity;
- Interviews with clients and industry leaders.
We discuss digital in the special project Cossa & Nectarin →
KVI analysis allows you to determine indicator products by which the buyer determines the store’s pricing policy. Managing prices for these goods after conducting KVI analysis allows you to attract a larger number of buyers. Typically, products in this group make up up to 5% of the store’s assortment.
It would seem that it would be simpler: I conducted an analysis and sent goods from categories A and B for monitoring and repricing. This is better than repricing the entire product base. But repricing without taking into account the strategic goals of the business, the competitive field and, as a result, employee KPIs is ineffective.
Let's look at this process from the point of view of a category manager.
He is faced with certain KPIs (most often quarterly or monthly), and for each category manager these indicators are different: for some it is turnover, for others it is margin, for others it is turnover of goods. And it is based on the established KPIs that the category manager selects products for repricing.
But if you switch your point of view and look at repricing from the position of a marketer, then the products that most need monitoring are those that receive the maximum number of views: traffic generator products (this does not mean that they are sold).
That is, in fact, a marketer and a category manager can have completely different KPIs for a single assortment. And if this is not taken into account when choosing goods for repricing, then some of the company’s KPIs will not be achieved.
In addition, there is another category of goods that should not be included in the array for dynamic repricing, even if it falls into one of the segments according to the results of the analysis. There are goods that are inappropriate to subject to dynamic repricing, because their cost is so low that the buyer is not sensitive to price changes (for example, for European retailers this “threshold” is 10 euros).
Summary:
To select products for monitoring and dynamic repricing, you need to combine analysis of the product range, strategic business goals and KPIs built on their basis for different departments of the company (to monitor both those products that provide profit and those that drive traffic to the site).
Technical side
Another difficulty that retailers face when it comes to dynamic repricing is the difficulty of managing product groups, especially at the initial stages.
One of Competera’s current clients, for example, for a long time could not connect to the Price Intelligence product (which allows you to automatically generate and maintain online store prices based on predefined rules (rule-based pricing) and monitoring competitors’ prices), although he realized its usefulness, because that the selection of products for monitoring in his company was carried out manually. At the same time, a large amount of time and human resources was spent, and the work (due to its labor intensity) was not performed very well. Optimal automation of this process might look like this:
- Manual marking (not unloading!) of goods for repricing by retailer staff in the ERP system and generation of an xml file based on these selectors.
- “Training” ERP to automatically assign appropriate tags (selectors) to products based on their salability.
- Integration with Google Analytics (or another system) to download data on product views on the site.
After these points are completed, indicators are entered on the basis of which products are shown or hidden (for example, hide products that have received less than a certain number of views).
It should be noted that for large retailers (enterprise) it is often easier to force their managers to upload xls tables weekly than to force their IT department to write new functionality (automatically adding tags) - due to the highly bureaucratic nature of the processes.
Summary:
choosing products for dynamic repricing is only half the journey. The second part - automation of this process - is no less important. And when, after doing all of the above, the online retailer has the opportunity to integrate with complex solutions for monitoring and dynamic repricing, he begins to work at a completely new level.
Editorial opinion may not reflect the views of the author. If you have anything to add, we will be glad to see your comments. If you want to write an article with your point of view, read the rules for publishing on Cossa.