Novice traders, reading thematic literature, quite often come across the concept of volatility. This is a statistical indicator of changes in the price of an asset over a certain time interval. This parameter is not constant and may change periodically. The significance of volatility for trading is very significant.
There are high and low volatility. When low, the amplitude of price fluctuations over a specific time period is insignificant. High volatility is characterized by a significant change in price over a short period of time.
What is the volatility of currency pairs?
Even a trading novice, watching the movement of quotes, will notice that the price trend does not move linearly. At certain moments, a currency pair may be in a rather narrow price range. This is low volatility.
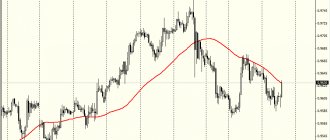
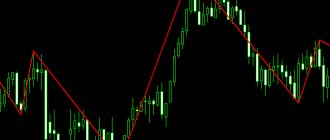
Periods when important political and economic news are released are usually characterized by a high amplitude of price fluctuations.
The figure shows the moment of publication of the consumer price index. The surge in EUR/USD price fluctuations is obvious.
The ability to correctly determine the volatility of a traded currency pair largely determines successful trading and, accordingly, the amount of profit.
You can verify the inconstancy of changes in the amplitude of price fluctuations of any currency pair using a volatility calculator. It's quite easy to use. To do this, select the required asset and set the time period calculated in weeks. Charts of the selected asset will immediately appear on the screen with hourly volatility in pips (points) and volatility indicators by day of the week. Any investor should remember that at large time intervals this indicator will be significantly less than at small ones.
Having an idea of the nature of changes in price fluctuations of any currency pair, it is easier for a trader to choose from them the one that is most suitable for his trading strategy. For example, beginners are not recommended to start their trading using assets with increased volatility. Without proper experience, such a start to trading activity is fraught with losses and, as a result, disappointment in trading.
In addition to the calculator, the volatility of a currency pair can be determined using several convenient technical analysis tools:
- CCI trading channel index.
- Bollinger Bands indicator.
- ATR average movement indicator.
ATR is the best Forex volatility indicator
This indicator was created back in 1978 by the American trader J. Wells. Initially, it was used when trading on commodity markets, on the charts of which gaps (gaps) often appeared. Because of these gaps, determining the degree of volatility was a big problem. Therefore, a special tool was created.
Calculation formula
The ATR calculation algorithm is designed in such a way that the tool can estimate the real amplitude of price movement even in the presence of gaps on the chart.
The abbreviation ATR stands for Average True Range. The ATR value is calculated as the sum of the current TR/n and the average TR * (n-1). In this case, the variable “n” is responsible for the size of the period for which the data will be calculated. TR is the true range of price fluctuations on the chart.
Using this formula, the ATR value can be calculated for absolutely any time frame, although the instrument was originally created for trading exclusively on the daily chart. Most often, the value of the period in the formula is 14 units.
Application of ATR for market analysis
The ATR indicator can be used to understand whether it is worth entering the market at the moment or whether it is better to hold off on the transaction. It is usually used when trading trend strategies, when you need to assess the strength of price volatility in the market.
For example, if ATR values are low, this indicates low price volatility. Therefore, a flat or consolidation should be observed on the chart. If the ATR is high, then this is a sign of a pronounced trend. Using a similar scheme, you can evaluate the strength of a trend. If ATR increases, then the trend on the chart intensifies. If the ATR value falls, then the trend begins to fade.
The indicator is included in the standard set of terminal tools, so it does not need to be downloaded and installed separately. To add ATR to the chart, open the “Insert” menu, go to the “Indicators” tab, then to the “Oscillators” tab. In the list that appears, find the Average True Range tool and activate it by clicking the left mouse button.
Despite the fact that the ATR indicator is the main tool for determining price volatility, in addition to it, there are other effective algorithms. For example, you can use a regular trend indicator, which will also show the degree of market volatility and give a signal about the development of a new trend or the fading of the current trend. For such purposes, QQE is perfect - an indicator without redrawing for determining the trend.
Bollinger Bands – indicator of volatility boundaries
Another standard tool for assessing the strength of market volatility is Bollinger bands. It clearly shows not only the strength of the trend, but also the range of price fluctuations on the chart.
You can add an indicator to the chart through the “Insert” main menu of your trading terminal. Bollinger Bands is based on three moving averages, each of which performs its own function. The upper and lower moving averages act as the extreme boundaries of the Bollinger Channel. Many traders use them as dynamic resistance and support levels. The center line is a moving average curve that shows the direction of price.
Determining Bollinger volatility is very simple. If the boundaries of the channel expand, then volatility increases and a new trend emerges in the market. If the channel narrows, then volatility declines and the market goes into a flat state.
Cryptocurrencies
Today, crypto assets are the most volatile Forex pairs. They are considered the most profitable in the short term, but also the most dangerous - adding to the usual problems of exotic couples is the lack of regulation. The source of cryptocurrency volatility is speculation by large traders and fundamental factors associated with attempts to put any pressure on a specific asset.
BTC volatility chart.
“Young” cryptocurrencies (with the smallest capitalization) show maximum activity. Older BTC, LTC, XRP, ETH usually have approximately the same relative volatility as the major currency pairs: the daily range does not exceed 2-5%, and the weekly one remains at 10%.
Bitcoin pairs with different currencies.
Crypto assets are traded on the market in various currencies - their performance is assessed separately.
The most liquid volatile pairs involving Bitcoin.
Keltner Channel – volatility indicator for MT4
The indicator was created in 1960 by Charles Keltner. Named after its creator, the tool shows on the chart the channel within which the price is moving. The appearance of the indicator is very similar to Bollinger Bands and also consists of three moving averages.
The Keltner Channel and Bollinger Waves differ from each other in the algorithms for calculating the curved lines that are the boundaries of the channel. The Keltner instrument is less sensitive to market changes and gives smoother readings. Therefore, its signals are much more accurate, but at the same time they arrive much less frequently.
Market volatility forces are determined by Keltner in the same way as by Bollinger. The wider the channel, the stronger the volatility. A narrow channel signals that the market is moving into a flat. The direction of the channel boundaries indicates the trend of the chart. For example, if the lines look up, then the trend is bullish, and if down, then the trend is bearish.
Raw materials, metals, indices
This group usually includes oil (WTI, Brent), spot assets for gold, silver, copper, as well as the main stock indices S&P500 and USDX. The volatility of such assets is consistently strong and dangerous; they can be traded only after a high-quality fundamental analysis of the situation.
Volatility of major spot metals.
CCI – currency pair volatility indicator
The abbreviation CCI translates to “Commodity Channel Index”. This tool was created by Donald Lambert to assess commodity market volatility. Later it began to be used for trading currency pairs and other assets. Today, this indicator is included in any trading terminal and is used in many profitable and effective strategies.
CCI shows the degree to which an asset's price deviates from its average values. When calculating, the indicator uses the closing price, as well as the minimum and maximum values of the candle.
The tool has two important horizontal levels: +100 and -100. His readings vary relative to these two lines. Strong volatility in the market is indicated by a situation when the CCI curve approaches +100 or -100 (depending on the trend). If volatility is low (flat in the market), then the signal curve is close to the central level.
Using this tool, you can easily determine whose forces currently dominate the market and how strong the trend is. For example, if there is an upward trend on the chart, and the CCI curve is moving towards the level of +100, this indicates strong market volatility and a strong trend. You can open a buy position. The same is true in the opposite direction.
You should be careful when opening trades at times when the curve has already reached the extreme level of -100 or +100. At this time, the market may turn in the opposite direction.
We also recommend that you familiarize yourself with the modification of the standard CCI - Woodies CCI for trend trading. It does not redraw signals and can be used to find points for opening orders and setting stop losses.
Cross rates
Cross rates (without the participation of USD), as a rule, move more actively than the main pairs, but their activity is predicted due to the influence of many factors affecting the economies of both countries. Such volatile pairs require complex fundamental analysis and have unstable, speculative liquidity. This is reflected in very high spreads, large levels of minimum Stop Loss, and low point value, which places special demands on money management.
Top rating of the most volatile cross rates.
The most volatile currency pairs are always determined by fundamental factors. Please note: pairs with different basic economic factors are moving most actively . For example, GBP/AUD, where the pound represents a politicized service economy, while the Australian dollar belongs to a commodity economy. Pairs whose currencies have a large difference in base interest rates are also actively moving.
Technical analysis of these volatile pairs is less effective; any sharp increase in trading volumes causes an illogical reaction. Trading cross pairs is strictly not recommended for beginners.
Custom market volatility indicators
The following tools are not included in the usual set of terminal indicators. Each of them has its own characteristics, advantages and disadvantages. Let's take a closer look at the most popular indicators created by users to assess chart volatility.
ATR Up & Down – indicator showing volatility
This tool is a modified version of the standard ATR. It shows the average value between the maximum and minimum prices for a certain time period (variable N).
The tool looks like a histogram with red and green columns that are formed above and below the zero (central) level. Red bars are the average between the opening price and the minimum price for the N-period. The green bars show the average between the Open price and the maximum price for a certain period.
If the red bars are longer than the green bars, then a bearish trend prevails in the market. With long green and short red bars, one can judge the prevalence of a bullish trend in the market. Moreover, the longer the bars and the wider the histogram, the greater the market volatility.
Thus, the indicator shows not only the degree of market volatility, but also gives a signal about whose forces prevail at the moment - buyers or sellers.
Percent Ashi TT Indicator
The indicator shows market volatility and also determines the moment of trend reversal and price rollback. With its help, you can find the starting points of a new trend, as well as predict how long it will last.
The instrument has a very interesting appearance. Once installed on the chart, it colors all the candles in different colors, depending on the trend of the chart. Percent Ashi TT gives only three types of signals:
- During an uptrend, the chart candles are colored green.
- When a trend breaks, the candles turn purple.
- If the trend is downward, the candles turn bright pink.
The indicator was created for such currency pairs as EUR/JPY, GBP/JPY, USD/CAD, EUR/CAD and GBP/USD. It is not recommended to use it on other currency pairs.
Soho Williams VIX FIX-PRICE volatility indicator
The tool is a modification of the classic VIX FIX indicator for determining market risks and changing price minimums and maximums.
The indicator shows the VIX index, which in trading circles is called the “fear index” or the degree of market volatility. The Vix is a reflection of the market's impulsivity. For example, the higher the Vix index, the more impulsive the market and the higher the volatility. The same thing works in the opposite direction - with low Vix indicators, one can judge the onset of a lull in the market.
Volatility Average Single High-Limit (VASHL) tool
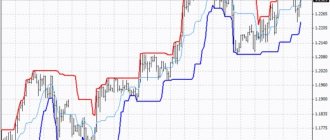
The VASHL indicator is one of the best custom tools for determining chart volatility. Its readings are based on three ATR indicators at once. After adding an instrument to the terminal, three moving lines will appear under the chart, each of which has its own designation:
- The red curve displays the volatility of the ATR indicator with a period of 1.
- The blue curved line shows the average degree of volatility. It is based on ATR with a period of 24.
- The brown line represents high volatility. It is based on the ATR indicator with a period of 60 (the period of the average volatile ATR multiplied by 2.5 units, that is, 24*2.5=60). If you change the ATR value of the blue line, then this value will also be different.
Thus, this indicator displays 3 market states at once:
- Low activity of sellers and buyers. The red line is below the blue ATR.
- Active market. The red ATR is located between the brown and blue ATR.
- Very high market activity. The red ATR rises above the brown ATR.
By assessing the position of the curved lines relative to each other, you can decide to open a transaction. If there is low volatility in the market, then it is better to postpone trading until the price leaves the flat.
When the market volatility is extremely high, trading is also not recommended, since the price in most cases will roll back and may hit the protective stop loss. The best option for trading is average volatility, when the blue, red and brown lines follow one after another.
Notis – volatility breakout indicator
The tool can determine the volatility of a currency pair, the direction and strength of the trend. In its calculations, it uses the difference between the intraday high (High) and the intraday low (Low).
The indicator can operate in two modes:
- The first mode is called “Non-cumulative”. It is enabled by default. In this mode, the tool draws two lines on the chart – Minus and Plus. Volatility is determined by the distance between these two lines. The further they are from each other, the higher the volatility, and vice versa. The intersection of the lines with each other is a signal of a trend change (volatility breakout).
- The second mode is called “Cumulative”. When activated, the indicator turns into a regular oscillator - it shows areas of market overheating and signals a change in trend.
This unique combination of modes makes Notis very convenient for chart analysis.
Daily Go On Graph – intraday Forex volatility indicator
The tool adds levels to the working chart, which are calculated based on the range of price fluctuations of the past time period. The trader can independently specify the size of this period in the settings.
The Daily Go On Graph can be used to determine intraday volatility. After installation, the indicator plots 6 levels of different types on the chart:
- Blue levels. They show a limit that is 75% of the maximum price range.
- Dashed levels. They are central (middle) marks. Divide the entire range of vibrations into two equal parts.
- Red levels. Mark a boundary that is 95% of the maximum price range.
The indicator adds one level of each type above and below the main chart. Thus, the trader can see the average and maximum range of both the upper and lower price values. Pay attention to the graph below.
How to use volatility indicators when trading Forex?
These tools are not used to find precise entry points. Volatility indicators are additional filters to the main trading strategies. They give the trader an understanding of how calm or restless the market is at a given time and whether it is worth opening a trade at all.
The most popular indicator among all of the above is the standard ATR - it provides all the necessary information, does not overload the chart and is included in the set of both the 5th and 4th versions of the MetaTrader terminal.
Ways to use volatility tools:
- As a filter when working on trend strategies. They help filter out flat markets.
- To find points for setting a protective stop loss. If volatility is low, Stop-Loss will also be low. And vice versa, the higher the volatility, the greater the Stop-Loss to protect the deposit.
In rare cases, the ATR indicator is used to search for market entry points. In this case, 3 copies of it are installed on the chart at once, but with different periods. Trades are opened when different ATRs cross each other.
We recommend that you familiarize yourself with the effective Standard Deviation indicator for determining the standard deviation. It also shows the strength of market volatility.
Variety of tools for determining values
Successful trading in the foreign exchange market requires the use of maximum funds for effective analysis and making reliable forecasts. For some, a schedule and their own abilities are enough for this, others use many tools. But measuring volatility is important for any trader, so it’s worth knowing the tools for analyzing the indicator.