American inflation is expressed through the Consumer Price Index (CPI). This indicator is published by the US Department of Labor Bureau of Statistics every month. It is calculated by measuring the price level of consumer products and services.
-0.10%
— inflation rate in the USA for May ;
Data for April is not yet available
0.29% - over the last 12 months;
-1.10% - from the beginning of 2021;
2.43% - over the past year.
Various other sources round these data differently.
Dynamics
Table. Inflation in the USA by year:
| Year | Inflation value, percentage |
| 2019 (forecast) | 2,1 |
| 2017 | 2,17 |
| 2016 | 2,07 |
| 2015 | 0,73 |
| 2014 | 0,76 |
| 2013 | 1,5 |
| 2012 | 1,74 |
| 2011 | 2,96 |
| 2010 | 1,5 |
| 2009 | 2,72 |
| 2008 | 0,09 |
| 2007 | 4,08 |
| 2006 | 2,54 |
| 2005 | 3,42 |
| 2004 | 3,26 |
| 2003 | 1,88 |
| 2002 | 2,38 |
| 2001 | 1,55 |
| 2000 | 3,39 |
| 1999 | 2,68 |
| 1998 | 1,61 |
The table presents data that shows that inflation reached its peak in 2007. It was also high in 2000 and 2005. The lowest figure was in 2008. In recent years, stability in the US economy can be noted.
In 2021, the depreciation of the US national currency reached 2.07%. This means that if the cost of a product was 1000, then at a given inflation level, buyers purchased this commodity unit by $27 more in cost (i.e. for $1027).
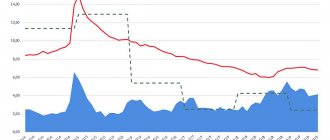
Schedule. US inflation rates (1998-2019):
The main reasons for the growth of inflation over the considered time period include increasing payments for housing costs, utilities and electricity. At the same time, the cost of food did not increase.
In all countries, the same indicators are used to measure inflation - special indices. The USA is no exception in this regard. The percentage change in the price level is equal to the inflation rate. The US Federal Reserve is doing everything possible to keep inflation below 2%. It is under such conditions that the economy is able to expand, because the population does not lose purchasing power.
There are two characteristics that fully reflect the level of inflation in the United States. These are the Consumer Price Index (CPI) and Producer Price Index (PPI). CPI is calculated every month based on the prices of essential goods and services - food, tuition fees, etc. When calculating PPI, the cost of socially less significant goods is taken into account.
Pay attention! Information on the American national debt in real time can be seen at the link -
American experts also divide inflation into two levels - basic and general. With general inflation, there is an increase in prices for essential goods, in particular electricity and food products.
But US inflation also has its downsides. For example, reducing the role of state-owned enterprises in the economy, reducing small businesses. At the same time, the market interest rate also exceeds zero.
Return to content
Dollar inflation by month
The following is data on price level growth calculated by month:
| Month | Index |
| May – June 2018 | 0,32 |
| March – April 2018 | 0,63 |
| January – February 2018 | 0,99 |
| November – December 2017 | -0,06 |
| September – October 2017 | 0,47 |
| July – August 2017 | 0,24 |
| May – June 2017 | 0,18 |
| March – April 2017 | 0,38 |
| January - February 2017 | 0,99 |
At the beginning of the year, there is traditionally an increase in average wages over previous months, which increases inflation. In the euro area countries, the opposite trend is observed: a drop in indicators at the beginning of the year and a gradual increase towards the end of the period.
Reasons for low inflation in the United States
The consistently low threshold of American inflation is determined by the following main factors:
- The US national currency allows inflation to be exported. This is possible due to the fact that the dollar has the status of a world currency;
- dividing inflation into two levels: basic and general. Some products may be affected by this phenomenon, while others may be spared;
- When compiling statistical data, the cost of goods that have a lower cost if analogues are available is always taken into account. This allows you to keep the CPI indicator at a stable level;
- large bank reserves.
Return to content
Comparison with Russia
Schedule. Inflation Russia, USA:
When comparing the inflation rate of two countries, you should always take into account the difference in the exchange rates of national currencies. However, thanks to minimal increases in prices for goods and services, the US government can provide its population with a more stable life. That is, American prices are growing more slowly than Russian prices. This is evidenced by the statistics on the inflation rate of each country shown in the graph above.
The situation regarding bank deposits in the two countries is also similar. For example, in 2011, US banks provided their clients with deposits at 0.35 percent. Therefore, as in Russia, in the USA, at such an interest rate, you can only protect your savings from inflation; you won’t be able to earn much money.
To determine how much inflation will affect an individual, you always need to take into account his needs, and these may be biased towards the consumption of luxury goods or essential goods. Inflation will affect the first category of people less than the second.
History of American Prices from 1776 to Today
Source: 247WALLST.COM
Since the signing of the Declaration of Independence in 1776, the cost of living in America has increased approximately fifteenfold. Of course, not all prices have risen equally.
Over 234 years, coffee has risen in price 15 times. This is similar to the depreciation of the dollar, as measured by the purchasing power of the dollar and the consumer price index.
Land values have increased significantly in certain parts of the country - especially in regions that were once rural and are now part of large cities. Who could have known 150 years ago that land in New York's Central Park would be worth several thousand times more than it was in 1776? In turn, products like whale oil, once used for lighting homes, now have no official value at all. Powdered wigs have clearly lost value because they have gone out of fashion.
Inflation varies surprisingly from decade to decade, from product to product, from service to service. Portal 24/7 Wall St. decided to illustrate this by looking at the prices of some goods that were and, in some cases, are part of everyday life in America. We looked at the prices of common goods for every 25 years since 1776. Some of them cannot be tracked throughout the entire period. For example, Levi Jeans were not sold until the 1870s. Also, Americans today do not own horses, but many did in the late 18th and early 19th centuries. As such, the products and services reviewed by us have changed from time to time.
Many economists and Federal Reserve officials argue that there is no inflation. They worry that America could enter a period of widespread unemployment and falling prices, similar to the era of deflation that destroyed the Japanese economy almost 20 years ago. And these experts may be right. However, they will most likely not be right for long.
Low interest rates, high unemployment and a faltering housing market may keep a lid on the prices of many of the goods Americans buy and sell daily, but economies are recovering and periodic shortages of critical products like oil can turn periods of mild price increases into periods of hyperinflation. In 1980, rapid increases in the cost of oil and other commodities pushed inflation up 15%. Mortgage rates rose to 18%. This was partly due to the enormous rise in oil prices that began with two oil export crises in 1973 and 1979. Gasoline was such an important part of American consumer activity and industrial production that the cost of living and the cost of doing business changed almost overnight in the late 1970s.
In its analysis of the cost of living over 234 years, 24/7 Wall St. demonstrates that the cost of goods and services can rise rapidly over a period of several years, and then a once important product quickly becomes completely useless. This is the "car antenna" phenomenon. The automobile quickly replaced the horse and buggy just after the turn of the 20th century. On the other hand, the value of goods like land and gold can rise almost indefinitely. Because they are essentially finite assets, unlike oil, they provide ideal protection against GDP contraction and low levels for several years.
In our analysis, we used "Dollar Rate: 1600-1865" and "Dollar Rate: 1860-2004", which are among the most accurate sources of information about dollar movements and, by looking at historical commodity prices and wages, how they affect economy. We also consulted publications on a site dedicated to providing “the highest quality and most reliable information on important aggregate economic indicators.” Finally, we consulted the Commodity Exchange to verify historical commodity prices and also determine which commodity would best reflect inflation over time.”
Our description of each period provides a historical summary and a list of some of the most interesting prices. To complete the picture, we present coffee prices for each year throughout the period, as well as the approximate historical purchasing power of the dollar for that year.
1776
— A ton of iron cost $63.73 (Philadelphia, 1775) — Twenty gallons of orange peel cost 2 shillings 6 pence (Richmond County, Virginia, 1776)
- Chessboard with pieces cost 2 shillings 6 pence (Richmond County, Virginia, 1776)
— A double-barreled gun cost 3 pounds (Richmond County, Virginia, 1776)
— A pound of coffee cost 0.13 silver dollars (Boston, 1775)
— $1 in 1775 = $29 today
During the American Revolution, the primary currency of the United States was still British pounds. When war broke out, the colonies began printing enormous amounts of paper money (about $450 million) to cover expenses, causing horrific inflation. This, coupled with shortages associated with the British blockade, led to significant increases in the price of many goods.
1800
- Dictionary cost $0.50 (1797) - Encyclopedia in 12 volumes cost $2 (1802)
- The chest of drawers cost $2 (1802) - The cow cost $10 (Charles County, Maryland, 1804) - The cost of building the President's House for South Carolina College was $8,000 (1806)
— A pound of coffee cost $0.25
— $1 in 1800 = $17.60 today
At the beginning of the 19th century, the United States economy was still immature. The country's monetary base did not exceed $30 million, that is, there was less than $6.00 per citizen, and the entire volume of the economy was only $20 million greater than the amount of money of all the colonies 25 years earlier. The cost of many goods has increased due to poor infrastructure in the country. Shipping one ton of goods from Europe to America 3,000 miles cost $9.00. It cost the same to transport the same quantity of goods from the coast inland 30 miles.
1825
- Ten pounds of sugar cost $0.20 (1822) - One acre (4046.86 m2) of 400 acre land cost $2.00 (Sumter, SC, 1823) - Bushel (35.2 liters) of potatoes cost $0.12 (1829) - Porcelain service cost $8.00 (1828) - Cow cost $12.00 (1829)
— A pound of coffee cost $0.17
— One dollar in 1825 = $22.40 today
The hallmarks of the American economy in 1825 were innovation and expansion. The construction of irrigation systems and railways opened up access to the interior of the country, and as a result, consumer goods became available to many who lived away from industrial centers, and domestic trade increased. In addition, approximately 100,000 Europeans moved to the United States each year, many of them skilled artisans, which greatly stimulated the economy.
1850
- A bottle of port cost $0.11 (Greenville County, South Carolina, 1847) - A piano cost $195 in 1847 - A routine doctor's visit cost $2 (Florida, 1852) - A new house in Brooklyn, New York cost $2,500 ( 1853)
— A pound of coffee cost $0.80
— $1 in 1850 = $28.30 today
By 1850, the United States economy was growing extremely strongly, driven by the success of agriculture in the South and industry and commerce in the North. The country's population has increased approximately fivefold since the beginning of the century and, accordingly, labor productivity has increased significantly. Between 1840 and 1860, the country more than doubled its agricultural production. The mining and manufacturing industries have tripled during this time.
1875
— A neckerchief, “designed to replace all other methods of tying a cord under a collar,” cost $0.10 — A dozen pairs of Levi Strauss jeans cost $13.50 (1874) — A pair of shoes cost $0.98 (1875) - Costume cost $10.00 (1875) - Opera ticket to Le nozze di Figaro cost $1 (San Francisco, 1875)
— A pound of coffee cost $0.25
— $1 in 1875 = $20.20 today
After the Civil War, US manufacturing experienced an unprecedented boom. However, this growth was interrupted by the Panic of 1873, a major economic recession. In addition to this decline, the country experienced rapid economic recovery because from 1860 to 1890 the population more than doubled, from 31.5 to 76 million. Most jobs required a 60-hour work week and paid anywhere from $1.60 (firefighter in Massachusetts) to $4.64 per day (glassblower in New Jersey).
1900
- Tooth powder cost $0.25 (1896) - 40-week boarding at Clemston College cost $59 (1896) - House on Flatbush Avenue in Brooklyn, New York, cost $7,000 to $12,000 (1901) ) - Oldsmobile cost $650 (1904)
— A pound of coffee costs $0.15
— $1 in 1900 = $26.40 today
The early 20th century is known as the Progressive Era. The lower classes, fed up with the abuses of the trusts and railway companies, pushed for legislation to combat corruption and poor working conditions. During this period, industrial growth continued in the United States, and from 1900 to 1920, the number of nonfarm jobs increased from 800,000 to two million. In 1900, Kodak released its famous Brownie camera. It cost $1.
1925
— A year's tuition at Cornell University, including living expenses, cost $1,400 (1927) — A Harley-Davidson motorcycle cost $235 (1927) — A camera cost $80 (1928) — A Chrysler Imperial Sedan cost $2,995 (1928) .)
— A pound of coffee cost $0.47
— $1 in 1925 = $12.20 today
In 1925, America found itself in the midst of the Roaring Twenties, characterized by rapid economic growth and consumerism. In 1925, more than 40 million Americans went to the movies every week, there were 20 million cars on the road, and having a radio was to most Americans what having a television was today. That year, women became the target of an advertising campaign for Chesterfield cigarettes, and Hormel released the first canned meat that would later be called “Spam.”
1950
- A game of Monopoly cost $4 (1950) - A bottle of aspirin cost $0.54 - A Chevy Corvette cost about $3,000 - A one-way plane ticket from New York to California cost $88.
— A pound of coffee cost $0.79
— $1 in 1950 = $8.91 today
In the 1950s, the American industrial economy was going through a period of change after World War II. Following the return to civilian life of millions of American soldiers receiving discharge benefits and the introduction of a new 40-hour workweek as a result of Roosevelt's New Deal, the economy was characterized by a strong middle class as well as mass migration to the suburbs. In 1950, there was one car for every 3.7 Americans and 5 million households owned televisions, but only 45 million still had radios. This year, Coke held 69% of the cola market.
1975
- An Apple computer cost $1,300 (1977) - A six-pack of beer cost $1.49 (1978) - A microwave cost $168 (1978) - A movie ticket cost $1 (Chicago, 1978)
— A pound of coffee cost $1.40
— $1 in 1975 = $3.98 today
In the mid-1970s, the United States was experiencing one of the worst economic crises since the Great Depression. Oil prices have skyrocketed, with the cost of regular gasoline topping $1.00 per gallon for the first time. In 1975, 120,000 Americans filed for bankruptcy and unemployment reached 9.2%. That same year, the first McDonald's drive-in restaurant opened.
year 2000
- A 12-pack of Bud Light cost $8.99 (2003) - A 42-inch Samsung TV cost $999 (2004) - A movie ticket in Chicago cost $7.50 (2004) - Cost of one year of college at St. . John's College was $30,570 (2004)
— A pound of coffee cost $3.54 (2000)
— $1 in 2000 = $1.25 today
As the United States entered the 21st century, the economy boomed due to the “dot-com bubble.” Unfortunately, conditions changed for the worse after the bubble burst in 2001. However, many other features are characteristic of this period, for example, the fact that 60% of American households had a personal computer. The 2000s also saw the birth of the modern green movement, with Honda releasing its first hybrid vehicle.