Inflation is an increase in the price level of goods and services in a country over a long period of time. Every year, with a dynamic increase in inflation, the same amount of money is enough for fewer goods and services. For example, one thousand rubles in 2007 could buy much more products than in 2021, in which this amount is equivalent to approximately 390 rubles. In our country, inflation is expressed by the consumer price index (CPI). It is calculated for a specific group of goods that define the consumer basket.
Experts' opinions on the benefits and harms of inflation for the country's economy vary. On the one hand, inflation maintains a certain stability of the state in economic terms. On the other hand, regulation of the process through government intervention leads to higher prices, upsetting the balance of supply and demand in the market for goods and services.
What is inflation?
Literally, this term is translated from Latin as “bloating.” In the economic sector, it is used when prices for basic goods and services increase for a long period. An increase in inflation means that consumers can purchase fewer goods and services with the same amount of money.
The depreciation of money leads to a decrease in purchasing power. In the global market economy, annual inflation is expressed in a single form - rising prices. If this process is attempted to be prevented at the administrative level, a shortage (shortage) of goods may occur.
Official data – to trust or not?
Blind trust is not the most reliable option. It is likely that there are some distortions present. Considering the complexity of collecting information and the difficulty of processing it, inaccuracy and the occurrence of multi-level problems cannot be ruled out. This refers to a simple oversight, not a deliberate distortion. In addition, there are difficult to overcome errors that were initially present in the methodology. For example, information is not collected in all cities.
Official inflation data can serve as a guide. At the same time, you need to understand that there are no other proven methods in the global aspect. By the way, there is also no information about the deliberate understatement of data by Rosstat.
Types of inflation
In total, it is customary to distinguish 4 classes, each of which has its own separate subspecies. Let's consider each of them separately.
By growth rate
- Creeping - when prices rise by an average of 10% per year. It is this type that economists equate with the normal development of the country’s economy.
- Galloping - price increases in the range of 10-50%. This type of inflation is dangerous for the economic development of the state, and therefore requires urgent measures to eliminate it.
- Hyperinflation - prices for goods and services increase by 50% or more over the year. As a rule, this subspecies is observed during a state of war in the country or during a period of deep economic shock.
By nature of manifestation
This class consists of two types of inflation: open and suppressed. The first implies the systemic nature of price increases. In the second type, wages and pricing policies for goods and services are under constant control by the state. The main way of expression in this case is a commodity deficit - that is, the population has money, but there is nothing to spend it on.
By aggregation level
This category includes personal inflation - when there is an increase in prices for the consumer basket of a particular buyer. In this case, differences with official indicators may increase or decrease.
For other reasons
- Agflation is an increase in prices for agricultural products at any rate.
- Shrinkflation is a reduction in the net value of a product while maintaining the packaging and price familiar to the consumer. Thus, the manufacturer tries to mask inflation to maintain consumer demand.
EREPORT.RU
Author - Tatyana Yurievna Matveeva, teacher at the National Research University Higher School of Economics "Macroeconomics: A course of lectures for economists", 2001
Inflation and its indicators
Inflation (“inflation” - from the Italian word “inflatio”, which means “inflation”) is a steady trend of growth in the general level of prices.
The following words are important in this definition:
- sustainable, which means that inflation is a long-term process, a stable trend, and therefore should be distinguished from a price jump;
- general price level. This means that inflation does not mean an increase in all prices in the economy. Prices for individual goods can behave differently: increase, decrease, or remain unchanged. It is important that the general price index increases, i.e. GDP deflator.
The process opposite to inflation is deflation - a stable tendency towards a decrease in the general price level. There is also the concept of disinflation, which means a decrease in the rate of inflation.
The main indicator of inflation is the rate (or level) of inflation, which is calculated as the percentage ratio of the difference between the price levels of the current and previous year to the price level of the previous year:
where Pt is the general price level (GDP deflator) of the current year, and Pt – 1 is the general price level (GDP deflator) of the previous year. Thus, the inflation rate indicator characterizes not the growth rate of the general price level, but the growth rate of the general price level.
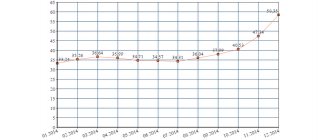
Inflation in Russia, %
Source - CIA World Factbook
View inflation data in Russia in table form
View inflation data in other countries of the world
An increase in the price level leads to a decrease in the purchasing power of money. Purchasing power (value) of money refers to the number of goods and services that can be purchased with one monetary unit. If the prices of goods rise, the same amount of money can buy fewer goods than before, so the value of money falls.
Types of inflation
Depending on the criteria, different types of inflation are distinguished. If the criterion is the rate (level) of inflation, then we distinguish: moderate inflation, galloping inflation, high inflation and hyperinflation.
• Moderate inflation is measured in percentage per year and its level is 3-5% (up to 10%). This type of inflation is considered normal for a modern economy and is even considered an incentive to increase output.
• Galloping inflation, also measured in percentage per year, but its rate is in double digits and is considered a serious economic problem for developed countries.
• High inflation is measured in percent per month and can reach 200-300% or more percent per year (note that the “compound interest” formula is used to calculate inflation for the year), which is observed in many developing countries and countries with economies in transition.
• Hyperinflation, measured in percentages per week and even per day, the rate of which is 40-50% per month or more than 1000% per year. Classic examples of hyperinflation are the situation in Germany in January 1922-December 1924 when the rate of increase in the price level was 1012 and in Hungary (August 1945 - July 1946), where the price level over the year increased by 3.8 * 1027 times with an average monthly increase of 198 times.
If the criterion is the forms of manifestation of inflation, then a distinction is made between explicit (open) inflation and suppressed (hidden) inflation.
• Open (explicit) inflation is manifested in the observed increase in the general price level.
• Suppressed (hidden) inflation occurs when prices are set by the state, and at a level lower than the equilibrium market level (established by the ratio of supply and demand in the commodity market) (Fig. 1.). The main form of hidden inflation is the shortage of goods.
PM is the equilibrium market price at which demand is equal to supply, PG is the price set by the state, YS is the amount of total output (the amount of products that are produced and offered for sale by producers), YD is the amount of aggregate demand (the amount of products that people would like to buy consumers). The difference between YD and YS is nothing but deficiency. The main form of manifestation of hidden inflation is the shortage of goods. Deficit serves as a form of manifestation of inflation, since one of the characteristic features of inflation is a decrease in the purchasing power of money. Scarcity means that money has no purchasing power at all, since a person cannot buy anything with it.
Causes of inflation
There are two main causes of inflation:
1) an increase in aggregate demand and 2) a reduction in aggregate supply. In accordance with the reason that led to the increase in the general price level, two types of inflation are distinguished: demand inflation and cost-push inflation.
• If the cause of inflation is an increase in aggregate demand, then this type is called demand-pull inflation.
An increase in aggregate demand can be caused either by an increase in any of the components of aggregate spending (consumption, investment, government and net exports) or by an increase in the supply of money.
Most economists (especially representatives of the school of monetarism) consider the main cause of demand-side inflation to be an increase in the money supply (money supply), arriving at this conclusion from an analysis of the equation of the quantity theory of money (also called the equation of exchange or Fisher's equation). As the head of monetarism, the famous American economist and Nobel Prize laureate Milton Friedman noted: “Inflation is always and everywhere a purely monetary phenomenon.”
Let us recall the equation of the quantitative theory of money: M*V = P*Y, where M (money supply) is the nominal supply of money (the mass of money in circulation), V (velocity of money) is the velocity of circulation of money (a value that shows how much turnover on average per year is made by one monetary unit, for example, 1 ruble, 1 dollar, etc. or how many transactions one monetary unit serves on average per year), P (price level) - price level and Y(yield) - real output (real GDP).
The product of the price level and the value of real output (P * Y) represents the value of nominal output (nominal GDP). The velocity of circulation of money practically does not change and is usually considered a constant value, therefore an increase in the supply of money, i.e. growth of the left side of the equation leads to growth of its right side. An increase in the money supply leads to an increase in the price level both in the short term (since, in accordance with modern concepts, the aggregate supply curve has a positive slope) (Fig. 2.(a)), and in the long term (to which the vertical aggregate supply curve corresponds) (Fig. 2.(b)). Moreover, in the short term, inflation is combined with an increase in real output, and in the long term, real output does not change and is at its natural (potential) level.
In the long term, the principle of money neutrality manifests itself, meaning that changes in the money supply do not affect real indicators (the value of real output did not change and remained at the level Y*) (Fig. 2.(b)) .
The exchange equation can be represented in tempo notation (for small changes in its constituent quantities):
,
where (deltaМ/М x 100%) is the growth rate of the money supply, usually denoted m, (deltaV/V x 100%) is the growth rate of the velocity of money circulation, (deltaP/P x 100%) is the growth rate of the price level, i.e. e. inflation rate pi, (deltaY/Y x 100%) – growth rate of real GDP, denoted by g.
Since it is assumed that the velocity of circulation of money practically does not change, then rearranging the equation, we obtain: pi = m – g, i.e. the inflation rate is equal to the difference in the growth rates of the money supply and real output. From this we can draw a conclusion, which is called the “monetary rule”: in order for the price level in the economy to be stable, the government must maintain the growth rate of the money supply at the level of the average growth rate of real GDP.
The question arises: why do governments (especially in developing countries and countries with economies in transition) increase the supply of money, imagining the negative consequences of this process? The fact is that money is issued in order to finance the state budget deficit, which explains the increase in the growth rate of the money supply and the main reason for high inflation in developing countries and countries with economies in transition.
• If inflation is caused by a decrease in aggregate supply (which occurs as a result of an increase in costs), then this type of inflation is called cost-push inflation. Cost-push inflation leads to the already familiar situation of stagflation - a simultaneous decline in production and an increase in the price level (Fig. 3.)
As a result of the combination of demand inflation and cost inflation, an inflationary spiral occurs (Fig. 4). Suppose that the central bank increases the supply of money, which leads to an increase in aggregate demand. The aggregate demand curve AD1 shifts to the right until AD2. As a result, the price level rises from P1 to P2, and since the wage rate remains the same (eg W1), real incomes fall (real income = nominal income/price level, so the higher the price level, the lower real incomes). Workers demand an increase in wage rates in proportion to the increase in the price level (for example, to W2). This increases firms' costs and causes the aggregate supply curve SRAS1 to shift leftward and upward to SRAS2. The price level will increase to P3. Real incomes will decline again (W2/P3
Workers will again begin to demand higher nominal wages. Workers usually initially perceive its increase as an increase in real wages and increase consumer spending. Aggregate spending increases, the aggregate demand curve shifts to the right to AD3, and the price level rises to P4. At the same time, firms' costs increase, and the aggregate supply curve shifts upward to the left to SRAS3, which causes an even greater increase in the price level to P5.
The fall in real incomes leads to the fact that workers again begin to demand higher wages and everything repeats itself again. The movement follows a spiral, each turn of which corresponds to a higher price level, i.e. higher inflation rate (from point A to point B, then to point C, then to point D, then to point F, etc.). Therefore, this process is called an inflationary spiral or a wage-price spiral. An increase in the price level provokes an increase in wages, and an increase in wages leads to an increase in the price level.
Other articles in the “Macroeconomics” section
Causes of inflation
Economists identify several causes of inflation, which are generally considered to be the main ones. Among them:
- An increase in general government spending, which is covered through money issue.
- The use of fiat currency for the purpose of mass lending to increase the money supply.
- A monopoly of a manufacturer who independently regulates prices for its production.
- Introduction of new types of taxes, excise taxes, duties with a relatively normal amount of money supply.
- A reduction in the current volume of national production with a normal amount of money supply, which invariably leads to an increase in prices - the previous money corresponds to a smaller volume of production goods.