Stock indices
Stock market index is a composite weighted indicator of prices from a certain set of securities. Stock indices give an idea of the direction of movement of the entire stock market, despite the fact that stock prices within the “index basket” can change in different directions.
The stock index is calculated according to a certain formula based on the current market quotes of the securities included in the index relative to the base (initially established) value. To compare the prices of different stocks, they are usually multiplied by certain coefficients, so the absolute (numerical) change in the index is not important. A more important indicator is the percentage change in the index.
Depending on the methodology for selecting the securities included in the index, the stock index may reflect the movement of the broad stock market or the movement of a market sector (index of blue chips, metallurgy, second-tier shares).
A stock index is not a security, so it is not customary to talk about the “price” of a stock index. Typically the terms "level" or "value" are used. Stock index values are used as the basis for derivative financial instruments. Index futures and options are used for speculative trading and to hedge the risk of declines in the prices of shares in a portfolio.
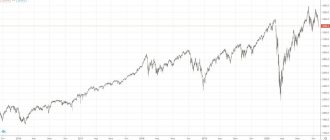
S&P 500
This stock index consists of 500 American companies that have the largest capitalization. The list has been compiled by Standard & Poor's since 1957.
Shares of companies included in the S&P 500 basket are traded on the largest US exchanges: NASDAQ and NYSE. The index is calculated by capitalization and, together with the Dow Jones, is a key benchmark for investors. Sometimes the phrase “barometer of the US economy” is even used for it.
DAX
A German index that tracks the dynamics of the country's 30 largest companies by capitalization. Unlike many other global indices, the DAX takes dividends into account (as if they were reinvested), so is effectively a total return index. The dynamics of the DAX affects not only the European stock market, but also the euro exchange rate. “Under the hood” the index includes companies such as Adidas, Allianz, Bayer, BMW, Commerzbank, Deutsche Bank, Deutsche Börse, Deutsche Lufthansa, Henkel, Siemens, Volkswagen Group and many others. The index is copied by the DAX, EWG and DXGE funds.
Dow Jones Industrial
It is the oldest market index in the world and was created by Charles Dow when he was editor of the Wall Street Journal. Using this indicator, it was proposed to monitor the development of the industrial sector of the American economy. The word industrial was retained in the name as a tribute to the times, although today not all companies in the Dow basket belong to the industrial sector.
These days, the Dow Jones is calculated using a scaled average—the total value of 30 stocks divided by an ever-changing metric, the calculation of which depends on the number of stocks in the index.
Many investors do not consider the Dow Jones to be a reputable index that reflects an accurate economic picture and stock market behavior. As an alternative, many people choose the S&P 500, which consists of 500 rather than 30 player companies.
Another disadvantage of the Dow Jones is that it is calculated by adding up the stock prices of individual companies and then dividing them by an overall ratio. Because of this, companies with expensive shares often set the overall mood for the entire basket.
This can be illustrated like this: Let's say the index takes into account the shares of 3 companies, the prices of which are equal to $1, $5 and $10, and the divisor is 0.5. Accordingly, the index is equal to 8. If the shares with the highest price fall by 30%, the index will fall to 6.5, that is, a loss of 19%. If the cheapest share doubles in price, the index will only rise to 8.5, that is, by 6.2%.
The Dow Jones includes shares of companies such as:
— American Express Co. [NYSE:AXP] - Boeing Co. [NYSE:BA] - Coca-Cola Co. [NYSE:KO] - Intel Corp. [NASDAQ: INTC] - Johnson & Johnson Inc. [NYSE: JNJ] - WalMart Inc. [NYSE: WMT] - Visa Inc. [NYSE: V] and others.
What is PPI
The Index of Industrial Production (IPI) is a monthly economic indicator that measures real output in the manufacturing, mining, electricity and gas industries relative to a base year.
The PPI is based on the production index and represents its aggregated value for the above industrial sectors.
In turn, the production index is a relative value that reflects aggregate changes in the volume of production of all types of work, products and services over comparable periods of time. In simple words, the production index shows how much the total volume of all goods produced, work performed and services provided has changed as a result of an increase or decrease in the level of their output.
The following three categories of production index are calculated:
- Individual. It represents the ratio of output volumes (current to base) of one specific product;
- Consolidated. Reflects cumulative changes in production volumes for all types of products;
- Group. Individual and consolidated production indices represent two hierarchical levels. If the calculation system uses more than two hierarchical levels, then the so-called. group indexes.
NASDAQ 100
This index has been calculated since 1985 and includes the hundred largest US companies with the largest capitalization (excluding the financial sector). Since 1998, the index has taken into account not only American companies. Most of the businesses that make up the NASDAQ 100 index are in the technology, communications, internet marketing and related industries.
The index includes the same companies that are present in the other mentioned indices, the same Facebook Inc. [NASDAQ: FB] or Apple Inc. [NASDAQ: AAPL], as well as other major projects in this sector.
The NASDAQ 100 currently includes stocks from the US, Canada, Singapore, India, Israel, China, Ireland, Switzerland and Sweden.
For investors, the NASDAQ 100 is an authoritative indicator due to the fact that:
— Places very strict demands on its participants; — Significantly depends on global market sentiment; — Approximately 10% consists of companies not from the United States of America.
How to apply this knowledge on exchanges
Experienced speculative investors keep a calendar where all important economic releases are marked, including the IPP - the days and times when it is published. On the day the news is released, they monitor whether the data coincides with expert forecasts - the so-called consensus. If yes, and the indicator increases, the market will go up; if not, it will fall.
However, over long-term investment horizons, analysts use this indicator to predict the future value of shares of a particular issuer in order to determine their growth potential. This is a rather complex and painstaking process, which is carried out by specially trained people in brokerage companies.
To summarize, I can say that the IPP is one of the main guiding indicators for an investor. For example, if we compare the GDP with GDP for similar periods, we can talk about the dynamics of production in fundamental industries compared to other areas. If the index grew faster than GDP, then industry developed faster and vice versa. This could be a good signal to buy fundamental stocks.
If you understand the processes that take place in the country’s economy, then it will be much easier for you to make informed and effective decisions. To do this, you just need to subscribe to this blog and read my educational program on investing. See you soon, friends!
Russell 2000
This stock index is fundamentally different from those presented above because it reflects the behavior of shares of projects with small capitalization (on average, about $255 million).
The index began publishing in 1987 by Russell Investments and was offered as an objective measure of the small-cap market. The significant rise in value and popularity of the Russell 2000 in the 1990s was driven by strong moves from companies in its basket.
The securities in the index are divided into two pools: Value and Growth (with low and high growth rates). It is noteworthy that in its history, the Russell 2000 has reached a “death crossing” 19 times (a fall below the 200- and 50-day moving averages, after which a prolonged market decline could be observed), but has always emerged safely from the situation and showed good dynamics.
Blue Chip Index (MOEXBC)
MOEXBC includes the 15 most liquid shares of the Russian market - “blue chips” . The indicator reflects investor confidence in the flagships of the domestic economy - LUKOIL, Sberbank, Gazprom, Norilsk Nickel, NOVATEK, Rosneft, Tatneft, etc. The indicator has been calculated since 2009 , starting at 6285.76 points, by October 2019 the indicator was at the level of 18,411.55 points. The capitalization of this index reaches 8,729,749,920,462 rubles.
CBOE Volatility Index
This index has been calculated by the Chicago Board Options Exchange since 1993 and is designated VIX. In simple terms, this indicator demonstrates the overall market expectation regarding options on the S&P 500. However, it is important to understand that the VIX remains a guess and not a guaranteed forecast.
CVOE Volatility Index is inversely proportional to stock indexes, that is, it increases when the market falls and decreases when it rises. For example, when the bulk of investors run away from risks in fear, VIX rises to 40-45 points. During calm trading with a low overall risk expectation, it stays within 20 points. A strong drop in volatility is perceived as alarming, since all investors obviously expect it to rise. Experienced specialists recommend taking profits in this case.
The dependence of the volatility index on the market situation well reflects its growth during the crisis years of 1997, 1998 and 2001, as well as in October 2008, when it reached a record of 89.53 points.
Moscow Exchange Index (IMOEX)
IMOEX started counting from 100 points. In October 2021, its value is at the level of 2,697.46 points, capitalization is more than 10,595,048,695 rubles. The number of papers accepted for calculation is reviewed quarterly. 41 shares in the benchmarks . The main indices include securities of the largest corporations in various sectors of the economy. Oil and gas sector securities are most significantly represented ; they own almost half of the positions. The largest weight is given to Gazprom (ordinary shares - JSC) and L KOIL (JSC). Second place goes to the financial sector; the leader in it is undoubtedly the shares of Sberbank .
Share of sectors in the structure of RTS and IMOEX:
- energy resources (oil and gas) - 48.6%;
- finance - 18.2%;
- metals and mining - 15.5%;
- consumer sector - 10.2%;
- telecommunications - 2.8%;
- electric power industry - 2.5%;
- others - 2.3%.
TOP 10 PROMOTIONS
| Issuer | Ticker | Capitalization, billion rubles | Specific gravity, % |
| Gazprom (JSC) | GAZP | 5 348 | 14,6% |
| Sberbank (JSC) | SBER | 4 916 | 14,0% |
| LUKOIL (JSC) | LKOH | 3 852 | 13,4% |
| Norilsk Nickel (JSC) | GMKN | 2 640 | 6,5% |
| NOVATEK (JSC) | NVTK | 3 985 | 5,4% |
| Yandex N.V. (ao) | YNDX | 662 | 4,9% |
| Rosneft (JSC) | ROSN | 4 444 | 4,5% |
| Tatneft, (JSC) | TATN | 1 498 | 4,2% |
| Surgutneftegaz (JSC) | SNGS | 1 265 | 2,9% |
| Magnet (ao) | MGNT | 363 | 2,4% |
How do investors use US and foreign stock indices?
The study of specific stock indices gives investors information about the general nature of changes in stock quotes of companies from a certain sector or group.
In general, index tracking has the following goals:
— Obtaining information about the general dynamics of quotes of companies included in a specific basket. — Obtaining information about how investors evaluate the market at the current moment. — Long-term study of the investment climate in a group of companies, industry or country. — Obtaining generalized data on the activity of players in the securities market.
In addition to the US stock indices presented in our article, there are hundreds of analogs in the world developed by agencies and exchanges to reflect the economic situation in countries and industries. The world's leading stock indices also include DAX (the 30 largest companies in Germany), Nikkei 225 (the Asian analogue of the S&P 500, consisting of 225 companies on the Tokyo exchange), FTSE 100 (describes the hundred largest players on the London Stock Exchange), CAC 40 (Paris Stock Exchange) , Russian MICEX and RTS (50 largest and most liquid companies in Russia).
Nikkei 225
Japan's key index includes shares of the 225 largest companies traded on the Tokyo Stock Exchange. Infamous for never rising after its peak on December 29, 1989, and the stock bubble that followed. The Nikkei example is often cited by opponents of passive investing through exchange-traded funds (ETFs).
Investments in Nikkei are made using EWJ, BBJP or DXJ. In Russia, you can invest in the Japanese economy using an analogue - FXJP from FinEx, which tracks the Solactive Japan index (300 companies).