Return on investment is one of the main criteria that is taken into account when deciding on the advisability of investing. The main goal of investing is to make a profit, so it is important to understand when the invested funds will pay off and what kind of income they can generate in the future. With low profitability indicators, it makes sense to consider other investment options, because the risk-to-reward ratio will be too high.
What is ROI
Speaking about what profitability is, it is worth initially mentioning a number of synonyms, including profitability, profit, payback, return, net (strict, white) profitability, rate of return, or even net profit. Of course, each of us who is directly or partially associated with investments and passive income is interested in the question of how to increase and stabilize the return on assets at a high level, so that income steadily increases and the risk of losses is minimized.
Profitability is a certain financial indicator that demonstrates the timing and return on investment.
I would like to draw your attention to the fact that profitability is, in fact, not always a positive indicator, because it can be negative if something went wrong, and too high risks nevertheless prevailed and the investor suffered a loss or loss. But without this, it is difficult to understand the value of competent calculation and in the future to minimize risks, to learn from your mistakes, and even better, from your own. Knowing the main indicators, you can calculate the return on investment in advance, but, of course, this is not an exact, but a guideline indicator.
Profitability charts
A yield chart is an indispensable tool for analyzing investment options. It allows you to look not just at the overall result of investments, but also to evaluate what is happening in the interval between the events of “investment of money” and “withdrawal of profits.”
There are several types of profitability charts. The most common is a cumulative profitability chart - it shows how much the initial deposit would have grown in %, based on returns over several time periods or based on the results of individual transactions.
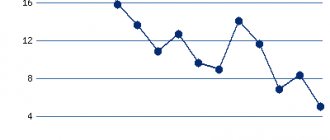
This is roughly what the cumulative yield chart looks like:
Graph of the investor's net return on the Solandr PAMM account
From it you can understand several important things - for example, whether profits are growing evenly (the smoother the graph, the better), how large drawdowns (that is, unrecorded losses during the investment process) an investor can expect, etc.
I wrote in great detail about the analysis of profitability charts in an article on how to choose a PAMM account for investing.
Profitability charts by week or month are also often used :
Graph of the investor's net profitability of the Stability Dual Turbo PAMM account by month
The columns speak for themselves - March was successful, but over the last three months there was no profit at all. If you look only at this chart and do not take into account older Stability accounts, then you can draw the following conclusion: the trading system has failed and has stopped making profits. A smart strategy in this case would be to withdraw money and wait until the situation returns to normal.
In general, profitability charts and PAMM accounts are a separate interesting story.
Why does an investor need this?
Investment is not a magic wand that will constantly bring you profits without requiring anything from you. It is important that accounting should be constant, but control should not. Anyone can keep track of investments, even if you had big problems with math at school and you never remember how much money you have on your cards and in your wallet in the form of cash. In fact, there are 2 methods by which each of your investments will be under strict control:
- In writing - the old fashioned way in a notebook based on several formulas;
- Using special programs or a basic office Excel program, proprietary calculators of organizations or projects.
I would like to note that for the convenience of monitoring each investment and assessing its profitability, there is an investment portfolio on the GQ Blog Monitor, which allows you to assess the situation in detail and without unnecessary hassle and see how much you have earned for a specific period or with a specific project. At the time of writing, the services and simplicity of the crypto portfolio were experienced by 460 investors.
From my own experience, I can say that this is extremely convenient, since investments from various HYIPs are tied into it, plus you can also take into account work on the cryptocurrency exchange. And if you are new to this financial area, the material on the blog will help you familiarize yourself in detail with the intricacies of the work.
Don’t let money go to waste, but don’t control every penny. Money loves accounting, but it doesn't love fear. And not only fiat, but also cryptocurrency.
If you are a connoisseur of classical work with money, then it’s time to replenish your body of knowledge with certain formulas that will help you calculate in advance whether it is profitable or not profitable to invest in a project.
Examples of calculating project profit in 1C
MS Excel can be used as a tool for calculating coefficient values, but the complexity of calculating the above indicators, as well as manually combining basic data to obtain them, greatly increases the possibility of error.
It is more advisable to use automated tools, for example, software products on the 1C:Enterprise platform - 1C:ERP Enterprise Management, 1C:Holding Management and 1C:ERP Holding Management. Note that these products are not the only ones that allow you to automate this process, but they are designed to automate the largest companies and holdings, where the task of investing can be described as urgent, and not as an extraordinary event.
In the 1C:ERP Enterprise Management , the problem of calculating profitability ratios can be solved using the functionality of the Budgeting subsystem. It allows you to create and customize types of reports, specify the necessary indicators and configure formulas for calculating them. To take advantage of this opportunity, in the “Budgeting and Planning” section, go to “Types of Budgets” and create a new type of budget.
Fig. 1 Creating a budget type in 1C:ERP Enterprise Management
For the created budget type, fill in the “Basic” tab.
Fig.2 Filling out the “Basic” tab of the created budget type
Then, on the “Budget Structure” tab, create the structure of a new budget on the right side of the window, selecting elements on the left (report title, table, row/column).
Let's set up 1C:ERP to automatically calculate project profitability
Fig.3 Setting up the budget structure
In the created budget view, using the “Customize cells” element, we configure the rule for calculating the coefficient.
Fig.4 Setting cell filling
Next, create a new instance of the budget and fill in the coefficient value.
Fig.5 Creating and filling out a budget instance
To implement the possibility of plan-fact analysis in 1C:ERP, we create a new type of budget and fill in the “Basic” tab.
Fig.6 Creating a new type of budget for plan-factual analysis
Then, on the “Budget Structure” tab, set the structure of the new report in the right part of the window, selecting the elements on the left side (report title, table, row/column, script, group, formula by group).
Fig.7 Setting up the report structure for plan-actual analysis
Next, using the “Customize Cells” button, we will configure the filling of report cells according to scenarios. After completing the settings, the report can be generated by clicking on “View report type”.
Fig.8 Generated report for plan-actual analysis
Difficult to figure out? Order a free consultation with an expert on accounting for project profitability in 1C
In 1C: Holding Management, the problem of calculating profitability ratios can also be solved using the functionality of the “Budgeting” subsystem. To do this, we will go to the “Budgeting, reporting and analysis” section, create and configure a new type of budget.
Fig.9 Section “Budgeting, reporting and analysis”
1C: Holding Management has a separate functionality for project management, which is presented in the “Agreements and Projects” section under the “Projects and Stages” link.
Fig. 10 Section “Agreements and projects” in 1C:UH
You can create and configure a new project in the system.
Fig.11 Creating a new project
For the created project, the correspondence of the budgets used is established. In the project card on the “Key Indicators” tab, you can view project data, including indicator values, and, if necessary, update the displayed information. The “Key Indicators” tab allows you to compare planned project data with actual data and see calculated deviations.
Fig. 12 Project “Key Indicators” tab
Typical 1C:ERP functionality. Holding management provides a wide range of tools that allow you to automatically calculate most of the indicators we discussed above (which is called “one click”), based on the entered budgets according to predefined conditions.
1C:Holding management
CPM class product for automating financial accounting, calculating profitability and other indicators
Learn more
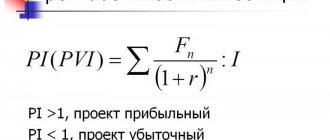
ROI Formula
The formulas invented by wise people for calculating return on investment are effective in most cases, and, surprisingly, they work for different areas of activity. In order to obtain the most accurate result, it is necessary to take into account the following fundamental points:
- Proposed, pre-calculated profitability;
- The period according to which the project will pay off;
- Investment amount;
- Risks and costs that fall on the shoulders of the investor.
ROI coefficient and how it is calculated
Mathematicians and economists have long developed many formulas that simplify our lives. Of course, I still don’t know where the formula for calculating the discriminant that was discussed in school will be useful to me, but the ROI formula is a good helper for both experienced and newbies in investing. Interestingly, the history of this investment valuation comes from the Western world; in particular, during the analysis and monitoring of the work of banks that operated under an international brand in different countries. The formula is calculated quite simply, and what is important, quite quickly. Essentially you need to know:
- Total income;
- Project cost;
- Amount of investment. Net income is calculated simply: the cost is subtracted from the total income, and then everything is divided by the amount of investment. To get the percentage, multiply by 100%.
A preliminary guided calculation of the ROI coefficient allows you to minimize risks, both in bank deposits, the Forex market, and cryptocurrency investment projects.
From my own experience, I would definitely add a column to the general analytical table - weight in the overall portfolio. It is extremely important to understand that the ROI is 30%, but the specific amount of this particular investment is only a quarter of the total working capital. And when you work with several investments in parallel, it is convenient to understand how much profitability affects the overall profit.
Speaking about the effectiveness of the formula, it is worth paying attention to the fact that although it includes fundamentally important aspects of profitability and takes into account the nature of investments, it misses important points, in particular:
- Inflation rate at the time of investment and completion of the deposit or other type of deposit;
- Non-trading and trading risks are not taken into account;
- And what I said above, the share in the overall portfolio is not indicated - what is the specific weight of this or that investment.
ROI - return on investment - a comprehensive indicator of return on investment. Often called ROR - rate of return. Using the indicator, you can estimate in advance the profitability of not only investments in cryptocurrency or an online project, but also in a start-up, your own business, an advertising or marketing campaign. And I would like to immediately draw your attention, dear readers, to the fact that the coefficient changes over time, so you cannot calculate it once and enjoy the result; it is important to periodically carry out control and additional calculations.
If the project has already almost been completed and worked, you can evaluate how successful the investment was using this type of formula: To the profit received, we add the difference between the cost of sale and acquisition, divide everything by the cost of acquisition and traditionally multiply by 100%. If the ROI is 10, this means that breakeven is still far away, because an indicator of 100 directly demonstrates that the stage of “recovering investments” has been passed, and now the money works only exclusively for profit from above.
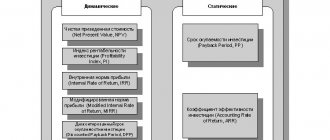
Positive and negative sides of the profitability index
The profitability for choosing a project should be calculated because:
- the opportunity opens up to analyze in a comparative manner different projects that could qualify for development thanks to investments;
- there is a very high probability of predicting risks and avoiding them with less losses for the business.
In contrast, we can identify several disadvantages of calculating the efficiency of investment production:
- calculating forecasts for future cash flows;
- the expenditure of resources and time on estimating the discount rate for different projects;
- the expenditure of resources and time to assess the impact of factors on future cash flows, which ultimately seem completely unpredictable.
Average statistical values by year for Russian enterprises
| Revenue amount | Values by year, rel. units | ||||||
| 2012 | 2013 | 2014 | 2015 | 2016 | 2017 | 2018 | |
| Micro-enterprises (revenue < 10 million rubles) | -0.023 | -0.004 | -0.007 | -0.004 | -0.005 | -0.011 | -0.011 |
| Mini-enterprises (10 million rubles ≤ revenue < 120 million rubles) | -0.007 | 0.058 | 0.051 | 0.076 | 0.068 | 0.068 | 0.063 |
| Small enterprises (RUB 120 million ≤ revenue <RUB 800 million) | 0.058 | 0.083 | 0.086 | 0.075 | 0.075 | 0.074 | 0.084 |
| Medium-sized enterprises (RUB 800 million ≤ revenue <RUB 2 billion) | 0.091 | 0.088 | 0.089 | 0.100 | 0.107 | 0.112 | 0.061 |
| Large enterprises (revenue ≥ 2 billion rubles) | 0.123 | 0.106 | 0.103 | 0.107 | 0.096 | 0.093 | 0.119 |
| All organizations | 0.107 | 0.095 | 0.093 | 0.098 | 0.090 | 0.088 | 0.106 |
Table values are calculated based on Rosstat data
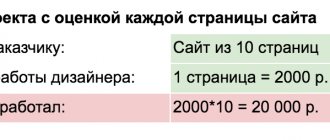
What is ROI (ROMI) for?
So is ROI even applicable? Yes, but applicable for a certain number of functions. It is mainly used by investors , but it is also useful for marketers to evaluate the effectiveness of advertising campaigns. They call it ROMI (Return on Marketing Investment), the formula is identical.
The formula is applicable both to contextual advertising in Direct and AdWords, as well as to promotions and sales . You can also find out the effectiveness of paper advertisements.
Results
Unprofitable means unprofitable. Everyone knows this. But not everyone knows what exactly profitability can mean. the profitability formulas we provide , you can easily calculate its level for the organization and find out whether your company is effective or not.
And we strongly recommend that accountants pay attention to the profitability of products and assets. What if this saves you from unnecessary attention from the tax authorities? You can find more complete information on the topic in ConsultantPlus. Free trial access to the system for 2 days.