An investor, before investing in any enterprise, seeks to analyze what kind of profit can be obtained as a result. Among the parameters by which the development prospects of a business project are assessed is PI - profitability index. The term has several names - Present value index or profitability, DPI or profitability.
Investment return index. Calculation formula
Where:
PI (Profitability Index) – index of profitability of an investment project;
NPV (Net Present Value) – net present value;
n – implementation period (in years, months);
r – discount rate (%);
CF (Cash Flow) – cash flow;
IC (Invest Capital) – the initial investment capital spent.
| ★ InvestRatio program - calculation of all investment ratios in Excel in 5 minutes (calculation of Sharpe, Sortino, Treynor, Kalmar, Modiglanca beta, VaR ratios) + forecasting rate movements |
Amount of investment: initial investment and additional capital costs
Discounted projected cash outflows represent the initial capital costs of the project.
The initial investment is only the cash flow needed to start the project. All other costs may occur at any time during the life of the project and are included in the calculation using the enterprise's discounted net profit. These additional capital costs may impact tax or depreciation benefits.
Discounted investment return index. Calculation formula
Take our proprietary course on choosing stocks on the stock market → training course
There is a modification of the formula for the profitability index of an investment project, which allows you to take into account not one-time costs (investments) in the first period of time, but investments throughout the entire period of the project. To achieve this, all subsequent investment costs are discounted. As a result, the formula will look like this:
Where:
DPI (Discounted Profitability Index) – discounted profitability index; NPV – net present value; n – implementation period (in years, months); r – discount rate (%) of investment; IC – initial investment capital spent.
★ Investment appraisal in Excel. Calculation of NPV, IRR, DPP, PI in 5 minutes
How to interpret the calculation result
The pi formula calculates the relative index. In other words, it does not demonstrate the real value of the net income flow, but only their level in relation to investment.
This fact is an advantage of the index under consideration, which makes it possible to:
- apply it when choosing between several projects;
- used to eliminate a obviously ineffective project even at the stage of its study. To make a positive decision on a project, the indicator must be above zero.
The profitability index for effective investment projects comes in three options:
- profitability is higher than 1. Investments are profitable taking into account the calculated discount rate;
- profitability is less than 1. Investments will be unprofitable, since they will not be able to generate the necessary profit flow;
- the yield is equal to 1. This investment option is effective, since the indicator in this case coincides with the internal rate of return.
Important! The calculation of the return on investment index is carried out at each stage of the project: during selection, comparison, implementation, and upon completion. It is important for any investor to understand whether he will receive the desired profit.
The higher the relative indicators of the return on investment index, the more sustainable the project. But at the same time, it is important to remember that too high results in terms of the effectiveness of an investment project: the profitability index are not always good.
If a project has a very high net present value, this does not mean that the project is profitable and should be implemented immediately. If inflated results are obtained, it is necessary to double-check all initial data again. Perhaps there was a mistake made somewhere.
Difficulties in assessing the profitability index in practice
The main difficulty in calculating the profitability index or discounted profitability index lies in estimating the size of future cash receipts and the discount rate (discount rate).
The sustainability of future cash flows is influenced by many macro- and microeconomic factors: seasonality of supply and demand, interest rates of the Central Bank of the Russian Federation, cost of raw materials, sales volume, etc. Currently, the level of sales, which is influenced by the company's marketing strategy, is of key importance to the size of future cash flows.
There are many different approaches to estimating the discount rate. The discount rate itself reflects the time value of money and allows future cash payments to be brought back to the present. So, if the project is financed only on the basis of own funds, then the discount rate is taken as the return on alternative investments, which can be calculated as the return on a bank deposit, the return on securities (CAPM), the return on real estate investments, etc. When financing a project using own and borrowed funds, the WACC method is used. Methods for estimating the discount rate are discussed in more detail in the article “Discount rate. 10 modern calculation methods."
The importance of calculating the indicator
Profitability is the most significant indicator of a company's performance. It shows its effectiveness and economic feasibility. Profitability demonstrates how profitable and profitable a company's operations are.
Profitability is usually expressed as a percentage. Based on its value, conclusions are drawn about the performance of companies with the same profit. The return on investment index and its calculation is an important point in the work of a financier.
Receiving additional investments based on this indicator means:
- improve the company's activities;
- optimize costs;
- conduct market analysis to improve work with clients and partners;
- improve pricing, etc.
That is, if you don’t know the company’s profit and profitability in the future, it means you don’t know and, accordingly, have no prospects for its development. The calculation of the return on investment index demonstrates to potential investors the level of profitability of the company.
The main benchmark that investors want to see and which is demonstrated by the indicator in question is the expected return on investment. The return on investment is determined for each monetary unit invested.
What does the profitability index show?
Take our proprietary course on choosing stocks on the stock market → training course
The profitability index shows the efficiency of using capital in an investment project or business plan. The estimation is similar for both the yield index (PI) and the discounted profitability index (DPI). The table below provides an assessment of the investment project depending on the value of the DPI indicator.
| Indicator value | Investment project assessment |
| DPI<1 | The investment project is excluded from further consideration |
| DPI=1 | The income of an investment project is equal to the costs; the project brings neither profit nor loss. It needs modification |
| DPI>1 | The investment project is accepted for further investment analysis |
| DPI1>DPI2 | The level of efficiency of capital management in the first project is higher than in the second. The first project has great investment attractiveness |
PI Index Analysis
The profitability index is an indicator whose economic meaning expresses the investor’s interest in the project. The more you can earn, the higher the PI. NPV, that is, discounted total cash flow, clearly shows how much money the financier will receive per capital turnover. Thus, the analysis gives double results: absolute and relative.
The calculated investment return index is easy to evaluate. If you compare it with one, three options are possible:
- PI > 1. The project deserves attention and detailed analysis to identify possible errors. It is necessary to double-check all initial data. It happens that factors influencing success cause errors in calculations. If the calculations are confirmed, the investment is advisable.
- PI = 1. According to the NPV criterion, there is 100% self-sufficiency without profit. In some business circles, this result is called “boiled egg broth.” If modification of a business project does not allow squeezing higher profitability out of it, it is better to refuse financing.
- PI < 1. Each financier has his own standard value of the profitability index, but if the calculation gives a result less than one, this means one thing - unprofitability of the activity. The cash flow generated by the investment is so poor that it does not cover the investment.
At its core, PI is the investor's rate of return plus one. To calculate it, it is advisable to use the EXEL program or an online calculator.
Estimation of investment return index in Excel
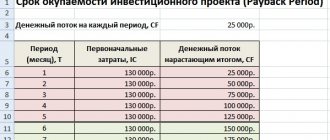
Let's look at an example of assessing the profitability index using Excel. To do this, it is necessary to calculate two components of the indicator: net present value income and net present value costs (if they were present during the project implementation period). Let's consider two options for calculating the profitability index in Excel.
The first option for calculating the profitability index is as follows:
- Cash flow CF (Cash Flow) =C8-D8
- Discounted cash flow =E8/(1+$C$4)^A8
- Net present cash flow (NPV) =SUM(F8:F16)-B7
- Profitability Index (PI) =F17/B7
The figure below shows the final result of PI calculation in Excel.
Calculation of investment return index (PI) in Excel
The second option for calculating the profitability index of an investment project is to use the built-in financial formula in Excel - NPV (net present value) to calculate net present value (NPV). As a result, the calculation formulas will look like this:
- Discounted cash flow (NPV) = NPV(C4;E7:E16)-B7
- Profitability Index (PI) =E17/B7
The second option for calculating the profitability index (PI) in Excel
As can be seen, calculations using two methods led to similar results.
| ★ InvestRatio program - calculation of all investment ratios in Excel in 5 minutes (calculation of Sharpe, Sortino, Treynor, Kalmar, Modiglanca beta, VaR ratios) + forecasting rate movements |
Conclusions on the article
Summing up the article, we will make several conclusions.
To conduct a qualitative investment analysis, it is necessary to calculate not only “simple” quantitative parameters, but also qualitative ones. Both categories of parameters are important. Quantitative (payback period, net present value, etc.) allow you to objectively assess for what period and what profit the investor can expect. But it is important to supplement the quantitative analysis with a qualitative one, which will allow you to understand how effective the investment in your project is and what kind of profitability you can expect.
In order for quantitative and qualitative investment analysis to be organically integrated into the content of the entire business plan and logically correlated with its other sections, we advise you to look at the structure of ready-made business plans for enterprises similar to yours. For example, on our website you can download such examples. You can also contact specialists in the field of business planning to develop such a document individually, taking into account the specifics of your activity.
How to make a rapid assessment of any business plan?
All business plans include a financial plan, which evaluates the effectiveness of the investment for the investor using investment indicators. The financial plan and its indicators are the most significant for making a decision on project financing. To quickly evaluate any business project for the level of investment attractiveness, you should consider four indicators: net present value, internal rate of return, profitability index and discounted payback period. If the conditions for these indicators are met, then the investment project can be analyzed in more detail on the nature and nature of the receipt of cash flows, the management system, marketing and sales.
| Express assessment indicators | Indicator values |
| Net present value (NPV) | NPV>0 |
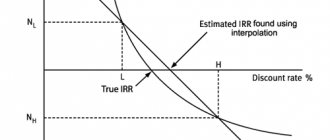
| Internal rate of return (IRR) | IRR>WACC |
| Discounted Profitability Index (DPI) | DPI >1 |
| Discounted Payback Period (DPP) | DPP →0 |
The profitability index is one of the four main indicators that any investor evaluates when investing in a project. In addition to these indicators, there are other coefficients for assessing the effectiveness of investments, which are discussed in more detail in the article: “6 methods for assessing the effectiveness of investments in Excel. Example of calculation of NPV, PP, DPP, IRR, ARR, PI.”
Take our proprietary course on choosing stocks on the stock market → training course
★ Investment appraisal in Excel. Calculation of NPV, IRR, DPP, PI in 5 minutes
Formulas and examples
The profitability index is an indicator whose economic meaning expresses the investor’s interest in the project.
The more you can earn, the higher the PI. Financing commercial projects always involves risks. Concerns arise about the reliability of forecasting for the extraction of net profit. Even the most careful evaluation of a business plan is based on assumptions. It is difficult to predict sales volumes, and the ratio of income received and investments made depends on them.
Despite the difficulties, business development is impossible without a balanced approach to business. Therefore, a preliminary analysis is needed, and one of its criteria is the return on investment index. The article talks about how to calculate it.