- Review
- Schedule
- Story
- Widget
Trade Balance is the difference between a country's exports and imports.
The trade balance is calculated as the difference between total exports and imports in the reporting period. A positive value indicates a trade surplus, a negative value indicates a trade deficit. A positive value indicates that the country exported more goods and services than it imported.
Japan does not produce oil, so it depends on oil-producing countries for most of its energy. There are other types: hydro, geothermal, wind and nuclear, but these types make up a much smaller share compared to thermal energy. Therefore, the country has to import large quantities of oil, which has a large impact on the trade balance.
At the time of the sharp rise in oil prices, Japan's trade balance became deficit, but the overall trend is positive. This is because the country exports high value-added manufactured goods, while imports tend to include energy and industrial raw materials and are much less likely to increase in volumes of such imports.
The impact of the trade balance report on the yen is ambiguous and depends on the relationship with a number of other economic indicators.
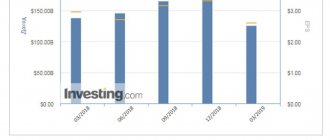
Latest values chart:
A graph of the entire available history of the values of the macroeconomic indicator “Japan Trade Balance”. The dotted line shows the forecast values of the economic indicator for the indicated dates.
A significant deviation of the real value from the forecast can cause a short-term strengthening or weakening of the country’s national currency on the Forex market. A special place is occupied by threshold values of indicators designed to signal the approaching critical state of the country’s (region’s) economy.
Source
Japan trade balance
Japan trade balance
| 663.7B | 490.0B | 215.9B | ||
| 03/17/2021 (Feb) | 02:50 | 217.4B | 420.0B | -325.4B |
| 02/17/2021 (Jan) | 02:50 | -323.9B | -600.0B | 749.6B |
| 01/21/2021 (Dec) | 02:50 | 751.0B | 942.8B | 366.1B |
| 12/16/2020 (Nov) | 02:50 | 366.8B | 529.8B | 871.7B |
| 11/18/2020 (Oct) | 02:50 | 872.9B | 250.0B | 687.8B |
Balance of foreign trade of countries of the world
Foreign trade balance (foreign trade balance) of the countries of the world.
The foreign trade balance is the difference between the value of total exports and imports. A positive trade balance means an excess of exports over imports (a country sells more than it buys). A negative trade balance is an excess of imports over exports (the country buys more than it sells). This is usually considered a negative factor. The International Monetary Fund recommends that economies have a positive trade balance. At the same time, the US has a negative balance of several tens of billions of dollars. At the same time, average living conditions in the United States served as a standard of well-being for other countries.
| Item no. | A country | Foreign trade balance | Information date |
| 1 | China | 297 100 000 000$ | 2009 estimate. |
| 2 | Germany | 168 100 000 000$ | 2009 estimate. |
| 3 | Japan | 142 200 000 000$ | 2009 estimate. |
| 4 | Switzerland | 54 010 000 000$ | 2009 estimate. |
| 5 | Norway | 53 530 000 000$ | 2009 estimate. |
| 6 | Russia | 48 970 000 000$ | 2009 estimate. |
| 7 | Taiwan | 42 920 000 000$ | 2009 estimate. |
| 8 | Korea, South | 42 670 000 000$ | 2009 estimate. |
| 9 | Netherlands | 39 580 000 000$ | 2009 estimate. |
| 10 | Malaysia | 34 080 000 000$ | 2009 estimate. |
| 11 | Singapore | 32 630 000 000$ | 2009 estimate. |
| 12 | Sweden | 30 230 000 000$ | 2009 estimate. |
| 13 | Kuwait | 28 610 000 000$ | 2009 estimate. |
| 14 | Nigeria | 22 890 000 000$ | 2009 estimate. |
| 15 | Saudi Arabia | 22 770 000 000$ | 2009 estimate. |
| 16 | Thailand | 20 260 000 000$ | 2009 estimate. |
| 17 | Hong Kong | 18 280 000 000$ | 2009 estimate. |
| 18 | Denmark | 12 430 000 000$ | 2009 estimate. |
| 19 | Argentina | 11 290 000 000$ | 2009 estimate. |
| 20 | Indonesia | 10 750 000 000$ | 2009 estimate. |
| 21 | Azerbaijan | 10 180 000 000$ | 2009 estimate. |
| 22 | Libya | 10 060 000 000$ | 2009 estimate. |
| 23 | Austria | 8 730 000 000$ | 2009 estimate. |
| 24 | Venezuela | 8 561 000 000$ | 2009 estimate. |
| 25 | Philippines | 8 552 000 000$ | 2009 estimate. |
| 26 | United Arab Emirates | 7 871 000 000$ | 2009 estimate. |
| 27 | Israel | 7 637 000 000$ | 2009 estimate. |
| 28 | Brunei | 7 024 000 000$ | 2008 estimate. |
| 29 | Chile | 4 217 000 000$ | 2009 estimate. |
| 30 | Uzbekistan | 3 595 000 000$ | 2009 estimate. |
| 31 | Finland | 3 444 000 000$ | 2009 estimate. |
| 32 | Bangladesh | 3 345 000 000$ | 2009 estimate. |
| 33 | Luxembourg | 2 985 000 000$ | 2009 estimate. |
| 34 | Latvia | 2 530 000 000$ | 2009 estimate. |
| 35 | Iran | 1 913 000 000$ | 2009 estimate. |
| 36 | Trinidad and Tobago | 1 702 000 000$ | 2009 estimate. |
| 37 | Ivory Coast | 1 670 000 000$ | 2009 estimate. |
| 38 | Lithuania | 1 492 000 000$ | 2009 estimate. |
| 39 | Belgium | 1 251 000 000$ | 2009 estimate. |
| 40 | Timor-Leste | 1 161 000 000$ | 2007 estimate. |
| 41 | Turkmenistan | 1 065 000 000$ | 2009 estimate. |
| 42 | Estonia | 898 700 000$ | 2009 estimate. |
| 43 | Gabon | 887 000 000$ | 2009 estimate. |
| 44 | Qatar | 809 000 000$ | 2009 estimate. |
| 45 | Bolivia | 800 700 000$ | 2009 estimate. |
| 46 | Burma | 705 000 000$ | 2009 estimate. |
| 47 | Bahrain | 560 200 000$ | 2009 estimate. |
| 48 | Cuba | 539 000 000$ | 2009 estimate. |
| 49 | Nepal | 537 000 000$ | 2009 |
| 50 | Hungary | 441 000 000$ | 2009 estimate. |
| 51 | Syria | 394 000 000$ | 2009 estimate. |
| 52 | Uruguay | 258 800 000$ | 2009 estimate. |
| 53 | Peru | 246 300 000$ | 2009 estimate. |
| 54 | Lesotho | 194 000 000$ | 2009 estimate. |
| 55 | Kyrgyzstan | 184 000 000$ | 2009 estimate. |
| 56 | Butane | 164 000 000$ | 2008 estimate. |
| 57 | British Virgin Islands | 134 300 000$ | 1999 |
| 58 | Cook Islands | 26 670 000$ | 2005 |
| 59 | Suriname | 24 000 000$ | 2007 estimate. |
| 60 | Palau | 15 090 000$ | 2004 |
| 61 | Comoros | 8 000 000$ | 2007 estimate. |
| 62 | Guinea-Bissau | -6 000 000$ | 2007 estimate. |
| 63 | Tuvalu | -11 680 000$ | 2003 |
| 64 | Kiribati | -21 000 000$ | 2007 estimate. |
| 65 | Tonga | -23 000 000$ | 2007 estimate. |
| 66 | Samoa | -24 000 000$ | 2007 estimate. |
| 67 | Micronesia, United States | -34 300 000$ | FY05 assessment. |
| 68 | Anguilla | -42 870 000$ | 2003 estimate. |
| 69 | Sao Tome and Principe | -49 000 000$ | 2009 estimate. |
| 70 | Vanuatu | -60 000 000$ | 2007 estimate. |
| 71 | Sierra Leone | -63 000 000$ | 2007 estimate. |
| 72 | Dominican Republic | -72 000 000$ | 2007 estimate. |
| 73 | Central African Republic | -77 000 000$ | 2007 estimate. |
| 74 | Gambia, | -81 000 000$ | 2009 estimate. |
| 75 | Belize | -94 200 000$ | 2009 estimate. |
| 76 | Burundi | -127 000 000$ | 2009 estimate. |
| 77 | Grenada | -138 000 000$ | 2007 estimate. |
| 78 | Solomon islands | -143 000 000$ | 2007 estimate. |
| 79 | Saint Vincent and the Grenadines | -149 000 000$ | 2007 estimate. |
| 80 | Paraguay | -149 200 000$ | 2009 estimate. |
| 81 | Namibia | -160 900 000$ | 2009 estimate. |
| 82 | Saint Kitts and Nevis | -163 000 000$ | 2007 estimate. |
| 83 | Zambia | -174 000 000$ | 2009 estimate. |
| 84 | Tajikistan | -179 900 000$ | 2009 estimate. |
| 85 | Mauritania | -184 000 000$ | 2007 estimate. |
| 86 | Eritrea | -188 000 000$ | 2009 estimate. |
| 87 | Saint Lucia | -199 000 000$ | 2007 estimate. |
| 88 | Antigua and Barbuda | -211 000 000$ | 2007 estimate. |
| 89 | Swaziland | -213 000 000$ | 2009 estimate. |
| 90 | Liberia | -224 000 000$ | 2007 |
| 91 | Mongolia | -228 700 000$ | 2009 estimate. |
| 92 | Togo | -236 000 000$ | 2009 estimate. |
| 93 | Barbados | -254 000 000$ | 2007 estimate. |
| 94 | Guyana | -265 000 000$ | 2009 estimate. |
| 95 | Guatemala | -267 400 000$ | 2009 estimate. |
| 96 | Bahamas, | -283 200 000$ | 2009 estimate. |
| 97 | Seychelles | -284 200 000$ | 2009 estimate. |
| 98 | Sri Lanka | -291 000 000$ | 2009 estimate. |
| 99 | Cape Verde | -319 000 000$ | 2009 estimate. |
| 100 | Salvador | -321 000 000$ | 2009 estimate. |
| 101 | Niger | -321 000 000$ | 2007 estimate. |
| 102 | Burkina Faso | -330 000 000$ | 2009 estimate. |
| 103 | Malawi | -332 000 000$ | 2009 estimate. |
| 104 | Ecuador | -337 400 000$ | 2009 estimate. |
| 105 | Djibouti | -352 000 000$ | 2009 estimate. |
| 106 | Laos | -356 000 000$ | 2009 estimate. |
| 107 | Maldives | -370 000 000$ | 2009 estimate. |
| 108 | Rwanda | -379 000 000$ | 2009 estimate. |
| 109 | Congo, democratic republic | -402 000 000$ | 2007 estimate. |
| 110 | Iceland | -440 000 000$ | 2009 estimate. |
| 111 | Mali | -446 000 000$ | 2007 estimate. |
| 112 | Papua New Guinea | -446 400 000$ | 2009 estimate. |
| 113 | Moldova | -464 600 000$ | 2009 estimate. |
| 114 | Malta | -491 000 000$ | 2009 estimate. |
| 115 | Fiji | -507 000 000$ | 2007 estimate. |
| 116 | Costa Rica | -537 000 000$ | 2009 estimate. |
| 117 | Guinea | -538 000 000$ | 2009 estimate. |
| 118 | Madagascar | -561 000 000$ | 2009 estimate. |
| 119 | Haiti | -627 000 000$ | 2009 estimate. |
| 120 | Benin | -644 000 000$ | 2009 estimate. |
| 121 | Macedonia | -645 600 000$ | 2009 estimate. |
| 122 | Mauritius | -674 600 000$ | 2009 estimate. |
| 123 | Slovenia | -732 400 000$ | 2009 estimate. |
| 124 | Botswana | -762 000 000$ | 2009 estimate. |
| 125 | Zimbabwe | -807 500 000$ | 2009 estimate. |
| 126 | Nicaragua | -841 100 000$ | 2009 estimate. |
| 127 | Cambodia | -865 700 000$ | 2009 estimate. |
| 128 | Mozambique | -866 000 000$ | 2009 estimate. |
| 129 | Uganda | -875 200 000$ | 2009 estimate. |
| 130 | Jamaica | -876 000 000$ | 2009 estimate. |
| 131 | Montenegro | -1 102 000 000$ | 2007 estimate. |
| 132 | Cameroon | -1 137 000 000$ | 2009 estimate. |
| 133 | Congo, republic | -1 195 000 000$ | 2009 estimate. |
| 134 | Ghana | -1 199 000 000$ | 2009 estimate. |
| 135 | Tunisia | -1 234 000 000$ | 2009 estimate. |
| 136 | Georgia | -1 259 000 000$ | 2009 estimate. |
| 137 | Jordan | -1 270 000 000$ | 2009 estimate. |
| 138 | Bosnia and Herzegovina | -1 283 000 000$ | 2009 estimate. |
| 139 | Armenia | -1 326 000 000$ | 2009 estimate. |
| 140 | Honduras | -1 327 000 000$ | 2009 estimate. |
| 141 | Senegal | -1 356 000 000$ | 2009 estimate. |
| 142 | Serbia | -1 356 000 000$ | 2009 estimate. |
| 143 | Kenya | -1 611 000 000$ | 2009 estimate. |
| 144 | Angola | -1 668 000 000$ | 2009 estimate. |
| 145 | Ukraine | -1 732 000 000$ | 2009 estimate. |
| 146 | Tanzania | -1 746 000 000$ | 2009 estimate. |
| 147 | Albania | -1 845 000 000$ | 2009 estimate. |
| 148 | Equatorial Guinea | -1 883 000 000$ | 2009 estimate. |
| 149 | Cyprus | -1 915 000 000$ | 2009 estimate. |
| 150 | Ethiopia | -1 996 000 000$ | 2009 estimate. |
| 151 | Oman | -2 143 000 000$ | 2009 estimate. |
| 152 | Czech Republic | -2 146 000 000$ | 2009 estimate. |
| 153 | Chad | -2 305 000 000$ | 2009 estimate. |
| 154 | Dominican Republic | -2 328 000 000$ | 2009 estimate. |
| 155 | Yemen | -2 328 000 000$ | 2009 estimate. |
| 156 | Panama | -2 330 000 000$ | 2009 estimate. |
| 157 | Kosovo | -2 408 000 000$ | 2009 estimate. |
| 158 | Afghanistan | -2 475 000 000$ | 2009 estimate. |
| 159 | Sudan | -2 817 000 000$ | 2009 estimate. |
| 160 | Slovakia | -2 819 000 000$ | 2009 estimate. |
| 161 | Egypt | -3 195 000 000$ | 2009 estimate. |
| 162 | Croatia | -3 247 000 000$ | 2009 estimate. |
| 163 | Kazakhstan | -3 405 000 000$ | 2009 estimate. |
| 164 | Pakistan | -3 583 000 000$ | 2009 estimate. |
| 165 | New Zealand | -3 693 000 000$ | 2009 estimate. |
| 166 | Algeria | -4 185 000 000$ | 2009 estimate. |
| 167 | Bulgaria | -4 348 000 000$ | 2009 estimate. |
| 168 | Morocco | -4 958 000 000$ | 2009 estimate. |
| 169 | Colombia | -4 991 000 000$ | 2009 estimate. |
| 170 | Belarus | -6 402 000 000$ | 2009 estimate. |
| 171 | Ireland | -6 762 000 000$ | 2009 estimate. |
| 172 | Romania | -7 139 000 000$ | 2009 estimate. |
| 173 | Vietnam | -7 440 000 000$ | 2009 estimate. |
| 174 | Lebanon | -7 555 000 000$ | 2009 estimate. |
| 175 | Poland | -9 598 000 000$ | 2009 estimate. |
| 176 | Mexico | -10 120 000 000$ | 2009 estimate. |
| 177 | South Africa | -11 300 000 000$ | 2009 estimate. |
| 178 | Türkiye | -13 940 000 000$ | 2009 estimate. |
| 179 | Iraq | -19 900 000 000$ | 2009 estimate. |
| 180 | United Kingdom | -23 650 000 000$ | 2009 estimate. |
| 181 | Portugal | -23 950 000 000$ | 2009 estimate. |
| 182 | Brazil | -24 300 000 000$ | 2009 estimate. |
| 183 | India | -26 630 000 000$ | 2009 estimate. |
| 184 | Greece | -34 430 000 000$ | 2009 estimate. |
| 185 | Canada | -38 080 000 000$ | 2009 estimate. |
| 186 | Australia | -41 330 000 000$ | 2009 estimate. |
| 187 | France | -51 860 000 000$ | 2009 estimate. |
| 188 | Italy | -66 200 000 000$ | 2009 estimate. |
| 189 | Spain | -80 380 000 000$ | 2009 estimate. |
| 190 | United States | -378 400 000 000$ | 2009 estimate. |
News
Investing.com - Asian stocks rose on Monday, although trading was lighter than usual as markets in China are closed and U.S. markets prepare for the Day holiday.
Investing.com - Asian shares posted mixed results on Wednesday, with shares on the Tokyo Stock Exchange falling as the yen strengthened and investors remained cautious due to the yen.
Investing.com - The dollar fell in Asian trading on Wednesday, weighed down by growing concerns over the trade dispute between the United States, China and South Korea.
The trade balance with Japan indicates the prospects for the eastern direction
Almaty. the 25th of October. KazTAG - Tulkin Tashimov.
A positive balance of $254 million in trade with Japan indicates the prospects of the eastern direction, says Anton Bugaenko, an expert at the Institute of World Economy and Politics (IMEP).
“In January-August 2021, trade turnover between Kazakhstan and Japan amounted to $1.14 billion, of which $697 million was export, and $443 million was import. Simple calculations show that the trade surplus is $254 million, which means that Kazakhstan’s prospects for the eastern direction are very attractive,” Bugaenko commented for MIA KazTAG on the visit of the first President of Kazakhstan, Nursultan Nazarbayev, to Japan.
As for the main export positions of Kazakhstan, the expert continues, they are mainly oil and metals.
“Regarding supply logistics, it is necessary to understand that Kazakh oil is mainly physically transported to the west via pipelines, and then reaches the world market, including Japan. This is the most effective way to supply oil, so I see no reason to look for alternative routes,” the agency’s interlocutor believes.
As for metals, the speaker added, it is indeed possible to reduce the time for their delivery to Japan by using the Kazakh terminal of the Chinese port of Lianyungang.
Girl Greta is used by adult uncles 05/17/2021 15:303640
“Delivery by rail to a Chinese port, and from there to Japan, I am sure, will significantly reduce our transportation costs,” Bugaenko emphasized.
As for the sea route through which the main flow of goods and raw materials passes between Kazakhstan and Japan, the expert strongly doubts its vulnerability.
“When talking about reliability, it is necessary to imagine what threats may arise on the routes used. When it comes to shipping, geopolitical complications can typically be a major issue, resulting in traffic being compromised and routes being blocked. I do not agree that such a possibility exists, since this would mean serious consequences for the entire world economy. Not a single truly strong and responsible government will take such a step that could lead to a general economic collapse,” the agency’s interlocutor is convinced.
As for the promising land route through China, the speaker explains, there really is a risk associated with the periodic aggravation of relations between China and Japan.
“But if such an aggravation occurs, then Kazakhstan can use the traditional Western supply route without major losses,” the speaker emphasizes.
...Plus the renovation of the entire country! 05/18/2021 09:004639
When asked whether Japan can use the territory of Kazakhstan for the transit of goods, the expert repeated that “the main condition for the use of Kazakh territory by Japanese business for transit purposes is good relations between China and Japan.”
“And these relations should not just be good, but at the level of strategic partnership. Currently, both countries are far from this, although there is still a positive trend,” the interlocutor noted.
Meanwhile, the expert specifies, the cost of transshipment of goods in this way directly depends on the quality of the infrastructure.
“Moreover, this concept includes not only, and not so much the quality of infrastructure facilities itself, but the creation of optimal logistics systems and the maximum reduction of barriers at the borders,” noted Bugaenko.
When asked whether the transition of power, which, according to political scientists, has not yet been completed, could prevent Japanese companies from investing in the Kazakh economy, the expert replied that “Japanese companies are ready to invest where it will be profitable.”
Curiosities of “childhood happiness” in Kazakhstan 05/18/2021 16:303006
“The Kazakh market represents a certain benefit, and this can be seen from the activity of Japanese business, which invested $5.9 billion in the economy of Kazakhstan,” the expert said.
At the same time, the speaker clarified, the issue of the transit of power in Kazakhstan is not in first place among the concerns of Japanese investors thinking about long-term projects.
“There are no risks for them in the transit of power or in any other political processes, simply because these investments are far from politics and pursue exclusively economic goals. The only significant risk for Japanese and other foreign companies may be events leading to a narrowing of the Kazakh market - the main interest and source of profit from investments,” Bugaenko concluded.
It was previously reported that Nazarbayev participated in the enthronement ceremony of Emperor Naruhito on October 22. He then met with Japanese Prime Minister Shinzo Abe and received an honorary doctorate from the University of Tsukuba.
Analytics
Although life lately has been of such a stormy and unpredictable nature that all assessments, plans, expectations and models very often go sideways, and every time there is a feeling of being controlled.
At the beginning of the week, markets were once again boosted by vaccine news. Thus, Moderna (NASDAQ:MRNA), following Pfizer (NYSE:PFE), presented strong interim results from testing its vaccine: po.
A few recaps from the previous week. The Moscow Exchange index fell from 2679.71 points to 2615.20 points, and the RTS corrected from 1289.47 points to 1239.81 points. The EUR/USD pair fell from $1.1202 to $1.109. The USD/RUB pair rose from.
Discussion - Trade Balance
Participate in the forum to interact with users, share your opinions and ask questions to other members or authors. Please use standard writing style and adhere to our guidelines.
- Posting links, advertising and spam;
- Profanity, as well as replacing letters with symbols;
- Insults towards forum participants and authors;
- Inciting ethnic and racial hatred;
- Comments containing capital letters.
- Comments are allowed only in Russian.
Source
Japan trade balance (seasonally adjusted)
Japan trade balance (seasonally adjusted)
| Date of issue | Time | Fact. | Forecast | Prev. |
| 19.04.2021 | 02:50 | 0.30T | -0.01T | |
| 17.03.2021 | 02:50 | -0.04T | 0.55T | |
| 17.02.2021 | 02:50 | 0.39T | 0.51T | |
| 21.01.2021 | 02:50 | 0.48T | 0.55T | |
| 16.12.2020 | 02:50 | 0.57T | 0.36T | |
| 18.11.2020 | 02:50 | 0.31T | 0.11T | 0.44T |
Japan's trade balance showed deficit for the first time in 3 years
The trade deficit for the entire financial year amounted to 1.59 trillion yen (almost $14.2 billion), according to a published report by the Ministry of Finance of the Land of the Rising Sun.
At the same time, in the past fiscal year (April 2021 – March 2019), Japan’s trade surplus with the United States amounted to 6.53 trillion yen (almost $58.31 billion), decreasing by 6.7% compared to the same period a year earlier.
Earlier, Japan and the United States began trade negotiations due to Washington's concerns about the trade deficit with Japan, which is primarily associated with automobile exports.
Japan's trade surplus fell 33% in March 2021 as exports fell 2.4% year-on-year due to lower shipments of steel and liquid crystal displays to China, as well as increased imports of aircraft, clothing and liquefied natural gas (LNG).
Let us recall that in March 2021, Japan entered into the Comprehensive and Progressive Agreement for Trans-Pacific Partnership, which was signed in Chile and includes the provisions of the earlier Trans-Pacific Partnership (TPP) agreement, which collapsed after the US withdrew from it.
As a result of the agreement and the reduction of tariffs against the backdrop of rising oil prices, Japan's imports increased significantly. At the same time, its exports, on which the entire economy of the country depends, have decreased quite significantly due to weakened demand. At the same time, experts say that Japan's export volumes may continue to decline.
Marcel Thieliant, senior Japan analyst at British consultancy Capital Economics, writes that “export growth is not expected to return as GDP growth in Japan’s main trading partners slows from 3.2% in the fourth quarter of last year to 2.4% in the fourth quarter of last year.” this year." At the same time, he predicts a further decline in Japanese exports by 0.5%.
►
The Bank of Japan may further reduce rates.
Earlier, the head of the Bank of Japan, Haruhiko Kuroda, said that the Central Bank of the Land of the Rising Sun is considering further easing of monetary policy, in particular, the possibility of reducing interest rates below the current level (-0.1%).
“Interest rates in Japan are currently minus 0.1%. The rate on 10-year Japanese government bonds is around 0%. But we can continue to reduce interest rates,” he said.
News
Investing.com - Global financial markets will be focused next week on the outcome of Thursday's European Central Bank meeting. Market players.
Investing.com - Japan's trade surplus fell last month, contrary to expectations. This is evidenced by official data released on Sunday. According to the report.
Investing.com - Japan's trade surplus fell more than expected last month. This is evidenced by official data released on Wednesday. According to the report.
Analytics
The US stock market is recovering from the previous week's decline but remains under pressure below its highs. The 10-year government bond yield returned to 3%. The dollar rose, but remained.
Events of the past week The four largest US stock indices (S&P 500, Dow, NASDAQ and Russell 2000) showed growth last Friday, finishing stronger for the third week in a row. Bullish.
Discussion - Seasonally Adjusted Trade Balance
Participate in the forum to interact with users, share your opinions and ask questions to other members or authors. Please use standard writing style and adhere to our guidelines.
- Posting links, advertising and spam;
- Profanity, as well as replacing letters with symbols;
- Insults towards forum participants and authors;
- Inciting ethnic and racial hatred;
- Comments containing capital letters.
- Comments are allowed only in Russian.
Source
Analysis of the development of Japan's foreign trade over the past decade and prospects for future development
Bibliographic description:
Merkulov, K. A. Analysis of the development of Japanese foreign trade over the last decade and prospects for development in the future / K. A. Merkulov.
— Text: immediate // Problems and prospects of economics and management: materials of the I International. scientific conf. (St. Petersburg, April 2012). - St. Petersburg: Renome, 2012. - pp. 213-216. — URL: https://moluch.ru/conf/econ/archive/15/2217/ (access date: 05.26.2021). The country, poor in natural resources, has been able to integrate very successfully into the world economy in recent years. Initially, Japan turned into a global manufacturing center, and then high-tech industries developed. Today Japan is one of the most significant trading powers in the modern economy. Japan's economy is largely dependent on the import of fuel and industrial raw materials. Today, the structure of imports has changed significantly: priority has been placed on the import of more finished products than on the import of raw materials. It should be noted that Japan at all stages of its formation was characterized by a positive trade balance. However, Japan's foreign trade surplus, which has provided an influx of finance into the country's economy for many years, is trending downward. Over the past fiscal year, the Japanese economy grew by 2.3% [8].
The Japanese economy is aimed at creating favorable foreign economic relations with the aim of developing and creating a competitive state. The country's economy is characterized by a foreign trade orientation. The foreign trade indicator per capita in Japan (in 2010 - 12,189.37 US dollars [5]) cannot be called large due to the fact that the volume of trade turnover is high, and Japan ranks tenth in the world in terms of population.
Japan is the third largest trading nation in the modern economy. Foreign trade plays a vital role in a country devoid of natural resources. The scale of exports far exceeds the level necessary to accumulate foreign currency for imports. 98.6% of all sales to other countries are from finished industrial products, including 74.1% from machinery and equipment. In terms of foreign trade turnover in 2009 (1006.9 billion US dollars) it is second only to the USA, Germany and China (2439.7, 2209 and 2.115 billion US dollars, respectively). Products produced by foreign representative offices of Japanese corporations are sold mainly in local markets, but are also supplied to Japan [3,12].
In general, the global financial and economic crisis had a significant impact on the economic development of Japan. It took a lot of effort to get back on the path to active development, and the growth rate is constantly increasing. Thus, in 2011, foreign trade turnover, calculated using the balance of payments methodology, reached $1,595.5 billion compared to $1,006.9 in 2009.
Dynamics of development of Japan's foreign trade for 2002–2010. [5]
| 2002 | 2003 | 2004 | 2005 | 2006 | 2007 | 2008 | 2009 | 2010 | |
| Foreign trade turnover (million US dollars) | 858718 | 752805 | 753939 | 855084 | 1020335 | 1109974 | 1229557 | 1329513 | 1549009 |
| Export (million US dollars) | 479227 | 403616 | 416730 | 471999 | 565743 | 594986 | 649948 | 709668 | 786434 |
| Imports (millions of US dollars) | 379491 | 349189 | 337209 | 383085 | 454592 | 514988 | 579609 | 619845 | 762575 |
| Coverage Ratio (%) | 126,3 | 115,6 | 123,6 | 123,2 | 124,5 | 115,5 | 112,1 | 114,5 | 103,1 |
| Japan's share of world exports | 7,9 | 6,9 | 5,1 | 6,7 | 6,5 | 6,1 | 5,7 | 5,5 | 5,2 |
| Japan's share of world imports | 6,0 | 5,8 | 5,4 | 5,3 | 5,3 | 5,2 | 5,1 | 4,7 | 4,9 |
Between 2002 and 2010, Japan's foreign trade almost doubled, but growth was unstable. This is especially noticeable in 2003 and 2004. The volume of foreign trade fell first from 858,718 billion US dollars in 2002 to 752,805 billion US dollars in 2003, and then settled at 753,939 billion US dollars in 2004. The data is due to a decrease in both both exports and imports of Japan over these years. Japan was able to overcome the 2002 figure only in 2006. Subsequently, the foreign trade turnover rate increased between 2006 and 2010. It should be noted that throughout the development of Japan's foreign trade, the coverage ratio exceeded 100%, which indicates that exports exceeded imports. But at the same time, the value of the coverage ratio gradually decreased, in 2002 the figure was 126.3%, and in 2009 it was 114.5%, which certainly indicates an increasing role of imports in the Japanese economy. In 2010, the coverage ratio was 103.1%, in connection with which it can be noted that in the near future it is possible that imports in Japan's foreign trade turnover will have a dominant role. The country's share in world exports in the time period from 2002 to 2010. gradually decreased, while at the same time the volume of exports itself increased. The same thing happened with Japanese imports. From this it should be noted that Japan, despite its gradual growth, is losing its dominant position, countries such as China are increasingly strengthening their positions and gaining a foothold in the modern economy.
Just like in Russia, the growth in the value of imports before the onset of the global financial and economic crisis was due to the presence of effective demand in the domestic market, but at the same time, trade on the foreign market occupied a very large sector. Record quantitative indicators of export-import activity were achieved by the country over the past 2011 (1595.5 billion US dollars). Despite the economic crisis, Japan has continued to successfully develop its economy since 2006. The main items of imported goods are machinery and equipment, fuel, food, chemicals, textiles, ores and other raw materials. It was the reduction in demand in the country’s domestic markets for these categories of products, mostly for machinery and equipment, that formed the bulk of the decreased volume of imports in the period from 2003 to 2004. Japan primarily imports mineral fuels (oil, coal, gas), accounting for 27.7% of total imports. Imports of electronics account for 12.8%, industrial goods – 9.7%, machinery – 9.3%. Japan also imports food (8.5%), chemical products (7.3%) and raw materials (7%) [6].
Exports and their commodity structure, just like in the 2000s, are tied to the export of finished products from the country. The main groups of goods for which there has been increased demand in recent years are: transport equipment, vehicles, electronics, electrical engineering, and chemical products. Japan took first place in the world in the production of a number of electrical and radio products, steel, while having neither ore, nor coal, etc. Japan's foreign economic activity is characterized by commodity saturation and large volumes of trade turnover. In the commodity-industrial structure of Japanese exports for the last 2011, transport equipment dominates (24.2%), a slightly smaller share of exports falls on electrical engineering and electronics (21.4%) and mechanical engineering (19.7%). Industrial products (including steel and cast iron products, as well as non-ferrous metals, textile thread and fabric) account for 11.5%, and chemical products - 9% [8].
In terms of average annual growth rates, the most dynamically developing items of Japan's exports are non-food raw materials (except fuel) and goods and transactions not included in the relevant sections of the SMTC, although their share in Japan's total exports remains relatively low.
The record quantitative indicators of export-import activity achieved in recent years cannot be considered as unambiguously positive, since negative aspects associated with foreign trade remain, and some of them have even intensified. In particular, the decreasing role of Japan compared to a number of other countries. At the same time, Japanese goods are characterized by high competitiveness. The main positive quality of Japanese products is the fact that the amount of defects is no more than 0.01% of manufactured products. Rapid growth in labor productivity, significantly less loss of working time in the event of certain conflicts, the highest level of private savings also play an important role in strengthening Japan’s position in the modern world economy [1].
Today, in the post-crisis period, large Japanese companies are faced with enormous problems in the export market. Capital investment is being reduced and product inventories are being reduced due to the expectation of a long recession and a decrease in exports. By the end of fiscal year 2009, there were massive layoffs across all sectors of the economy. Employers in Japan Toyota Motor Corp., Komatsu Ltd., Sharp Corp., Sony Corp. cut their jobs. Today the situation is changing slowly but purposefully; the unemployment rate in Japan in July 2011 was 4.7%
Japan's GDP in the third quarter of 2010, according to final data, decreased by 0.5% compared to the previous quarter. At the same time, the year-on-year decline in GDP was 1.8%. At the same time, today Japan ranks third in the world in terms of GDP (USD 5,458 billion). By sector, Japan's GDP is divided into agriculture - 1.5%, industry - 22.8%, and services - 75.7%. Over the past year, the country's GDP decreased by 0.2%. At the same time, investments in the non-state sector decreased by 2.0% [5].
The extremely high concentration of Japan's imports on a narrow group of fuel and raw materials makes the country's economy very sensitive to fluctuations in the global market and limits the possibilities of effective participation in the international division of labor. Every year, the Japanese economy becomes more and more dependent on world energy prices (primarily oil) and becomes an increasingly greater threat to the socio-economic stability in the country. The same thing happens with the import of raw materials; the import of products for the manufacturing industry in Japan plays a very significant role.
One of the favorable features of Japanese manufacturing exports is that most of them are high-tech products.
Japan's main foreign trade partners are: China, the USA, Western European countries, and Southeast Asian countries. Japan actively cooperates with China; exports there grew by 17.5% in 2010, and imports increased by 9.8%. Ultimately, in 2010 the trade balance with China turned out to be positive. Exports to the USA grew by only 4.8% in 2010, but imports showed even more negative dynamics - they decreased by 6.5% over the year. Exports to Western Europe in 2010, compared to 2009, did not change, and imports decreased by 0.4%. To a large extent, the growth in imports was caused by rising prices for resources; exports over the last 3 months of 2010 were stable, but even today there are risks of the situation worsening, because the effect of the yen's growth is still far from being worked out. The risks of instability in the Japanese economy will increase. [7]
The current specialization of Japan in the international division of labor in the supply of finished products is a completely objective phenomenon. It reflects the geographical situation of Japan, in particular the lack of a number of useful resources in the country. Japan's export industries are the strongest and most efficient in the modern economy, which is why a decline in exports would impact Japan's productivity levels, economic growth and prosperity, which would certainly challenge the country's economic leadership.
The increase in demand for export goods annually strengthens the competitiveness of Japanese goods in the transport and knowledge-intensive industries, which is gradually increasing due to their high quality and price advantages.
In the structure of Japan's foreign trade, the main place as the largest economic partner is occupied by China, which accounted for the largest part of the country's foreign trade turnover in the period under review. In 2010, exports to China amounted to 18.88%, imports - 22.2%.
A priority area in Japan's foreign economic policy, which has a significant impact on the development of the Japanese economy, is economic cooperation with countries such as China and the USA. In the period under review, Japan’s trade and economic relations with these countries developed rather unevenly, but in general there are visible trends towards a significant increase in the share of exports and imports to these countries.
The main trends in the development of Japan's foreign trade sector in 2002-2012, identified as a result of the analysis. actually boil down to the following: on the one hand, there is an increase in quantitative indicators characterizing its condition, overshadowed by the recession of 2003 and 2004. and also the crisis phenomenon that began in 2008. At the same time, a constant improvement in the qualitative characteristics of the state of Japan's foreign trade is obvious. In general, the foreign economic sector is developing dynamically, sensitively responding to environmental changes. However, to optimize its structure, it is necessary to develop a strategically oriented set of measures. Some sectors of Japanese industry, such as the production of synthetic fibers and ferrous metallurgy, are gradually curtailing their capacity and reorienting themselves to the production of more expensive individual and small-scale high-tech products, such as medicines, rockets, microprocessors, software, biotechnology, i.e. are switching to industries that are seen by many as the last bastion of American superiority.
In addition, Japan cannot afford to discount competitors such as Australia, which has a long history of strong economic performance, the ASEAN countries of Malaysia, Thailand and Indonesia, which have sufficient development potential, as well as newly industrialized countries in other regions world, such as Brazil. Feeling "isolated" from the rest of the world may become an obstacle to Japan becoming a world leader.
Japan is a country with developed foreign trade, but at the same time, it has not yet become a country with developed international thinking and an appropriate organization [4]. At the beginning of the 22nd century, Japan faces the need to return to a sustainable economy and retain its place as one of the leaders in the world economy.
Literature:
- Economic survey of Japan 2008: Reforming the labor market to cope with increasing dualism and population aging.
- Europe Japan Centre, Kaizen Strategies for Improving Team Performance, Ed. Michael Colenso, London: Pearson Education Limited, 2000
- International Journal of Theory and Policy “Japan and the World Economy” June 2010
- Japan - Economic forecast summary (November 2011) URL: https://www.oecd.org
- CIA World Factbook, US Central Intelligence Agency, 2000 to 2012 assessment. URL: https://www.cia.gov/library/publications/the-world-factbook/geos/ja.html
- Official website of the World Bank. URL: https://worldbank.org
- Official website of the International Monetary Fund, World Economic Outlook Database. URL: https://www.imf.org
- Official website of the Japanese Bureau of Statistics. URL: https://www.stat.go.jp
Key terms
(automatically generated)
: Japan, USA, China, Japan's foreign trade, foreign trade, Japanese economy, dollars, modern economy, finished products, coverage ratio.
With which countries and what goods does Japan trade?
In 2021, Japan exported goods totaling US$705 billion. In terms of export volume in monetary terms, the “land of the rising sun” ranked fifth in the world, behind China, the USA, Germany and the Netherlands.
At the same time, the Japanese imported goods worth US$720 billion, thereby recording a negative trade balance of US$15 billion.
The largest trading partners, both in export and import, were:
1. China
: Export - $134.7 billion. Import - - $169.2 billion.
2. USA
: Export - $81.2 billion. Import - - $140.5 billion.
3. South Korea
: Export - $26.9 billion. Import - - $46.3 billion.
The Japanese traded most profitably (they sold for more than they bought) with:
1. USA
+ $59.3 billion
2. South Korea
+ $19.4 billion
3. Taiwan
$16.1 billion
And Japan had the largest trade deficit in merchandise trade with the following countries:
1. China
$ -34.5 billion
2. Australia
— $30.1 billion.
3. Saudi Arabia
— $22.6 billion.
The ten largest trading partners of Japan in 2021 were distributed as follows:
Russia would take 16th place in this ranking. In 2021, our country exported goods worth 11.35 billion US dollars to Japan and imported 8.96 billion. Thus, the trade balance became positive for Russia and amounted to 2.39 billion US dollars.
We sold the following products to Japan:
Mineral products
— 75.77% of the total volume of Russian exports to Japan.
Wood and pulp and paper products
— 4,43%.
Food products and agricultural raw materials
— 2,90%.
On the other hand, the following Japanese goods were in demand in our country:
Machinery, equipment and vehicles
— 78.84% of Russia’s total imports from Japan.
Chemical industry products
— 12,39% .
In terms of global trade, Japan's strongest industries continue to be the automotive and shipbuilding industries, heavy equipment manufacturing (bulldozers, excavators, etc.), as well as the production of integrated circuits, semiconductors, semiconductor manufacturing equipment, and copying devices. print.
If the Japanese industry confidently holds its positions in the automotive and shipbuilding industries, then in electronics it is slowly but surely losing them year by year. The beneficiaries of this are China, Taiwan and South Korea.
Trade turnover between Russia and Japan
In 2021, trade turnover between Russia and Japan
amounted to $20,313,340,792, a decrease of 4.51% ($959,295,086) compared to 2021.
Russian exports to Japan in 2021
was $11,353,033,488, a decrease of 8.84% ($1,100,385,095) compared to 2021.
Russian imports from Japan in 2021
was $8,960,307,304, an increase of 1.60% ($141,090,009) compared to 2021.
Trade balance between Russia and Japan in 2021
there was a positive amount of USD 2,392,726,184. Compared to 2021, the positive balance decreased by 34.16% ($1,241,475,104).
Japan's share in Russia's foreign trade turnover in 2019
amounted to 3.0475% versus 3.0914% in 2021. In terms of share in Russian trade turnover in 2021, Japan took 9th place (10th place in 2018).
Japan's share in Russian exports in 2021
amounted to 2.6853% versus 2.7676% in 2021. In terms of share in Russian exports in 2021, Japan took 12th place (in 2021 - 11th place).
Japan's share in Russian imports in 2021
amounted to 3.6756% versus 3.7032% in 2021. In terms of share in Russian imports in 2021, Japan took 6th place (in 2021 – 7th place).
Let's look at Japanese net exports of goods in 2021.
Net Exports = Exports - Imports
The top three included:
1. Cars
+ $85.8 billion
2. Automotive parts
+ $24.6 billion
3. Semiconductor Manufacturing Equipment
+ $18.9 billion
In total, in Japanese trade in 2021 there were only 10 items of goods that brought the Japanese more than 5 billion US dollars.
Net exports of Japanese goods in 2021:
Gold sales came here, displacing piston engines from their usual place.
Russian export to Japan
In the structure of Russian exports to Japan in 2021 (and in 2019), the main share of supplies fell on the following types of goods:
- Mineral products (HS codes 25-27) - 70.23% of the total volume of Russian exports to Japan (in 2021 - 75.77%);
- Precious metals and stones (HS code 71) - 12.05% of the total volume of Russian exports to Japan (in 2021 - 7.80%);
- Metals and products made from them (HS codes 72-83) - 7.90% of the total volume of Russian exports to Japan (in 2021 - 6.82%);
- Wood and pulp and paper products (HS codes 44-49) - 4.44% of the total volume of Russian exports to Japan (in 2021 - 4.43%);
- Food products and agricultural raw materials (HS codes 01-24) - 3.16% of the total volume of Russian exports to Japan (in 2019 - 2.90%);
- Products of the chemical industry (HS codes 28-40) - 1.41% of the total volume of Russian exports to Japan (in 2021 - 1.13%).
The largest increase in Russian exports to Japan in 2021 compared to 2021 was recorded for the following product groups:
- Natural or cultured pearls, precious or semi-precious stones, precious metals, metals clad with precious metals, and products made from them; bijouterie; coins (HS code 71) - increase by USD 205,962,097;
- Aluminum and products made from it (HS code 76) - increase by USD 47,927,242;
- Nuclear reactors, boilers, equipment and mechanical devices; their parts (HS code 84) - an increase of USD 29,099,129.
The largest reduction in Russian exports to Japan in 2021 compared to 2021 was recorded for the following product groups:
- Mineral fuel, oil and their distillation products; bituminous substances; mineral waxes (HS code 27) - reduction by USD 2,242,379,058;
- Ferrous metals (HS code 72) - reduction by USD 106,253,842;
- Wood and products made from it; charcoal (HS code 44) - reduction by USD 99,979,225;
- Fish and crustaceans, molluscs and other aquatic invertebrates (HS code 03) - reduction by USD 36,941,222.
Russian exports to Japan in 2021 by product groups
| HS Code | Name of product group | Exports in 2021, US dollars | Share in total exports, % | Exports in 2021, US dollars | Changes in 2021 relative to 2021, % |
| 01 | Live animals | 0 | 0,00 | 9 580 | -100,00 |
| 02 | Meat and edible meat by-products | 429 588 | 0,00 | 315 102 | 36,33 |
| 03 | Fish and crustaceans, molluscs and other aquatic invertebrates | 250 755 986 | 2,77 | 287 697 208 | -12,84 |
| 04 | Milk products; bird eggs; natural honey; edible products of animal origin, not elsewhere specified or included | 63 166 | 0,00 | 30 042 | 110,26 |
| 05 | Animal products not elsewhere specified or included | 894 428 | 0,01 | 1 156 164 | -22,64 |
| 06 | Living trees and other plants; bulbs, roots and other similar parts of plants; cut flowers and decorative foliage | 9 527 | 0,00 | 11 682 | -18,45 |
| 07 | Vegetables and some edible roots and tubers | 1 190 938 | 0,01 | 1 665 712 | -28,50 |
| 08 | Edible fruits and nuts; citrus fruit peel or melon rind | 0 | 0,00 | 16 470 | -100,00 |
| 09 | Coffee, tea, mate, or Paraguayan tea, and spices | 38 993 | 0,00 | 33 025 | 18,07 |
| 10 | Cereals | 17 271 629 | 0,19 | 35 720 417 | -51,65 |
| 11 | Products of the flour and cereal industry; malt; starches; inulin; wheat gluten | 736 620 | 0,01 | 33 431 | 2 103,40 |
| 12 | Oilseeds and fruits; other seeds, fruits and grains; medicinal plants and plants for technical purposes; straw and fodder | 1 942 251 | 0,02 | 805 097 | 141,24 |
| 13 | Natural shellac, unrefined; gums, resins and other plant juices and extracts | 0 | 0,00 | 1 250 | -100,00 |
| 14 | Plant materials for making wickerwork; other products of vegetable origin, not elsewhere specified or included | 1 | 0,00 | 0 | ∞ |
| 15 | Fats and oils of animal or vegetable origin and their breakdown products; prepared edible fats; waxes of animal or vegetable origin | 1 830 267 | 0,02 | 401 558 | 355,79 |
| 16 | Prepared products of meat, fish or crustaceans, molluscs or other aquatic invertebrates | 833 848 | 0,01 | 229 911 | 262,68 |
| 17 | Sugar and sugar confectionery | 257 908 | 0,00 | 13 791 | 1 770,12 |
| 18 | Cocoa and cocoa products | 405 205 | 0,00 | 107 837 | 275,76 |
| 19 | Prepared products from cereal grains, flour, starch or milk; flour confectionery products | 157 248 | 0,00 | 18 334 | 757,69 |
| 20 | Processed products of vegetables, fruits, nuts or other plant parts | 12 052 | 0,00 | 6 065 | 98,71 |
| 21 | Various food products | 403 508 | 0,00 | 334 460 | 20,64 |
| 22 | Alcoholic and non-alcoholic drinks and vinegar | 404 018 | 0,00 | 323 998 | 24,70 |
| 23 | Residues and waste from the food industry; ready-made animal feed | 2 798 | 0,00 | 169 813 | -98,35 |
| 24 | Tobacco and industrial tobacco substitutes | 8 382 481 | 0,09 | 393 591 | 2 029,74 |
| 25 | Salt; sulfur; earth and stone; plastering materials, lime and cement | 4 191 803 | 0,05 | 7 568 024 | -44,61 |
| 26 | Ores, slag and ash | 107 557 572 | 1,19 | 104 929 473 | 2,50 |
| 27 | Mineral fuel, oil and their distillation products; bituminous substances; mineral waxes | 6 247 614 884 | 69,00 | 8 489 993 942 | -26,41 |
| 28 | Inorganic chemical products; compounds, inorganic or organic, of precious metals, rare earth metals, radioactive elements or isotopes | 11 879 560 | 0,13 | 14 622 724 | -18,76 |
| 29 | Organic chemical compounds | 87 160 941 | 0,96 | 75 109 289 | 16,05 |
| 30 | Pharmaceutical products | 120 052 | 0,00 | 52 105 | 130,40 |
| 31 | Fertilizers | 11 092 631 | 0,12 | 8 994 938 | 23,32 |
| 32 | Tanning or dyeing extracts; tannins and their derivatives; dyes, pigments and other coloring substances; paints and varnishes; putties and other mastics; printing paint, ink, ink | 3 807 | 0,00 | 2 732 | 39,35 |
| 33 | Essential oils and resinoids; perfume, cosmetic or toilet preparations | 2 090 743 | 0,02 | 1 299 669 | 60,87 |
| 34 | Soaps, organic surfactants, detergents, lubricants, artificial and prepared waxes, scouring or polishing compounds, candles and similar articles, modeling pastes, plasticine, “dental wax” and dental compositions based on plaster | 22 192 | 0,00 | 33 551 | -33,86 |
| 35 | Protein substances; modified starches; adhesives; enzymes | 2 397 | 0,00 | 6 848 | -65,00 |
| 38 | Other chemical products | 1 590 898 | 0,02 | 3 073 376 | -48,24 |
| 39 | Plastics and products made from them | 404 122 | 0,00 | 1 112 671 | -63,68 |
| 40 | Rubber, rubber and products made from them | 13 319 778 | 0,15 | 24 326 461 | -45,25 |
| 42 | Leather products; saddlery and harness; travel accessories, handbags and similar products; products made from animal intestines (except silkworm fibroin fiber) | 18 241 | 0,00 | 35 435 | -48,52 |
| 43 | Natural and artificial fur; products made from it | 0 | 0,00 | 5 438 | -100,00 |
| 44 | Wood and products made from it; charcoal | 366 400 007 | 4,05 | 466 379 232 | -21,44 |
| 45 | Cork and products made from it | 0 | 0,00 | 242 | -100,00 |
| 47 | Pulp of wood or other fibrous cellulosic materials; regenerated paper or cardboard (waste paper and waste) | 35 061 202 | 0,39 | 35 775 998 | -2,00 |
| 48 | Paper and cardboard; products made from paper pulp, paper or cardboard | 213 550 | 0,00 | 336 438 | -36,53 |
| 49 | Printed books, newspapers, reproductions and other products of the printing industry; manuscripts, typescripts and plans | 250 160 | 0,00 | 292 882 | -14,59 |
| 52 | Cotton | 2 317 | 0,00 | 0 | ∞ |
| 53 | Other vegetable textile fibers; paper yarn and fabrics made from paper yarn | 0 | 0,00 | 3 | -100,00 |
| 54 | Chemical threads; flat and similar yarns of chemical textile materials | 129 034 | 0,00 | 90 095 | 43,22 |
| 55 | Chemical fibers | 0 | 0,00 | 422 001 | -100,00 |
| 56 | Cotton wool, felt or felt and non-woven materials; special yarn; twine, ropes, ropes and cables and products made from them | 85 826 | 0,00 | 1 551 | 5 433,59 |
| 57 | Carpets and other textile floor coverings | 437 | 0,00 | 675 | -35,26 |
| 58 | Special fabrics; tufted textile materials; lace; tapestries; Decoration Materials; embroidery | 7 952 | 0,00 | 8 823 | -9,87 |
| 59 | Textile materials, impregnated, coated or laminated; textile products for technical purposes | 145 482 | 0,00 | 0 | ∞ |
| 60 | Knitted or crocheted fabrics | 1 745 | 0,00 | 1 103 | 58,20 |
| 61 | Articles of clothing and clothing accessories, knitted or crocheted | 297 361 | 0,00 | 382 772 | -22,31 |
| 62 | Items of clothing and clothing accessories, except knitted or hand-knitted items | 144 696 | 0,00 | 1 775 680 | -91,85 |
| 63 | Other finished textile products; sets; used clothing and textiles; rags | 677 980 | 0,01 | 300 822 | 125,38 |
| 64 | Shoes, gaiters and similar articles; their details | 935 311 | 0,01 | 1 337 679 | -30,08 |
| 65 | Hats and their parts | 9 266 | 0,00 | 9 111 | 1,70 |
| 66 | Umbrellas, sun umbrellas, walking sticks, seat sticks, whips, riding crops and parts thereof | 0 | 0,00 | 54 | -100,00 |
| 68 | Articles made of stone, plaster, cement, asbestos, mica or similar materials | 364 418 | 0,00 | 36 150 | 908,07 |
| 69 | Ceramic products | 83 349 | 0,00 | 42 456 | 96,32 |
| 70 | Glass and products made from it | 1 218 495 | 0,01 | 862 759 | 41,23 |
| 71 | Natural or cultured pearls, precious or semi-precious stones, precious metals, metals clad with precious metals, and products made from them; bijouterie; coins | 1 091 165 618 | 12,05 | 885 203 521 | 23,27 |
| 72 | Black metals | 137 935 219 | 1,52 | 244 189 061 | -43,51 |
| 73 | Ferrous metal products | 864 949 | 0,01 | 884 336 | -2,19 |
| 74 | Copper and products made from it | 496 706 | 0,01 | 162 689 | 205,31 |
| 75 | Nickel and products made from it | 3 636 851 | 0,04 | 1 179 425 | 208,36 |
| 76 | Aluminum and products made from it | 558 834 158 | 6,17 | 510 906 916 | 9,38 |
| 79 | Zinc and products made from it | 0 | 0,00 | 340 | -100,00 |
| 81 | Other base metals; metal ceramics; products made from them | 13 857 150 | 0,15 | 16 614 825 | -16,60 |
| 82 | Tools, utensils, cutlery, spoons and forks made of base metals; their parts are made of base metals | 28 332 | 0,00 | 31 396 | -9,76 |
| 83 | Other products made of base metals | 12 081 | 0,00 | 18 621 | -35,12 |
| 84 | Nuclear reactors, boilers, equipment and mechanical devices; their parts | 48 396 977 | 0,53 | 19 297 848 | 150,79 |
| 85 | Electrical machines and equipment, their parts; sound recording and reproducing equipment, equipment for recording and reproducing television images and sound, their parts and accessories | 2 076 655 | 0,02 | 3 439 241 | -39,62 |
| 86 | Railway locomotives or tram motor cars, rolling stock and parts thereof; track equipment and devices for railways or tramways and parts thereof; mechanical (including electromechanical) signaling equipment of all types | 57 604 | 0,00 | 8 516 | 576,42 |
| 87 | Ground transport vehicles, except railway or tram rolling stock, and their parts and accessories | 3 964 023 | 0,04 | 2 577 013 | 53,82 |
| 89 | Vessels, boats and floating structures | 10 250 716 | 0,11 | 14 895 273 | -31,18 |
| 90 | Optical, photographic, cinematographic, measuring, control, precision, medical or surgical instruments and apparatus; their parts and accessories | 2 871 676 | 0,03 | 2 914 951 | -1,48 |
| 91 | Watches of all types and their parts | 101 229 | 0,00 | 35 230 | 187,34 |
| 92 | Musical instruments; their parts and accessories | 107 505 | 0,00 | 167 365 | -35,77 |
| 94 | Furniture; bedding, mattresses, mattress bases, cushions and similar stuffed furnishings; lamps and lighting fixtures not elsewhere specified or included; illuminated signs, illuminated name or address plates and similar products; prefabricated building structures | 782 089 | 0,01 | 1 153 602 | -32,20 |
| 95 | Toys, games and sports equipment; their parts and accessories | 274 880 | 0,00 | 476 199 | -42,28 |
| 96 | Various finished products | 32 086 | 0,00 | 9 063 | 254,03 |
| 97 | Artworks, collectibles and antiques | 941 | 0,00 | 10 081 | -90,67 |
| SS | Secret code | 250 876 | 0,00 | 80 140 236 | -99,69 |
Let's turn to pure imports.
Net imports = Imports - Exports
Everything is clear with the leaders - they are:
1. Raw oil
— $73 billion.
2. Natural gas
— $44.7 billion.
3. Coal
— $23.2 billion.
But here the differences from German foreign trade are clearly visible. Japan's TOP 10 includes a number of high-tech products, such as airplanes, medicinal mixtures, phones and computers.
The top 10 goods of pure Japanese imports were distributed as follows:
Source
Import of Russia from Japan
In the structure of Russian imports from Japan in 2021 (and in 2019), the main share of supplies fell on the following types of goods:
- Machinery, equipment and vehicles (HS codes 84-90) - 77.08% of the total volume of Russian imports from Japan (in 2019 - 78.84%);
- Chemical industry products (HS codes 28-40) - 14.18% of the total volume of Russian imports from Japan (in 2021 - 12.39%);
- Metals and products made from them (HS codes 72-83) - 3.38% of the total volume of Russian imports from Japan (in 2021 - 3.30%);
- Mineral products (HS codes 25-27) - 0.81% of the total volume of Russian imports from Japan (in 2021 - 1.38%).
The largest increase in Russian imports from Japan in 2021 compared to 2021 was recorded for the following product groups:
- Optical, photographic, cinematographic, measuring, control, precision, medical or surgical instruments and apparatus; their parts and accessories (HS code 90) - an increase of USD 78,621,321;
- Vessels, boats and floating structures (HS code 89) - increase by USD 33,302,564;
- Organic chemical compounds (HS code 29) - increase by USD 31,639,497;
- Miscellaneous food products (HS code 21) - increase by USD 23,314,510.
The largest reduction in Russian imports from Japan in 2021 compared to 2021 was recorded for the following product groups:
- Ground transport vehicles, except for railway or tram rolling stock, and their parts and accessories (HS code 87) - reduction by USD 1,205,118,205;
- Nuclear reactors, boilers, equipment and mechanical devices; their parts (HS code 84) - reduction by USD 359,975,814;
- Electrical machines and equipment, their parts; sound recording and sound reproducing equipment, equipment for recording and reproducing television images and sound, their parts and accessories (HS code 85) - reduction by $127,649,706;
- Rubber, rubber and products made from them (HS code 40) - reduction by USD 117,266,526;
- Mineral fuel, oil and their distillation products; bituminous substances; mineral waxes (HS code 27) - reduction by USD 66,297,903;
- Miscellaneous finished products (HS code 96) - reduction by USD 31,390,080;
- Products made of ferrous metals (HS code 73) - reduction by USD 26,685,017.
Russian imports from Japan in 2021 by product groups
| HS Code | Name of product group | Imports in 2021, US dollars | Share in total imports, % | Imports in 2021, US dollars | Changes in 2021 relative to 2021, % |
| 02 | Meat and edible meat by-products | 761 964 | 0,01 | 516 435 | 47,54 |
| 03 | Fish and crustaceans, molluscs and other aquatic invertebrates | 9 413 526 | 0,13 | 12 001 137 | -21,56 |
| 05 | Animal products not elsewhere specified or included | 0 | 0,00 | 16 980 | -100,00 |
| 06 | Living trees and other plants; bulbs, roots and other similar parts of plants; cut flowers and decorative foliage | 33 718 | 0,00 | 33 200 | 1,56 |
| 07 | Vegetables and some edible roots and tubers | 174 496 | 0,00 | 109 027 | 60,05 |
| 08 | Edible fruits and nuts; citrus fruit peel or melon rind | 23 930 | 0,00 | 16 220 | 47,53 |
| 09 | Coffee, tea, mate, or Paraguayan tea, and spices | 2 842 360 | 0,04 | 2 414 548 | 17,72 |
| 10 | Cereals | 673 279 | 0,01 | 502 711 | 33,93 |
| 11 | Products of the flour and cereal industry; malt; starches; inulin; wheat gluten | 172 352 | 0,00 | 116 083 | 48,47 |
| 12 | Oilseeds and fruits; other seeds, fruits and grains; medicinal plants and plants for technical purposes; straw and fodder | 319 329 | 0,00 | 187 133 | 70,64 |
| 13 | Natural shellac, unrefined; gums, resins and other plant juices and extracts | 1 108 323 | 0,02 | 601 744 | 84,19 |
| 14 | Plant materials for making wickerwork; other products of vegetable origin, not elsewhere specified or included | 57 294 | 0,00 | 116 858 | -50,97 |
| 15 | Fats and oils of animal or vegetable origin and their breakdown products; prepared edible fats; waxes of animal or vegetable origin | 227 766 | 0,00 | 142 083 | 60,30 |
| 16 | Prepared products of meat, fish or crustaceans, molluscs or other aquatic invertebrates | 72 300 | 0,00 | 65 934 | 9,66 |
| 17 | Sugar and sugar confectionery | 1 396 258 | 0,02 | 1 090 758 | 28,01 |
| 18 | Cocoa and cocoa products | 762 693 | 0,01 | 855 366 | -10,83 |
| 19 | Prepared products from cereal grains, flour, starch or milk; flour confectionery products | 842 126 | 0,01 | 877 811 | -4,07 |
| 20 | Processed products of vegetables, fruits, nuts or other plant parts | 396 083 | 0,01 | 567 210 | -30,17 |
| 21 | Various food products | 31 483 567 | 0,44 | 8 169 057 | 285,40 |
| 22 | Alcoholic and non-alcoholic drinks and vinegar | 8 176 925 | 0,11 | 8 107 697 | 0,85 |
| 23 | Residues and waste from the food industry; ready-made animal feed | 439 571 | 0,01 | 295 058 | 48,98 |
| 24 | Tobacco and industrial tobacco substitutes | 1 970 031 | 0,03 | 394 645 | 399,19 |
| 25 | Salt; sulfur; earth and stone; plastering materials, lime and cement | 65 842 | 0,00 | 224 984 | -70,73 |
| 26 | Ores, slag and ash | 414 738 | 0,01 | 317 537 | 30,61 |
| 27 | Mineral fuel, oil and their distillation products; bituminous substances; mineral waxes | 57 148 577 | 0,80 | 123 446 480 | -53,71 |
| 28 | Inorganic chemical products; compounds, inorganic or organic, of precious metals, rare earth metals, radioactive elements or isotopes | 8 514 092 | 0,12 | 9 821 223 | -13,31 |
| 29 | Organic chemical compounds | 129 126 383 | 1,82 | 97 486 886 | 32,46 |
| 30 | Pharmaceutical products | 138 005 041 | 1,94 | 126 050 977 | 9,48 |
| 31 | Fertilizers | 28 694 | 0,00 | 175 387 | -83,64 |
| 32 | Tanning or dyeing extracts; tannins and their derivatives; dyes, pigments and other coloring substances; paints and varnishes; putties and other mastics; printing paint, ink, ink | 18 064 581 | 0,25 | 21 295 330 | -15,17 |
| 33 | Essential oils and resinoids; perfume, cosmetic or toilet preparations | 39 700 180 | 0,56 | 44 207 675 | -10,20 |
| 34 | Soaps, organic surfactants, detergents, lubricants, artificial and prepared waxes, scouring or polishing compounds, candles and similar articles, modeling pastes, plasticine, “dental wax” and dental compositions based on plaster | 29 374 137 | 0,41 | 35 719 908 | -17,77 |
| 35 | Protein substances; modified starches; adhesives; enzymes | 2 223 041 | 0,03 | 2 055 267 | 8,16 |
| 36 | Explosives; pyrotechnic products; matches; pyrophoric alloys; some flammable substances | 102 | 0,00 | 208 | -50,96 |
| 37 | Photo and film products | 56 241 169 | 0,79 | 69 412 280 | -18,98 |
| 38 | Other chemical products | 63 560 186 | 0,89 | 46 956 416 | 35,36 |
| 39 | Plastics and products made from them | 135 872 551 | 1,91 | 151 597 882 | -10,37 |
| 40 | Rubber, rubber and products made from them | 388 117 144 | 5,46 | 505 383 670 | -23,20 |
| 42 | Leather products; saddlery and harness; travel accessories, handbags and similar products; products made from animal intestines (except silkworm fibroin fiber) | 219 676 | 0,00 | 509 694 | -56,90 |
| 43 | Natural and artificial fur; products made from it | 6 202 | 0,00 | 8 767 | -29,26 |
| 44 | Wood and products made from it; charcoal | 985 962 | 0,01 | 359 480 | 174,27 |
| 45 | Cork and products made from it | 14 806 | 0,00 | 18 021 | -17,84 |
| 46 | Products made of straw, alfa or other weaving materials; basketry and wickerwork | 656 | 0,00 | 320 | 105,00 |
| 48 | Paper and cardboard; products made from paper pulp, paper or cardboard | 5 591 230 | 0,08 | 6 589 793 | -15,15 |
| 49 | Printed books, newspapers, reproductions and other products of the printing industry; manuscripts, typescripts and plans | 1 244 100 | 0,02 | 1 638 750 | -24,08 |
| 50 | Silk | 73 227 | 0,00 | 18 186 | 302,66 |
| 51 | Wool, fine or coarse animal hair; yarn and fabric, horsehair | 13 289 | 0,00 | 15 548 | -14,53 |
| 52 | Cotton | 31 576 | 0,00 | 114 786 | -72,49 |
| 53 | Other vegetable textile fibers; paper yarn and fabrics made from paper yarn | 0 | 0,00 | 658 | -100,00 |
| 54 | Chemical threads; flat and similar yarns of chemical textile materials | 14 164 092 | 0,20 | 13 924 924 | 1,72 |
| 55 | Chemical fibers | 28 449 293 | 0,40 | 32 830 263 | -13,34 |
| 56 | Cotton wool, felt or felt and non-woven materials; special yarn; twine, ropes, ropes and cables and products made from them | 9 470 194 | 0,13 | 8 706 381 | 8,77 |
| 57 | Carpets and other textile floor coverings | 1 023 425 | 0,01 | 1 365 474 | -25,05 |
| 58 | Special fabrics; tufted textile materials; lace; tapestries; Decoration Materials; embroidery | 80 512 | 0,00 | 36 561 | 120,21 |
| 59 | Textile materials, impregnated, coated or laminated; textile products for technical purposes | 2 017 900 | 0,03 | 2 559 471 | -21,16 |
| 60 | Knitted or crocheted fabrics | 977 051 | 0,01 | 1 001 047 | -2,40 |
| 61 | Articles of clothing and clothing accessories, knitted or crocheted | 1 157 328 | 0,02 | 1 635 904 | -29,25 |
| 62 | Items of clothing and clothing accessories, except knitted or hand-knitted items | 2 674 729 | 0,04 | 2 763 597 | -3,22 |
| 63 | Other finished textile products; sets; used clothing and textiles; rags | 1 428 979 | 0,02 | 2 455 775 | -41,81 |
| 64 | Shoes, gaiters and similar articles; their details | 89 297 | 0,00 | 143 069 | -37,58 |
| 65 | Hats and their parts | 1 401 541 | 0,02 | 1 506 255 | -6,95 |
| 66 | Umbrellas, sun umbrellas, walking sticks, seat sticks, whips, riding crops and parts thereof | 5 188 | 0,00 | 8 486 | -38,86 |
| 67 | Processed feathers and down and articles made of feathers or down; artificial flowers; human hair products | 3 728 | 0,00 | 1 838 | 102,83 |
| 68 | Articles made of stone, plaster, cement, asbestos, mica or similar materials | 14 025 962 | 0,20 | 27 047 721 | -48,14 |
| 69 | Ceramic products | 5 159 445 | 0,07 | 5 402 174 | -4,49 |
| 70 | Glass and products made from it | 24 215 878 | 0,34 | 30 808 837 | -21,40 |
| 71 | Natural or cultured pearls, precious or semi-precious stones, precious metals, metals clad with precious metals, and products made from them; bijouterie; coins | 8 189 955 | 0,12 | 5 827 334 | 40,54 |
| 72 | Black metals | 6 627 236 | 0,09 | 10 899 492 | -39,20 |
| 73 | Ferrous metal products | 140 576 035 | 1,98 | 167 261 052 | -15,95 |
| 74 | Copper and products made from it | 4 057 685 | 0,06 | 2 371 280 | 71,12 |
| 75 | Nickel and products made from it | 453 573 | 0,01 | 1 327 081 | -65,82 |
| 76 | Aluminum and products made from it | 5 623 700 | 0,08 | 9 022 206 | -37,67 |
| 78 | Lead and products made from it | 1 101 | 0,00 | 1 939 | -43,22 |
| 79 | Zinc and products made from it | 29 369 | 0,00 | 30 151 | -2,59 |
| 80 | Tin and products made from it | 19 600 | 0,00 | 28 498 | -31,22 |
| 81 | Other base metals; metal ceramics; products made from them | 2 394 061 | 0,03 | 1 156 176 | 107,07 |
| 82 | Tools, utensils, cutlery, spoons and forks made of base metals; their parts are made of base metals | 43 044 779 | 0,61 | 57 592 389 | -25,26 |
| 83 | Other products made of base metals | 37 576 346 | 0,53 | 45 748 871 | -17,86 |
| 84 | Nuclear reactors, boilers, equipment and mechanical devices; their parts | 1 497 666 992 | 21,05 | 1 857 642 806 | -19,38 |
| 85 | Electrical machines and equipment, their parts; sound recording and reproducing equipment, equipment for recording and reproducing television images and sound, their parts and accessories | 530 954 773 | 7,46 | 658 604 479 | -19,38 |
| 86 | Railway locomotives or tram motor cars, rolling stock and parts thereof; track equipment and devices for railways or tramways and parts thereof; mechanical (including electromechanical) signaling equipment of all types | 405 171 | 0,01 | 420 504 | -3,65 |
| 87 | Ground transport vehicles, except railway or tram rolling stock, and their parts and accessories | 2 791 333 353 | 39,24 | 3 996 451 558 | -30,15 |
| 89 | Vessels, boats and floating structures | 129 244 457 | 1,82 | 95 941 893 | 34,71 |
| 90 | Optical, photographic, cinematographic, measuring, control, precision, medical or surgical instruments and apparatus; their parts and accessories | 534 001 035 | 7,51 | 455 379 714 | 17,27 |
| 91 | Watches of all types and their parts | 2 321 064 | 0,03 | 3 234 305 | -28,24 |
| 92 | Musical instruments; their parts and accessories | 8 626 173 | 0,12 | 6 386 468 | 35,07 |
| 94 | Furniture; bedding, mattresses, mattress bases, cushions and similar stuffed furnishings; lamps and lighting fixtures not elsewhere specified or included; illuminated signs, illuminated name or address plates and similar products; prefabricated building structures | 29 902 937 | 0,42 | 41 486 123 | -27,92 |
| 95 | Toys, games and sports equipment; their parts and accessories | 10 293 276 | 0,14 | 11 171 507 | -7,86 |
| 96 | Various finished products | 87 651 293 | 1,23 | 119 041 373 | -26,37 |
| 97 | Artworks, collectibles and antiques | 74 906 | 0,00 | 125 158 | -40,15 |
| SS | Secret code | 358 194 | 0,01 | 333 362 | 7,45 |
Share this post: