Dow Jones Index - what it is, what it shows and what it affects. Pros and cons of application, dynamics of changes. Technical analysis of fluctuations in the Dow Jones index.
The world economy is a single system, the locomotive of which is the United States of America. It is not without reason that there is a saying: “When America sneezes, the whole world gets sick.” As soon as something happens in the United States, it inevitably affects the economies of other countries.
The Dow Jones stock index is called the “barometer” of the American economy. Even people unfamiliar with the stock exchange world have probably heard about the existence of this index: it is mentioned daily in the news and analytical reports. Traders from all over the world use it as an indicator, using this index to assess the “health level” of the US and global economies.
The article will tell you what the Dow Jones Index is and why it is so important.
What is the Dow Jones Index
The Dow Jones Industrial Average (ticker on the DJI stock exchange) is a stock index containing the 30 largest or most important public companies in the United States (blue chips). Which have the greatest impact on the country's economy.
This is one of the oldest stock indexes. It is still used today as an indicator of the state of the US stock market.
One of the main differences between the Dow Jones and most other indices is the rules for including companies in the index (or excluding them). By and large, there are no clearly defined criteria. Which stocks should be in or out of the index? Who should I hire as a replacement? How often should the index be reviewed? The answer is simple - depending on the situation.
For example. The composition of the S&P 500 index is prescribed by a simple algorithm: the 500 largest public companies in the country with an acceptable free-float, plus several other additional conditions (I wrote about the S&P 500 here).
With some stretch, we can say that the composition of the DOW is formed on the basis of subjective factors.
As a rule, companies are removed from the index when the business begins to experience serious problems, the company loses the “battle for the sun” to competitors, merges with other companies that are already in the DOW index, and splits its business into several independent companies.
Bulls and bears
Initially, these terms applied only to traders trading in the stock market, but then they spread to other trading platforms. Bulls are players who buy an asset with the expectation that its value will rise. In the optimal case, such a speculator buys a stock (bond, futures) at the bottom and sells at the peak, when demand for the asset reaches its maximum.
Bears are the exact opposite of bulls. These are speculators who sell a financial instrument in the hope that its quotes will fall. In professional language, such an operation is called short selling without covering.
It is easy to imagine stock exchange animals using a figurative picture: a bull raises the enemy (price) on its horns from the bottom up, and a bear, on the contrary, nails the victim (quotes) with its paw down.
Similar terminology applies to trends dominating the market. If demand on trading platforms exceeds supply and financial assets rise in price, then a bullish trend is observed. A bearish trend prevails when the economy deteriorates and stock prices fall. If there is an equilibrium between buyers and sellers, a sideways trend occurs in the market.
In many ways, stock exchange slang was formed in New York, where the first stock exchange was born. That's why the most popular bull sculpture stands on Wall Street, at the entrance to the New York Stock Exchange building. The bronze sculpture weighs more than 3 tons, its length is almost 5 m and its width is 4.7 m. It is believed that if you rub the horns of a bull, it will bring good luck in business and financial matters.
History of the DOW index
The Dow Jones Industrial Average first appeared in 1896. Founders: Editor-in-Chief of The Wall Street Journal -
Charles Dow and his partner Edward Jones. Hence the name of the index.
Initially, the index included 12 companies. Most of them were industrial. Over time, new names were added to the index. By 1928, their number reached 30. And it is no longer increasing.
Despite its name, the Dow Jones Industrial Average, the index does not only include industrial enterprises. The index includes many sectors and industries of the economy. Excluding utilities and transport.
Currently, industry is allocated "only" about 11% of the weight in the index.
Top 10 Dow Jones Sectors
Composition of the Dow Jones Index
If you look at the components of the index, then most of the companies (if not all) will probably be well-known: Apple, Visa, Johnson & Johnson, Coca-Cola, Disney. That's why they are blue chips.
List of 15 companies included in the DOW index, with the largest share of weight:
TOP 15 Dow Jones Index Companies
The full composition of the index can be viewed by following the link.
How the index value is calculated
The Dow Jones Industrial Average is calculated differently than other popular stock indexes. Most indices, such as the US SIPI 500, use capitalization weighting .
In simple words, the greater the market value of a company, the more weight it has in the index. With this approach, a small number of the largest companies have the greatest impact on changes in the index. So the first three companies from the S&P 500 index account for 15% of the weight. And in the TOP 10 - a quarter of the total weight. Of 500 companies in the index.
The Dow Jones Industrial Average is actually the average of the prices of the 30 stocks of the companies included in the index divided by a certain factor.
Initially, the creators of the index added up the price of each share. The resulting amount was divided by 12 (the initial number of companies in the index). As a result, the resulting arithmetic mean was the index value.
During the life of the index, mergers and acquisitions, additions, divisions of shares (splits) and other other actions took place. As a result of these constant manipulations, the approach to calculating the index has changed slightly. The amount is divided not by 30 (according to the number of companies in the index), but by a certain coefficient (now much lower than 1).
Example.
Let's say (for simplicity) the Dow index consists of only shares of 2 companies:
- Company A shares cost $80;
- Company B's share is $20.
Then the value of the Dow Jones index will be equal to 50 [($80+$20)/2)].
Company A is splitting its shares 1:2 (instead of 1 share at $80, there will be 2 shares at $40). In fact, the company's capitalization has not changed.
But if we take the old method of calculating the index value, we get 30 (instead of 50). The index would immediately collapse by 40%. Although in fact nothing has changed. The total value of companies (capitalization) remained the same. And in order to bring the average index value to the correct one (50 points), it will be necessary to divide the amount of shares not by 2, but by a certain coefficient. In our case 1.2
- Company A share – $40
- Company B shares - $20
The average index value (incorrect, according to old calculations) is 30.
The correct value is 50 [($40+$20)/1.2)].
The dynamics of the DJIA index are most influenced by companies with the highest share prices.
If you think about it logically, it sounds somehow not logical at all (and frankly, crazy). It doesn't matter how much the company is worth. The main thing for the index is the share price. In the Dow, prices range from 40 to 360 bucks per share. And this can lead to very unpleasant events (more on that below).
About Admiral Markets
We are a broker with a global presence, authorized and regulated by financial institutions such as the Financial Conduct Authority (FCA), the Cyprus Securities and Exchange Commission (CySEC) and the Australian Securities and Investments Commission (ASIC). We provide access to over 8,000 financial trading instruments such as Forex and CFDs on shares, indices, bonds, commodities, ETFs and cryptocurrencies, as well as investment opportunities in real shares and ETFs. With Admiral Markets you can use the most innovative trading platforms such as MetaTrader 4 and MetaTrader 5, as well as the exclusive MetaTrader Supreme Edition plugin, for free.
Get instant, free access to our Premium Analytics portal with market news, technical analysis, economic calendar and global market sentiment indicators compiled from over a thousand financial media sources. Just click on the banner below and get it now:
Dow Index Returns
The Dow's returns alone won't tell an investor anything. We need some kind of guideline. In order to understand whether this is good or bad. For comparison, let's take the regular S&P 500.
What are the key differences between the Dow and the S&P500?
- Weak diversification (30 companies versus 500).
- Absence of some sectors of the economy (transport, housing and communal services).
- A vague method of adding stocks to an index.
- Index movements are driven by stocks with the highest price (not capitalization).
- A very rare update of the index composition (only 60 companies have changed in almost 100 years). And the composition of the S&P is reviewed quarterly.
- Historically, the dividend yield of companies in the Dow Jones Index is higher than the SIPI 500 (dividend chart below).
Dividends by year: red - DJIA index / blue - S&P 500 index
So what's the result? Despite the strong differences, the Dow is highly correlated with the S&P 500. Almost twin brothers.
Over the past 20 years, the Dow has outperformed the S&P 500:
- total return - 353% versus 270%.
- average annual return - 7.3% versus 6.3%.
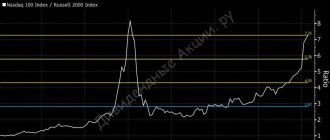
But the last decade (graph below) 2010 - 2021. was on the side of the S&P (240% versus 210% return). The average annual rate is 12.6% (SIPI) and 11.40% (DOU).
Although until recently the indices moved almost synchronously. The breakup occurred in 2021 amid a pandemic (coronavirus). And this is precisely due to the methodology for calculating the Dow Jones index.
Boeing's quotes fell by half in March 2021 (with an average market drop of 30%). Boeing stock was one of the most valuable components of the Dow (over 9% weight in the index). And therefore they had a significant impact on the dynamics of the index.
Dynamics of the indicator under consideration
From a long-term perspective, the index has been steadily rising. The very first published value was 40.94. Today it has already exceeded 18,000. That is, over more than 100 years of its existence, the Dow Jones index has increased approximately 440 times.
In 1966, the index broke the 1000 mark for the first time. Particularly rapid growth was observed in the 80-90s. last century. In 1995, the level of 5,000 was crossed, and by 1999 – 10,000. The largest medium-term drop in the index in question was noted in 2008-2009, during the global financial crisis. After reaching a value of 14,000, it collapsed to 7,000, after which it recovered and continued to grow, which is observed today.
The most significant daily drop (22.6%) was recorded on Black Monday (10/19/1987). After September 11, the index fell 7.1%.
How to invest in DJIA
No matter how strange (in my opinion) the Dow Jones calculation method is, in practice the index's return is comparable to the return of the broad market (represented by the S&P 500). At the same time, the Dow index has a higher dividend yield (about a quarter higher).
And in principle, the composition of the DJIA index can be considered as an almost ready-made portfolio of shares (the largest US companies paying stable dividends).
How to invest in the Dow Jones index?
As usual, there are two options: simple and complex (or profitable and unprofitable).
Independent purchase of individual stocks included in the index
Since the index is calculated by stock price (not capitalization), it is enough to simply buy 1 share of each company. And you don’t need to bother with calculating the required share of weight for each company (as is the case with other indices).
In Russia, you can buy shares on the St. Petersburg Stock Exchange.
The main disadvantages of this approach:
- To purchase 30 securities, you need an amount of several thousand dollars (more precisely, $3,750, at the current DOW rate of 25,735 points). In the future, to maintain the required proportions, if you buy again 1 paper from each company, you will get several thousand more at once. But this is better than trying to reproduce the S&P 500 index (with 500 securities). Or at least the Moscow Exchange index. Although there are only 40 papers, to accurately reproduce the proportions, you will need to invest something like 7-8 million rubles.
- High labor costs.
- Increased commissions are possible (if the broker has a minimum fee per transaction).
Pros:
- You can hold papers for free. What am I talking about? You'll find out later.
- Tax benefits (purchase using IIS, possible tax exemption upon sale - LDV).
Continue your Forex education
- How to invest in a bear market?
- What is the VIX index and how to trade it?
- What is overtrading and how to avoid it?
INFORMATION ABOUT ANALYTICAL MATERIALS:
The following contains additional information regarding analytics, opinions, forecasts or other similar information (“Analytics”) published on the Admiral Markets website. Before making any investment decisions, please pay particular attention to the following:
- You are dealing with marketing communications. Analytics are published for informational purposes only and cannot be construed as investment advice or recommendations. It has not been prepared in accordance with legal requirements designed to promote the independence of investment research and is not subject to any prohibitions on dealing before disseminating investment research.
- Each investment decision is made independently by each client, and Admiral Markets is not responsible for any loss or damage arising as a result of such a decision, regardless of whether the client relied on the information provided in the Analytics in making the decision or not.
- In order to protect the interests of our clients and the objectivity of the Analysts, Admiral Markets has established appropriate internal procedures to prevent and manage conflicts of interest.
- The analysis is prepared by an independent analyst Boris Petrov (hereinafter referred to as the “Author”) based on the personal experience and judgment of the Author.
- Although all reasonable measures have been taken to ensure the reliability, accuracy, availability and timeliness of the Analytics, Admiral Markets does not guarantee the accuracy or completeness of the information contained therein.
- The Analytics contained in the Publication about the profitability of financial instruments for past periods, or about their modeled profitability, does not constitute a direct or indirect promise, guarantee or reference on the part of Admiral Markets regarding the profitability of these financial instruments in subsequent periods. The value of a financial instrument can either rise or fall, so the preservation of the value of the assets is not guaranteed.
- Leveraged trading (including CFDs) is speculative in nature and may result in profits or losses. Before you start trading, make sure you understand the risks involved in trading.