What is correlation in the financial market, what causes its appearance, how it is defined and used in trading. Examples of use and features.
There are many internal relationships in financial markets. For example, changes in the price of oil affect the exchange rate of the ruble and other commodity currencies, and the dynamics of the S&P 500
determines the behavior of shares of American companies.
This connection is called correlation and is widely used not only in trading, but also in investment activities. This technique helps reduce risks and increase the profitability of an investment portfolio.
- The influence of gaps on correlation
- What does the correlation coefficient mean?
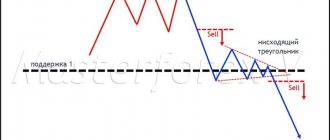
Correlation in investment portfolio diversification
Modern portfolio theory, invented by Markowitz, uses only two factors: the expected return of an asset and its correlation with other assets. By using a set of assets between which the correlation tends to -1 (red), the investment portfolio becomes immune to external factors.
This kind of immunity is the main point of diversification. Correlation is only a formal criterion for selecting assets for a diversified portfolio.
The correlation matrix is beautiful, but even when sorted by color blocks with a large number of funds, it is very difficult to digest. Therefore, let’s call on machine learning to help, so that the computer itself finds similar funds for us in the correlation matrix. Yes, yes, ML, which you hear about from every computer, has finally solved for us a simple, but very necessary applied problem here and now.
There is an interactive version of the dendrogram
It looks like a simple graph, which has the complex name Dendrogram. The peculiarity of the dendrogram is that the shorter the line that connects the funds, the stronger the common properties of these same funds. For example:
- FXUS and SBSP (right in the center of the horizontal axis) are as similar as possible to each other, since they are located next to each other and the line is very short.
- FXRB and FXTB (on the edges) act like cats and dogs, having the longest connecting line.
The algorithm formed 3 large groups for us, including 7 small subgroups. A lazy investor only needs to select 3 funds from large groups, obtaining a sufficient level of diversification. The less lazy one needs to go down and select 7. The main condition is to use one fund from the group. Further diversification will not have such a magical property.
An ordinary mathematics student would say “we disagree” already at this stage. After all, we got the result, all that remains is to go to the trading terminal and buy enough for a “full cutlet”.
But we need the applied side of the issue. What are these groups? How did they get together? Do they have any real meaning? Let's talk about each group further.
Summary
A stable correlation is not an accident, this connection is due to fundamental factors, and it can be used in trading. Despite the abundance of strategies based on this phenomenon, they all come down to 2 types - statistical arbitrage and risk hedging.
Regardless of which system you choose, I do not recommend trading based solely on correlation . When day trading, use it as an entry filter. Also, before work, understand the nature of the connection between assets: you need to find out whether it is random or permanent.
Leave any questions in the comments below. If you have any thoughts on using correlation in trading, please write about that as well. If you want to receive notifications about the release of new materials, subscribe to my blog in telegram . This is the fastest way to find out about the release of new articles.
I say goodbye to you and wish you success in both trading and investing. See you soon!
If you find an error in the text, please select a piece of text and press Ctrl+Enter. Thanks for helping my blog get better!
Conservative group ETF and BPIF
Dollar bonds
| Ticker | Assets | Category | Region |
| FXRU | Bonds | Eurobonds | Russia |
| RUSB | Bonds | Eurobonds | Russia |
| SBCB | Bonds | Eurobonds | Russia |
| FXMM | Bonds | National debt | USA |
| FXTB | Bonds | National debt | USA |
Open bond funds in the screener
These funds are often used as a substitute for dollar deposits. The funds invest in dollar bonds (US Treasuries and Eurobonds of our companies), receive dollar coupons and are highly dependent directly on the dollar exchange rate.
As they say: “the percentage is small, but it’s in dollars.”
Gold funds
| Ticker | Assets | Category | Region |
| TUSD | All assets | Mixed | USA |
| TEUR | All assets | Mixed | Europe |
| FXGD | Commodities | Gold | The whole world |
Open gold funds in the screener
Synthetic gold from FinEx and foreign all-weather funds from Tinkoff fell into the same group. You need to understand that FXGD still behaves differently than Tinkoff funds, as evidenced by the not very noticeable correlation. A similar connection was formed due to the presence of a certain amount of gold in Tinkoff mutual funds.
Debunking the myth of 100% inverse correlation between EUR USD and USD CHF
This was in 2011-2015 the main “reinforced concrete” argument of “defenders of classical correlation” and ardent opponents of Masterforex-V on the issue of “currencies of allies” and “enemies” . Look, they told me, EUR USD and USD CHF almost ALWAYS have a 70%-90% inverse correlation according to the “correlation table”. Those.
- opened buy on USD CHF, at the same time, automatically “go short” on EUR USD;
- If you want to “hedge risks” - instead of locking positions with a “lock” - open opposite transactions on USD CHF and EUR USD.
- Until now, on a number of sites of analysts and copywriters, similar recommendations are in the TOP of Yandex, although on the “Forex forums” of Forex Club, RoboForex, FIBO Group they were simply removed (on the Broco and MMCiS forums they disappeared along with the owners).
What is the reason for the inverse correlation between USD CHF and EUR USD in 2011-2015? It was in a narrow flat of the EUR CHF currency pair of only 10-15 points (i.e. it was logically explained by Masterforex-V through allies and opponents even in those years). Of course, such a situation could not remain forever, which the Masterforex-V Academy warned about repeatedly, including about a long-term bearish trend (see MN chart below).
The denouement came on Thursday, January 15, 2015, when the Swiss Central Bank removed the artificial peg of the franc to the euro, as a result of which the franc rose in price to the euro by 40% in 15 minutes.
Americas Stock Group
There is a significant anomaly in this group in the form of the FXCN ETF, which invests in Chinese stocks. It has a very high degree of mismatch with the rest of the American group funds.
Many investors would expect it to be similar to the VTBE emerging markets fund. It turns out that in March VTBE felt many times worse than FXCN. And since then I haven’t even recovered.
Mathematics suggested that FXCN can be regarded as a single and separate fund from others. An excellent candidate for a diversified portfolio without analogues.
Alpha Bank funds
| Ticker | Assets | Category | Region |
| AKNX | Stock | Technology stocks | USA |
| AKSP | Stock | Major companies | USA |
| VTBH | Bonds | Corporate bonds | USA |
| AKEU | Stock | Major companies | Europe |
| FXKZ | Stock | Major companies | Kazakhstan |
Open group in screener
It would be logical if the breakdown in the Americas grouping followed the S&P versus IT scenario, but mathematics found an amazing pattern. Funds were allocated to management companies. In one of the groups it turned out that funds from the management company Alfa Capital (essentially Alfa-Bank) dominate.
The unexpected separation of Alfa Capital funds into a separate correlation group raises many questions. Indeed, if we compare FXUS and AKSP, AKSP had an order of magnitude higher volatility in the spring. And the reason may not be the poor performance of MM, but the banal fact of the lack of ruble trading for Alfa-Bank funds on the Moscow Exchange.
!) The return distribution of AKSP (orange) had much thicker tails than that of FXUS (brown).
There were 2 anomalies in the Alfa-Bank group: VTBH and FXKZ.
As luck would have it, FXKZ has been moving very similar to AKSP since January. A similar graph is observed for VTBH. It is clearly not worth expecting such coincidences in the future; there is no viable explanation for this.
Not Alfa Bank funds
| Ticker | Assets | Category | Region |
| FXWO | Stock | Major companies | The whole world |
| VTBA | Stock | Major companies | USA |
| VTBE | Stock | Major companies | Developing |
| FXIT | Stock | Technology stocks | USA |
| FXUS | Stock | Major companies | USA |
| SBSP | Stock | Major companies | USA |
Open American funds in the screener
We have already discussed the anomalous group of Alpha above, but now let’s move on to the funds for America of the “normal person”.
All funds in this group behave similarly. S&P funds are the hottest and most overused topic in the financial world of passive investors. FXIT found itself in the group due to the specifics of its composition - 91 shares from the S&P. The growth of IT provokes the growth of the entire S&P, creating a strong relationship.
This also includes VTBE, which actually invests in emerging market equities, not the US. If you look at the charts, VTBE and S&P fell simultaneously against the background of the March coronavirus, and then grew rapidly against the background of the subsequent QE. But why was VTBE included in the S&P group? VTBE invests indirectly in more than 2,600 companies worldwide. Such diversification made it quite stable, bringing its characteristics closer to the S&P. But in the spring, VTBE still lost to FXCN...
Expected value properties.
Let \( w_i \) be any constant value (constant), and \( R_i \) be a random variable.
1. The expected value of a constant multiplied by a random variable is equal to the constant multiplied by the expected value of a random variable.
\( E(w_iR_i) = w_i(R_i) \)
2. The expected value of a weighted sum of random variables is equal to the weighted sum of the expected values using the same weights.
\( E (w_1R_1 + w_2R_2 + \ldots + w_nR_n) \) \(= w_1E (R_1) + w_2E(R_2) + … + w_nE(R_n) \) (formula 13)
Suppose we have a random variable with a given expected value. For example, if we multiply each result by 2, the expected value of the random variable will also be multiplied by 2. This is the point of part 1.
The second statement is a rule that directly results in expressing the expected return of a portfolio.
A portfolio with n securities is determined by its portfolio weights, \( w_1, w_2, \ldots, w_n \), which add up to 1. Thus, the portfolio return, \( R_p \), is \( R_p = w_1R_1 + w_2R_2 + \ldots + w_nR_n \).
We can now formulate the following principle:
Russian asset funds
Bonds and all weather
| Ticker | Assets | Category | Region |
| SBRB | Bonds | Corporate bonds | Russia |
| SBGB | Bonds | National debt | Russia |
| TRUR | All assets | Mixed | Russia |
Open group in screener
Surprisingly, Sberbank's mutual funds for bonds were awarded a separate group. In March, these funds fared much better, creating a safe haven for ruble bonds. Market makers of other funds widened their spreads, thereby increasing the volatility of the funds.
TRUR was included in the group due to its investment specifics: half of its funds are invested in bonds, and the second in stocks and gold that balance each other. So we got very similar TRUR and SBGB graphs.
Stock
| Ticker | Assets | Category | Region |
| FXRL | Stock | Major companies | Russia |
| SBMX | Stock | Major companies | Russia |
| RUSE | Stock | Major companies | Russia |
| VTBB | Bonds | Corporate bonds | Russia |
| FXRW | Stock | Major companies | The whole world |
| FXDE | Stock | Major companies | Germany |
Open group in screener
This group can be split even further. There is a subgroup of the Moscow Exchange index (RUSE, FXRL, SBMX) and world ones (FXDE, FXRW). The connection between FXDE and FXRW is not obvious, but their price dynamics are co-directional.
The IMOEX group included the bond VTBB. This is surprising since investors typically compare VTBB to SBCB. Which is quite logical, given their similarity. This means that VTBB got into the IMOEX group by accident.
Hedging and duration
| Ticker | Assets | Category | Region |
| FXRB | Bonds | Eurobonds | Russia |
| G.P.B.M. | Bonds | Corporate bonds | Russia |
| G.P.B.S. | Bonds | Corporate bonds | Russia |
| MTEK | Stock | Technology stocks | USA |
Open group in screener
The last group consists of the most difficult funds to understand. So complex that mathematics itself stumbled and decided to group them separately.
FXRB may be a Eurobond fund, but it has currency hedging, unlike its conservative counterpart FXTB.
GPBM and GPBS have the most difficult investment declaration for ordinary investors to understand, taking into account interest rate risks through duration. In fact, these funds do not hold bonds to maturity, but maintain their composition in a semi-active mode to comply with their own policies.
MTEK is a special fund. Unlike other IT funds, MTEK has only 10 companies at 10% each. This distribution makes it different from other IT funds.
The best brokers for trading market correlations
See the TOP-12 rating of the best brokers selected from 300 brokerage ]Forex Broker Rating[/anchor] Masterforex-V Academy
| Broker name | Year of foundation | Trading instruments | Licenses | |
| 1. | NordFX | 2008 | currency pairs, commodity futures, stock indices, cryptocurrencies, stocks | CySEC, MiFID |
| 2. | Swissquote | 1996 | commodity futures, currency pairs, stock index futures, cryptocurrencies, metals, ETFs, warrants, shares | FINMA, FCA, SFC, Dubai FSA |
| 3. | Dukascopy | 1998 | stock indices, commodity futures, currency pairs, stocks, bonds, ETFs | FINMA, FCMC |
| 4. | Alpari | 1998 | metals, energy, indices, currency pairs, cryptocurrencies | — |
| 5. | FxPro | 2006 | indices, commodity futures, stocks, currency pairs | FCA, CySEC, FSB, Dubai FSA, BaFin, ACPR, CNMV |
| 6. | Interactive Brokers | style=”text-align:justify”>1977 | stocks, bonds, derivatives, currency pairs, forward contracts, bills, warrants, options, stock indices, currency and commodity futures | style=”text-align:justify”>NFA, CFTC, FCA, IIROC |
| 7. | Oanda | 1996 | bonds, stock indices, currency pairs, commodity futures | NFA style=»color:rgb(34,34,34);font-family:'Helvetica Neue', Arial, Verdana, sans-serif;text-align:justify;»>, CFTC, FCA, IIROC, MAS, ASIC |
| 8. | FXCM | 1999 | currency pairs, stock indices, commodity futures, cryptocurrencies | FCA, BaFin, ACPR, AMF, Dubai FSA,SFC, ISA, ASIC, FSB |
| 9. | Saxo Bank | 1992 | currency and commodity futures, stock indices, currency pairs, ETFs, stocks, bonds, derivatives | Danish FSA, Consob, Czech National Bank, Bank of the Netherlands, ASIC, Monetary Authority of Singapore, FINMA, Bank of France, Central Bank of the UAE, Japanese Financial Services Agency, Securities and Futures Commission in Hong Kong. |
| 10. | FOREX.com | 1999 | currency pairs, stocks, stock indices, commodity futures, cryptocurrencies | NFA, CFTC, FCA, ASIC, JSDA, MAS, SFC |
| 11. | FIBO Group | 1998 | metals, energy, currency pairs, commodities, cryptocurrencies, indices | CySEC |
| 12. | FINAM FOREX | 1994 | currency pairs | Bank of Russia |
Another 20 companies out of 68 are part of the 2nd league forex brokers, which have a large number of comments from forex traders and investors and exchanges - their rating and licenses from various financial regulators.
| Broker name | Year of foundation | Trading instruments | Licenses | |
| 1. | Forex Club | 1997 | currency pairs, indices, commodities, stocks, ETFs | — |
| 2. | TeleTrade | 1994 | commodities, currency pairs, indices, stocks | — |
| 3. | ActivTrades | 2001 | indices, commodities, currency pairs, stocks, bonds, ETFs, cryptocurrencies, options | FCA, SCB |
| 4. | FreshForex (Fresh Forex) | 2004 | indices, commodities, stocks, currency pairs | — |
| 5. | eToro (eToro) | 2007 | currency pairs, indices, commodities, stocks, ETFs, cryptocurrencies | ASIC, FCA, CySEC |
| 6. | FortFS | 2010 | currency futures, currency pairs, indices, commodities, bonds, stocks, cryptocurrencies, ETFs | IFSC Belize |
| 7. | ORBEX | 2010 | stocks, currency pairs, indices, commodities | CySEC, MiFID, FCA, PFSA, BANQUE DE FRANCE, AFM, CNB, CMVM, , CNMV, FSAEE, FKTK |
| 8. | 2011 | currency pairs, indices, commodities, stocks | ASIC, IFSC, CySEC | |
| 9. | BCS Forex (BCS Forex) | 2004 | currency pairs, stocks, indices, commodities | — |
| 10. | GKFX | 2009 | currency pairs, indices, commodities | FCA, JFCA, DMCC, BaFin, AMF, AFM, CONSOB, CNMV, , CNB, Národná Banka Slovenska |
| 11. | NPBFX (Nefteprombank) | 2016 | commodities, currency pairs, cryptocurrencies | — |
| 12. | Admiral Markets | 2001 | cryptocurrencies, currency pairs, commodities, stocks, ETFs, indices, bonds | ASIC, FCA, EFSA, CySEC |
| 13. | Larson&Holz | 2004 | currency pairs, commodities, stocks | — |
| 14. | Grand Capital (Grand Capital) | 2006 | stocks, indices, commodities, cryptocurrencies | — |
| 15. | RoboForex (Roboforex) | 2009 | indices, commodities, currency pairs, stocks, cryptocurrencies | CySEC, IFSC Belize |
| 16. | FinmaxFX | 2018 | currency pairs, indices, commodities, bonds, stocks, options | CROFR, VFSC Vanuatu |
| 17. | FXOpen | 2005 | indices, commodities, cryptocurrencies, currency pairs, | FCA |
| 18. | Forex Optimum Group Limited | 2009 | indices, commodities, currency pairs, stocks | — |
| 19. | EXNESS | 2008 | commodities, currency pairs, cryptocurrencies | FSA Seychelles |
| 20. | HYCM | 1989 | indices, commodities, currency pairs, stocks, cryptocurrencies | FCA, CySEC, CIMA, Dubai FSA |
conclusions
Statistics and machine learning have given us a lot to think about.
- There are unique funds that do not lend themselves to conventional clustering. For example, this turned out to be VTBH for American bonds, VTBB for Russian corporate bonds.
- Funds with complex structures (global ones from FinEx, Brown’s portfolios from Tinkoff) do not lend themselves to a single logic and scatter into different groups. It is much more difficult to predict what factors will change such funds than in other cases.
- Two standardly used fund groups were not found: The American IT sector group is missing (FXIT, AKNX, MTEK). The technology funds are so different from each other that the algorithm could not identify them as a single class. Several new IT funds were released in 2021 (SCIP, TECH). Perhaps in the next issue of the article they will make it easier for the algorithm to find their own kind.
- There is no group for developing countries (FXCN for China, FXKZ for Kazakhstan, VTBE for all). If an investor wants Third Frontier stocks, he will have to be very careful when choosing.
UPDATE The analysis is at least six months out of date. More recent analysis for February 2021 is here.
Correlation of currencies – “Masterforex-V allies” against the Japanese yen
The third traditional objection to the 15-year theory of correlation between “allies” and “opponents of the MF” is the simultaneous and one-vector trends of USD JPY, EUR JPY, GBP JPY, CHF JPY, AUD JPY, NZD JPY, CAD JPY. Arguments of opponents: how the euro and dollar can be “opponents” if their trends in the dollar, yen and euro, yen very, very often coincide (as a result, there is a positive correlation between them).
Have you found an error (substitution of concepts) in the logic of MF opponents? That's right, there are no “currencies” - eternal allies, there are “currency pairs” - allies and opponents . The logic of the MF is shown above using the example of “allies” against the US dollar. Here is the same algorithm, only against the Japanese yen.
So, against the Japanese yen index - all other currencies of the world are allies in their crosses against the yen - from USD JPY (major) and EUR JPY to exotic currency pairs RUB JPY, CZR JPY, SEK JPY, NOK JPY, PLN JPY, CNY JPY and etc. (I understand that for a number of political observers at this point there will be a “computer freeze of all their worldview templates”, that it turns out that the currencies of the USA, the Russian Federation, Poland, Ukraine, Israel, China, Iran, Saudi Arabia “can be friends” and be “allies” at the same time Arabia, etc.).
The logic for the correlation of “allies-MF” against the Japanese yen is similar - see the Masterforex-V template for the correlation between the dollar and the yen.
Determination of independence for random variables.
Two random variables X and Y are independent if and only if:
\( P(X,Y) = P(X)P(Y) \).
For example, given independence, P(3,2) = P(3)P(2).
We multiply the individual probabilities to get the joint probabilities. Independence is a stronger property than uncorrelated because correlation concerns only linear relationships.
The following rule applies to independent random variables and therefore also to uncorrelated random variables.