Trading system - market description
Here a person divides everything into several sections. I will analyze his system into individual elements. And then, where there is something to add, correct or refute, I will write comments.
Money management
I would like to note right away that it is quite reasonable to withdraw part of the profit. This trading system implies the withdrawal of 80% of the profit. A person does not deceive himself and understands that he can do something crazy in the market. Therefore, it uses two accounts ; one for trading, the other for saving.
The principle of diversification
Deposit for trading is used in the amount of $200. As a result, there will be increased risks. This is what this trading system implies. Keep in mind that the smaller the amount you deposit into your account, the greater your risks will be as a percentage of the deposit!
Also, this trading system provides for trading with a volume of 0.03 lots on the Forex market. And also, fixation of profit in parts. Here the person has prescribed situations for himself in which he will go out in parts. In my professional opinion, this is a very correct approach...
Fractional exit from positions
…This is exactly what I teach in my educational program . But, to tell the truth, not all beginners are able to enter fractionally. If you realize in your trading that you are starting to lose money at this point. Then it’s trite to come out in full. As you gain more experience, you will go out according to Feng Shui - in parts. Let me give you an example of why to do this:
An example of ignoring fractional exits from positions
So, for example, one of my students took a small movement. And pay attention to how much time after that the market still went through. Just think about the number of points! That is why I insist that you need to go out in fractions!
Psychology in the market
Analysis of positive transactions
A particularly important point is to monitor and analyze exactly how you earned money. Many people pay more attention to mistakes . In my opinion, this is not entirely true. It is necessary to work on mistakes, but you can drown in it. Since you will do this, endlessly . Because the:
“You can lose as much as you like, but you can only earn the same amount!”
How to start algorithmic trading in 3 steps
Step 1: Open an account
Open a free trading account with our recommended broker. You will need to go through the KYC process as part of the account opening process.
Step 2: Deposit Funds
Once you have completed registration and your account has been approved, you can transfer funds to your account using one of the provided payment methods.
Step 3: Start Trading
Once you have opened an account and completed developing your strategy, you are ready to trade. You can also trade on a demo account to get familiar with algorithmic trading.
Start trading using the algorithm now
There are several brokers that offer algorithmic trading strategies. We have provided you with a list of reputable brokers that you can consider for algorithm trading. We've broken down the list to showcase providers that offer forex, cryptocurrency, and stocks:
- eToro is unique for cryptocurrencies
- Forex.com is a good broker if you want to trade Forex.
- Stash Invest is a great platform for stock trading
System and example of the crowd
Example of crowd movement in the market
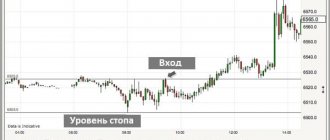
This example really confuses me because it is always important to look at the context. After all, any system requires this. It is stated here that this level has changed from support to resistance. But specifically in this screenshot, this is not visible. Also, most likely, the market did not see this level at all. To understand the full context, I’ll find the situation on the graph:
An example of price ignoring a level
As expected, this is a highly controversial issue. It is not clear what the author of the trading system had in mind, where support becomes resistance? Perhaps the concepts are confused here, and it should be the other way around. That is, resistance has become support . But we also cannot agree with this completely.
Let's look at the situation as a whole
Stopping the price on a fall without confirmation cannot in any way be considered a level that exists in this section of the chart. It is better not to take levels that are formed by rebounds during the fall. In situations where the market is approaching the “stuck” , it indicates the dominant side of buyers. And most likely there will be a breakdown here.
An example of a “sweeping” movement
Especially if there was a strong downward movement earlier. In general, a rapid upward movement after a strong fall indicates more of a reversal than a continuation of the downward movement. A striking example here is the strong market decline of 2014.
MACD indicator
The MACD indicator is also often used in trend trading systems. Despite the fact that many consider it an oscillator, the indicator is still trending in nature.
How to use the MACD indicator has been written more than once on the blog pages. If it is quite difficult to give an example of a strategy with Ichimoku, almost every third is a trend strategy using MACD. Take, for example, the same Golden Boy mentioned above.
Example of a big player
Identification of a major player
In this situation, the context is also not taken into account. A major player does not start with one or two candles with tails . He does not enter the candle and does not exit the same. The big player system doesn't work that way. A large player has a lot of capital, and this is its main inefficiency. That is, he cannot quickly enter the market and quickly exit.
Level screenshot
To assert that in this situation, after a sharp fall, a major player came. And he began to sharply defend some empty space, not entirely true. If we consider the situation as a whole, then the following statement will not be true:
“If this “level” is not maintained, there will be a sharp drop”...
Pay attention to all the previous movements; by and large, all buyers have long been “STOPped” . On this occasion, I recommend that you read the book “Conspiracyology of Technical Analysis” by A. Vsemirova. It will help you take a better look at the big player theory!
Trends
The author of this trading system talks about trends absolutely correctly. He gives good examples and look at his screenshots in the trading system - they are not entirely complete. Here I will add a few points to the description of trend phases.
50% retracement movement
The end of a trend is also characterized by deep, often more than 50%, corrective pullbacks. At the moment, I am a big proponent of the 50% retracement, the so-called average price.
In the end, our entire universe, events and phenomena in it, tend to the middle range of 50%!
Scheme of the beginning, middle and end of a trend movement
With any trend, there is always 50% of this movement. If the price stops at a retracement of up to 50%, then this indicates more continuation of the movement. If the rollback is more than 50%, then this already indicates a stop or reversal of the trend.
Using oscillators in trend strategies
As you understand, a trend never has a straight trajectory - there are always rollbacks, stagnations, slowdowns and accelerations. The task of any trader at all times has been reduced to simple advice - buy low and sell high. And within the framework of trend strategies, this advice can be reformulated as follows: buy on pullbacks, sell when the trend ends.
Moving averages, Alligator, Ichimoku and other trend indicators are not capable of generating entry points at the best prices. They lag behind the market, but they perfectly signal the presence of an already existing trend. But there is a class of indicators that can be used to determine minor market fluctuations. And these are, of course, oscillators.
Many traders use trend trading strategies with entry precisely at the moment of pullbacks, since when you buy on a pullback, you are essentially buying at the best price. This approach often uses a trend indicator to determine the general direction of the market and one or more oscillators to determine the completion of a pullback.
Here is a simple example of such a system - the trend is determined by finding two simple moving averages with periods of 100 and 48 relative to each other. An entry is made when the price approaches the moving average from the correct side (from below for sales and from above for purchases) and the CCI indicator is beyond the 100 or -100 levels.
I have highlighted the change in trend (crossing the averages) with green circles, potential entry points with blue rectangles, exit points with orange, and a false signal that was filtered by the CCI oscillator with a red square. As you can see, on trending currency pairs, even such a simple trading system can be quite profitable.
It is not necessary to use indicators to determine the completion of a rollback. For these purposes, various levels are often used, Fibonacci, Murray, Camarilla and others. Price Action patterns are also often used to confirm a signal.
In addition to the “Gambit” system already mentioned above, the idea of entering a trend on a pullback is used by such a well-known trading system as “Elder’s Three Screens” or the legendary “Base 150” system, the entry of which occurs after a breakdown of the moving average, but it is still highly recommended wait for a rollback after this breakout. It will also be interesting to get acquainted with the modern version of three screens - the Wildfire strategy.
Scenarios for ending trends
Climax
Impulse similar to climax
In this example, which is presented in this picture, there is no climax . There is rather some kind of news impulse here. However, I can’t say for sure. By and large, there is little point in looking for a climax on the chart. The main thing is to see the price acceleration in an already existing trend.
A true climax
Notice how before this the price was moving down, and then it accelerated sharply. Typically, such movements are created in order to lure certain traders into further movement on their STOPs .
Transition to flat at 3 points
It cannot be said that a trend will always end in a flat. It can smoothly slow down and then gradually turn around. And in this movement, there may not be an obvious flat!
In the same section, the author argues that the Forex market is characterized by false moves beyond the boundaries of the flat . Thus, large participants are gaining their positions. I will add that this is available in any market, and this is true.
Formation of a price corridor
In fact, for the trading system here, this is not a very successful example of a flat, with the position of a major player gaining ground. With your permission, I will give my example:
Flat with a set of position of a major player
As you can see there are false stems and high volume studs. This is how large players take traders’ positions at the expense of their STOPs.
Trading system – Flat
The definition of a flat does not always look the way it is written in this visual guide. However, it is correctly described here that if the flat range is small, then only the upper and lower limits should be used.
Definition of flat
And if the flat is large enough, then for orders you can also use approximately the middle of the corridor. The author shows and describes with his screenshot that in large flats there are trends, flats and microflats.
Which direction to trade in a flat?
Here, too, everything is described correctly, if you interpret Price Action analysis . in the VSA methodology, we will consider the dominant side. For example, if the upward movement is accompanied by volumes, but there is no downward movement. Most likely there will be an upward movement.
Priority directions of movement for opening positions
Further in the author’s trading system, there is a description of the entrances and exits when trading in a flat. In fact, I agree with everything that is described there. Therefore, just read about it in the trading system itself that you downloaded...
Market failures at the core of strategies
Any idea that has a chance of later developing into a trading strategy must exploit one or another market inefficiency. There are not so many of them, and yet, despite everything, such inefficiencies exist. Some of them are unstable and appear from time to time. A good, albeit hackneyed example is night scalpers. Trend strategies, as the name suggests, exploit market inefficiencies such as trends to make a profit. You all probably know how to identify trends, because this is one of the first knowledge acquired by beginners. Well, we will get acquainted with various classes of trending vehicles and analyze their features using real examples.
Any trading system involves support and resistance levels
Definitions of significant levels
around which the price “dances” can also be considered a significant level
Example of a significant level
Ichimoku Strategies
An entire article was recently written about this indicator. Therefore, we will not go deeper into the description.
Let’s just say that this indicator is quite multifunctional and, in addition to the breakout of the cloud at the price, the intersection of lines also gives excellent results. A whole system is used there, and if Ichimoku is used correctly, there will be few entries, but they will be simply “sniper-like” accurate.
Trading system - signals
Further in the trading system, there is a notorious description of many, not entirely significant sections. Which, rather, can be attributed to the individuality of the trader, as to a physiological individual. As for the signals for the trading system, here I will give comments on each signal given.
Signal 1
The first signal on the trading system
This moment is clearly taken out of context. Therefore, I do not recommend considering it as a good signal. Take a look for yourself, friends, there is no particular increase in volume that would indicate to us the interest of counterparties.
Signal 2
Second signal according to the trading system
Quite a good signal: there is volume, there is a big hairpin, and it is not taken out of context. Please note that as you move further, there are tails down with increased volume. Which also speaks of a certain force that holds the instrument back.
Signal 3
The third signal according to the trading system
Normal signal - you can use it!
Signal 4
The fourth signal according to the trading system
Yes that's right. In real-time trading, I would be confused by candles with tails down, so I would enter a little later - after confirmation.
After the signal you should always wait for confirmation!
In general, I don’t see any problems with the signals. They exist, and they are even quite good. All of them can be used except the first one. But here I did not see a very important point. That is, the author needs to specify in the trading system exactly when to enter. In history everything is always very clear. And in real time, you need to have a clear entry point.
Writing materials on trading in text is very difficult. It is much easier to do them in video format. This is what we have been doing for more than 6 years! Subscribe to us and get the cream of information!
YouTube channel
How to turn on intuition? Where is this button?
So, for successful intuitive trading, it is important to achieve a synergistic interaction between both parts of the brain. But this is not so easy to do. The left hemisphere works by default, but the right one... Best-selling trading author Mark Douglas points out a major problem with trying to master the art of intuitive trading. The problem is that we don’t have a “Turn on intuition” button. Bummer!
Even worse: our left hemisphere is dominant, and in an unprepared person it is caring (and in fact —
maliciously) puts a spoke in the wheels of intuition.
“What are you, an idiot? Where are you going? Look at the indicators! Follow the signals!” -
screams the internal tyrant logician, demanding information from a “trusted source”. Douglas warns that your reason will likely struggle with your intuition at first. With the best intentions, of course.
So what should we do?
Develop brain flexibility, liberate the subconscious, boost creativity. There are special exercises for this, meditation is used, entering a state of flow is recommended, etc. Google, as they say, is to the rescue! I especially recommend the book by Curtis Face “Trading Based on Intuition. How to make money on the stock exchange using the full potential of your brain." You could say the ABCs of a discretionary person.