Hello, dear readers!
45 years ago, trader and investor Richard Dennis made a bet with his friend William Eckhardt. Is it possible to train an ordinary person on the street to trade profitably on the stock exchange if you follow certain rules?
The experiment lasted 5 years. During this time, Dennis's students turned $23 million into $175. This was the legendary strategy of the turtles, showing how important a chosen clear set of rules is in stock trading. Therefore, in this article we will consider trading strategies in the stock market.
#1. 30 minute range.
This is a day trading strategy that I read about quite a few years ago in a book that I believe was written by Perry Kaufman.
The idea is to watch the market for the first 30 minutes using a 5 minute chart.
You then draw a resistance line on the chart at the highest level the market reached during the first 30 minutes. And draw a support line at the lowest level. This is your range.
Then you wait until the market breaks one of these lines and you enter a trade in that direction.
For example, at 8am GMT yesterday the FTSE 100 opened at 6,507.2. The lowest price in the first 30 minutes was 6503.3, and the highest was 6525.5.
At 9:25 am, the FTSE broke through 6526.3, breaking the upper range and indicating a buy signal. The stop loss can then be placed below the lower range.
Profits can be made using another indicator such as Pivot Levels or RSI. Or you can place your take profit based on the risk:reward ratio. You can also use a trailing stop.
As you can see, the strategy worked out great:
Where and from whom to learn trading
When investing and trading in the stock market, practice is key. Knowledge that is not supported by action is worthless. A savvy theorist who has read a sea of literature will not be able to compete with a stock trader who has worked for at least a month.
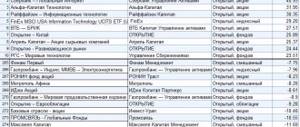
So that the initial period of your trading does not end in a sad fiasco, I offer a choice of several stock brokers for training:
| Name | Reliability | Distance learning |
| Opening | High. The acquired skills are honed on a demo account. Most stock instruments are free | Present |
| VTB 24 | High. Several courses on the stock market, depending on the level of preparation. | Video format. In-person seminars on trading in the stock market are held in large cities |
| ALOR | High. During trading, the investor receives remote support from the broker | Present |
# 2. Pivot strategy No. 1
I already mentioned, pivot points are one of my favorite day trading strategies because I know professional day traders still look at them. You can read more about Pivot Levels in this article.
The first simple method of using pivot points is to buy when the market hits a pivot level and sell when the market hits a resistance point.
Make it a rule to only buy at the pivot level if the market is in an uptrend. And sell only at a reversal from the level if the market is in a downward trend.
If the market completely breaks the third support, it is usually not worth buying. Since the price will most likely bounce off the level because traders are taking profits, it is only sometimes that you will be able to take a few pips out of the market.
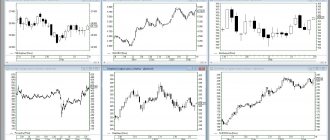
As you can see in the following example, the FTSE 100 (which is in a multi-month uptrend) has moved nicely from yesterday to the day before. The second resistance was a great place to sell:
Opening London Strategy
Since we started with session Forex strategies, let’s continue the topic now on the European part of trading, namely at the opening of London. As you know, this is the largest trading platform in the Old World, therefore, with the start of trading on the London Stock Exchange, quotes begin to move actively.
But there is one nuance - you cannot enter the market immediately after the opening, since there is no direction yet; for a few minutes the chart is just chaos. To filter all this, you need to wait until the first M30 candle closes immediately after the start of trading on this site. By this time, the rest of the European exchanges will have already traded for an hour and a half; London will have traded for half an hour. This period is considered optimal for the emergence of a short-term trend, which includes the main direction on the M30.
Trading scheme
Trading is carried out on the GBP/USD pair, but you can also consider other options with the pound, for example GBP/JPY or even GBP/AUD. So, we look at how the candle closed and at the opening of the next one, that is, at 10:30, if we consider Moscow summer time, we place pending orders:
- At the high of this first candle M30 London. If the trend developed upward, that is, the candle closed with growth, then trading will continue the trend.
- At the low level of this candle. If we consider the same example with growth, then the triggering of a pending sale will be an entry into a new trend, which is just emerging and may have quite a large potential. For a candle that closes down, everything is the same, only in the opposite direction.
As a result, we end up with two pending orders. If the first candle closes in such a way that it has practically no shadow (less than 3 points), then you can open directly from the market. In other cases, do not forget about the spread, that is, for breakout purchases you need to take the level of the maximum and also add the spread value to it. For the minimum, of course, this is not required.
As a result, we get two orders, but only one should work. This precaution is necessary to avoid situations when there is no trend in the market and the price alternately updates opposite extremes. Accordingly, if one of the two works, then the remaining one is simply deleted.
Now let’s look at the parameters of the order that will open, and for us exactly one of the two will open:
- A stop order is always placed at the opposite extreme of this very first candle. That is, essentially in the same place as the second deposit. The meaning is the same as in the case of placing orders - if the market catches a delay and moves in the opposite direction, then losses will be limited to the current value.
- The take profit can be set either fixed, which is obtained from the desired ratio of take to stop, for example, equality, or you can subsequently leave the position at breakeven and hold it until signs of a reversal appear on the same M30 chart. Such signs most often include an engulfing pattern, consecutive bars closing against the trend (2 or more), graphic patterns on short periods, and so on.
If you still decide to trade on crosses, then you should familiarize yourself with the value of a point of a given currency pair in the contract specifications, since they can vary significantly.
I also recommend reading:
MACD indicator - how to use? Setup and Application
Indicator analysis is represented by a huge number of different tools, which are divided into types and types according to their purpose. Anyway […]
# 3. Pivot strategy No. 2
Pivots can be used in a variety of ways and work great as profit targets. And when placing a stop, you must make sure that it is away from the key pivot level.
Another role of the pivot is that it is a trend indicator. So, if the market is above the pivot then it is an uptrend and if the market is below the pivot then it is bearish.
Buying the market as the price goes up from the level and selling when it goes down is another method that traders use.
What distinguishes a speculator from an investor
Speculation refers to trading with repeated purchase and sale of assets while holding a position from several seconds to several weeks - an attempt to make money on price fluctuations over short periods of time. Trading speculation is possible both on a rise in value (long position) and a fall (short position).
An investor buys an asset on the stock market in order to profit from growth and receive dividends.
The terms of investment strategies range from a year to decades.
Classification of speculators
- Scalping. Work within the spread of the order book, quickly buy/sell, up to hundreds of transactions per trading session.
- Intraday. Intraday trading, open positions are not carried over to the next trading day. On average from 1 to 5 transactions per session.
- Swing. A strategy for following short-term stock market trends. Trend is your friend. Work from 1 day.
Investor classification
- Short-term investment - up to 1 year.
- Medium term - from one year to 3 years.
- Long-term - over 3 years.
Warning about Forex and binary options
Binary options are bets on price movements. The name contains an algorithm - all or nothing, winning or completely losing the money you bet. BO in the Russian market is not a strategy, but a roulette that has nothing to do with the stock market. A breeding ground for trade fraud. In some countries they are prohibited, in others they are under the control of regulatory authorities.
Forex is an international interbank currency exchange market. Holes in the legislation of our country allow the existence of companies speculating on this topic.
When signing an agreement with a Forex dealer, you must understand that you bear great risks as a non-professional market participant; you will not apply any strategies here.
# 4. Opening gap
When a Gap occurs at the open, it shows that a large number of traders have moved to one side of the trade, and this imbalance often predicts that the market will continue in that direction.
However, in stocks, scalpers often buy into the market and try to see a closed gap.
There were shares, when it opens below the low of the previous day, when retested, as can be seen from the chart, it gives a good profit.
How to choose a trading strategy
Useful articles
What is Carry trade: pros and cons of the strategy, who is it suitable for?
We destroy myths about “promoted” forex traders in Russia and the world
Reviews about working as a trader: how beginners are scammed
How much money do you need to invest in stocks to quit and live on dividends?
The choice of trading strategy depends on your preferences or the specific situation that develops in the market. Knowledge of the chosen trading algorithm will allow the trader to open the right position that will bring him profit in the stock market.
#5. Create your own levels
Of course, traders look at pivot points and this helps them work.
But pivot points are just simple formulas based on the previous day's price range. After all, it's easy to create your own levels.
A trader I know did just that. He modified the reference levels slightly and used a simple formula to create his own levels, which turned out to have an amazing ability to predict market turns.
Pivot (P) = (top + bottom + close) / 3 R1 = P + (P - bottom) S1 = P - (top - P) R2 = P + (top - bottom) S2 = P - (top - bottom) R3 = top + 2 × (P - bottom) S3 = bottom - 2 × (top - P)
Strategy No. 3. Breakout of support and resistance levels
The strategy of breaking through support and resistance levels can in fact be called one of the most effective. One of its important advantages is the speed of obtaining results.
As a rule, stock quotes, after overcoming a level, quickly begin to either continue the trend or roll back, thereby losing their strength.
What is the main idea of breaking levels?
All markets have price ranges where the price often reverses or is in a flat (trading) for a long time. When a level is broken, a powerful impulse in the direction of movement most often occurs. Typically, its power is based on those who enter trades with the trend and those who close their positions with stop losses.
After a breakdown, stock quotes often go up 5-10% in just a couple of days, and maybe even within one day. There are also much stronger penetrations. It all depends on how long the flat was and how important the price level is.
An example of breaking a level in theory:
Here's what it looks like in real trading:
One more example:
# 6. Chaikin indicator
Many technical indicators seem to do the same thing, just under a different guise. But the Chaikin Volatility Indicator, developed by Mark Chaikin, seems a little different.
The Chaikin Volatility Indicator attempts to match increased volume with price movements, but why is it different?
Take a look at the hourly chart below. While most indicators seem to move in random patterns, Chaikin shows a clear pattern because it takes volume into account.
As you can see, Chaikin crosses the zero line at approximately the same time every day. (Usually around 12 - 2 pm when US markets begin to act).
This helps with timing. So the idea is to buy/sell the market only when it crosses the zero line.
Therefore, if the last candle was green, buy the market when the zero line is crossed, and if the last candle was red, sell when the zero line is crossed. (But don't trade if the RSI is either oversold or overbought). This will put you in a situation where the markets will start to overheat and hold you back when trading stops.
It would be wise to exit the trade when Chaikin is close to his peak, so look for Chaikin when he hits 80-120, or wait for the indicator to turn down.
Attention: rollback
And the last strategy for today is “Attention: rollback”. As you guessed, she is counter-trend movements:
We have marked record volumes with red arrows. We see that after the candles marked with green arrows, a rollback begins without delay.
How to use the strategy? The price cannot withstand the surge in volumes and goes sideways or rollback. Your task is to wait for the “fading” and find a false breakout of the sideways trend on a lower timeframe. Trade only with the trend.
#7 Combination Indicators (Cowabunga Style)
One of the most popular day trading strategies is indicator aggregation as it helps confirm the trend and direction you want to trade.
One good example of this is the Cowabunga Forex system, which has been discussed on the Baby Pips forum for several years.
The creator of the Cowabunga system looks at two diagrams; a four-hour chart to confirm the long-term trend and a 15-minute chart to enter the trade. Long trades are only taken if the four-hour chart is in an uptrend and the 15-minute chart shows the following:
- The 5 EMA should cross upward the 10 EMA (indicated on my chart by a black candle)
- RSI must be greater than 50
- Stochastic should be directed upward and not be in the overbought zone
- The MACD histogram should go from negative to positive or be negative and begin to increase in value. (We want to catch trends early, so the MACD histogram should be negative).
Also, when using Cowabunga, you should try to avoid markets during press releases.
Trading strategy “Three moving averages” (short-term option)
There is another interesting option for using the same set of indicators as in the previous case, but only now it will be practically a scalping strategy on Forex.
Trading scheme
The main schedule remains hourly. You need to wait for the moment when a good trend movement begins. The moving averages should be arranged in this order (let’s look at the example of a falling market):
- Slow
- Average
- Fast
For bullish, respectively, in the reverse order. So, such an arrangement indicates a powerful trend. Since all the values were chosen for a reason, we will enter each time the price approaches the fast moving average to rebound from it. There may not be a touch, so we take a range of 10-15 points near it. The stop is located behind the average moving average. Take profit is determined by the trader himself, but you can count on 30-50 profit points.
#8. News trading
If robots are so common in today's markets, one way to defeat this would certainly be to respond to news releases.
However, computers are already becoming so smart that they read news feeds and instantly react to events.
However, a good way to trade news is to make sure you know exactly how the market views the situation before the news release occurs and what the traders themselves are expecting.
For example, if markets expect the Federal Reserve to raise interest rates, that effect will already be reflected in the markets, and they won't move too much when it actually happens.
The big move will come when the Fed surprises the market.
The next time the Fed meets to discuss interest rates (or whenever a big event looms), decide what outcome the market expects and analyze whether the event will make sense for the unexpected outcome.
Placing a trade shortly before an event and then closing it once the market has priced in the new situation is a good strategy for day traders.
The important point is not to jump on board with an old press release, but to know the importance of the announcement and how much of a surprise it will be to the markets.
If it is a big surprise, there will be a large and prolonged movement, and may even last for several days. These events provide more opportunities for profit.
Another method of news trading is to simply keep your ear to the ground when the market is open.
There are many companies that offer live news streaming, although it is expensive.
You will have no luck with liquid and heavily traded markets because bank traders and hedge funds get information faster. But maybe you could create a small watchlist of traded stocks and keep an eye on any big news.
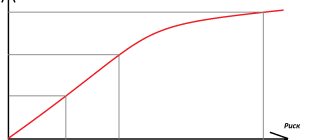
The Importance of Trading Strategy
The chosen investment strategy determines the risks that the investor is willing to take and the investment time horizon.
If you rely on investing large sums in order to preserve capital and carefully increase it within a little more than a bank deposit, this is a direct path to a long-term investment strategy in the stock market.
If you are willing to take risks, if you want to quickly increase your capital, this is the path of a trading speculator.
#9. Absorption Candles
There is a lot of debate about the effectiveness of using candlesticks in trading, but one thing is for sure, there are very few traders who use anything other than candlestick charts when trading.
Probably my favorite candlestick pattern is the bearish or bullish engulfing pattern.
A Bullish Engulfing pattern occurs when a bearish red candle is immediately followed by a large green candle that completely engulfs the previous day's candle.
The Bearish Engulfing picture is simply the opposite. A good example of this occurred the other day for the EUR/GBP pair
#10. Doji candlestick
They occur when the price moves up, down, but ends up where it started. Therefore, the candle has a barely noticeable body, and two long wicks coming out from the top and bottom.
Doji indicate uncertainty, so they can signal a reversal, and often occur during major news events.
The best way to day trade Doji depends on the long term trend. If the market falls and then enters a big Doji, you should take this signal as a bullish sign and look to buy. If the market develops and there is a doji, you should sell.
Doji is one type of trading that should probably always be combined with some other strategy.
Forex strategy “Three moving averages”
The best forex strategies are usually simple and at the same time effective. It is not easy to meet these two criteria, so they are usually designed for large time frames. Let's consider a very interesting technique, which is based on the simplest definition of a trend. as well as on only three indicators of the same type - moving averages.
Trading scheme
To work, we need a chart of any active currency pair (very good to use on the pound) for the H4 period and another for the H1 period. We add three moving averages to the hourly chart:
- Simple moving average with a period of 240.
- A simple moving average with a period half the previous one, that is, 120.
- Exponential moving average with a period from 36 to 72, 48 is considered optimal.
Interesting poll at the end of the article!
Don’t leave early - take the survey) It’s both useful and informative)
Go to survey>>
So, we determine the trend on the four-hour chart. The best option is if a reversal has recently occurred and the trend is just beginning to develop. This rarely happens abruptly, so a correction always begins after the first movement in a new direction. After its completion, the trend direction resumes. For those who are familiar with wave theory, at least in general terms, these can be called leading waves, that is, 1 and 2. Let’s move on to the hourly chart and look at the position of the moving averages on it. The slow one, which has a period of 240, begins to gradually unfold, although not necessarily, it all depends on the situation. The main thing is that the average moving average with a period of 120 ends up in the following position:
- Above the slow one if an upward trend develops.
- Below slow if a downward trend develops.
Now we are waiting for a signal from the fast moving average. It should cross the average by analogy with the location of the previously mentioned indicators, that is, to enter a buy position after a correction, the fast moving average crosses the average from bottom to top. This is how a signal to enter the market arises.
Take profit and stop loss
Now let's move on to the stop. Limitation of losses due to the fact that the main time frame is still H4 should be placed behind the local extremum on the four-hour chart. This may be the level of the end of the correction or even be removed from the very beginning of the trend. The size will be quite large and reach 120-180 points. Setting short stops is completely pointless, as is early breakeven before the price moves 100 points in the desired direction.
The take profit is either fixed - twice the stop, or you can use the same scheme with moving averages, or rather, with their relative position. There are two options:
- Take profit at the moment when the average moving average crosses the slow one against the trend. This will indicate the beginning of a new correction on H4.
- Take profit at the moment when the slow moving average moves to a horizontal position or changes the direction of its slope.
- When a clear reversal pattern forms, as in the example in the picture above.
I also recommend reading:
How much can you earn on Forex? And is this even real?
This question was asked at least once by everyone who tried to trade or was at least interested in financial markets. In real […]
#11. Pairs trading
Pairs trading is quite simple, but again, it is difficult to succeed when the markets are so efficient.
First of all, you need to look for two stocks in the same category that are moving in different directions, and for this you can use different market scanners. For example, on Finviz or on the Thinkorswim trading platform.
The idea is to sell the weaker stock and buy the strongest one (in the same category). You should hold the trade for no more than one day and exit when you have made a good profit.
How to properly manage risk (money management)
In short, the whole essence of money management comes down to not risking more than 5% of your capital in any situation. If you are just starting out in trading, set yourself a limit of 3% for the first time until you learn how to earn money consistently.
You should also know that there can be a series of 5-7 profitable and unprofitable trades in a row. Therefore, take this quite normally and do not conclude that the strategy is complete “bullshit” and does not work or will make you a millionaire in a matter of hours.
Good advice! Don't try to win back if you have made several losing trades. Take a short break from trading and continue trading according to the strategy. Trying to win back only leads to greater losses.
If the strategy involves setting a stop loss (limiting losses), then you must set a stop loss when opening a trade.
Also, do not use averaging during a loss, that is, opening additional trades in the hope that the price will reverse and go in the other direction. Several times, perhaps, this will allow you to gain profit, but at some point you will definitely receive a serious loss. This is exactly how martingales work.
You can increase the risk only in one case - if you consciously go to increase the deposit and understand that you can either quickly increase the deposit several times or lose everything.
#12. Trend lines
The problem with technical indicators is that they inherently lag. Behind them are traders from all over the world who receive the same signals.
This is why many successful day traders ignore indicators and only look at naked price patterns.
Trendlines are the cornerstone of technical analysis and trend trading. Anyone can draw trend lines on a chart using a modern mapping package.
Upward trend lines must be connected by at least two higher levels, and downward trend lines must be connected by at least two lower highs. But the trick to trendline trading is strict risk management and careful position sizing.
In this example, a break of the downtrend line is a good buy signal. The new uptrend line gives the trader room for a stop. The stop can then be moved as the trend progresses.
It is equally important to trade the correct position size. If you are unable to estimate the odds of your trade, use the Kelly calculator ++https://www.albionresearch.com/kelly/+ and you can find the correct position size to use in your trade.
Nauhatl
An interesting strategy that specializes in trading currency pairs located in different time zones (usually GBP/JPY, GBP/USD are used). It is based on the use of a number of technical analysis indicators.
#13. Triangle patterns
Triangle patterns are formed from converging trend lines so can be traded in a similar way and I have covered them in detail here.
Triangle patterns such as wedges are useful for finding markets that are about to enter new trends. They are useful because you can immediately start trading a new trend without having to wait for technical indicator crossovers.
Trading strategy by volume
After familiarizing yourself with the main theoretical aspects, you can move directly to the practical side of the work. To begin with, short-term time periods ranging from fifteen minutes to half an hour are preferable for implementing the trading methodology under consideration. To work, you will need to install two automatic indicators on the chart - “Market Facilitation Index” (abbreviated as MFI) and “Volume”.
They are both custom and therefore require manual installation. It is performed according to a standard algorithm for most trading indicators, implemented as follows:
- First of all, you need to find and download these tools on the Internet. They are both free and open access, so they can be easily found on thematic online resources;
- After downloading all the necessary files, you should move them to the folder with custom indicators of the trading client used by the speculator to conduct financial transactions. You can find it in the root directive of the platform;
- The next step is to restart the working client, which is necessary so that the instruments in question begin to appear in the menu with other indicators, from which they can be plotted on a working chart for later use.
The trading indicators used belong to the oscillator type, and therefore have the form of a histogram. It is in this quality that they are presented directly on the working chart: the readings of the algorithms are located in separate windows located at the bottom of the interface. In the settings, the user will only be able to change the external characteristics of the indicators, so it is pointless to dwell on them in detail.
#14. Correlation
Another thing to pay attention to when day trading is the different correlations between assets.
You can apply a technical technique and create correlation matrices. This way, you can buy an asset when the correlation moves away from the average. Or you can keep it simple and just use common sense.
The idea is to find which markets move together and which move inversely.
For example, crude oil and the US dollar typically move in opposite directions (because oil is priced in dollars, after all). This means that when the dollar falls, oil becomes more expensive and increases in price.
But these correlations don't always last, and when they break, it presents a golden opportunity to trigger a hedged trade.
For example, if your analysis says oil supplies are rising, but you also think the dollar will rise (perhaps because the US economy is growing and the Fed wants to raise rates), you could buy both the dollar and oil at the same time.
They usually cancel each other out, but in certain scenarios they can provide low-risk trades.
Macro-economic trading
Macroeconomic traders mainly focus on long-term fundamental data that determines a country's economy. These traders can hold positions for months and even years. Many of them have only a few positions open throughout the year. These traders choose their positions carefully because their number is very limited.
Some of the most important economic data that macroeconomic traders study include a country's GDP data, current inflation and employment situation, interest rates and trade balance data.
It is from this primary data set of macroeconomic indicators that a trader can begin to build a forecast, his expectations from a particular country and its exchange rate in relation to other countries.
Successful macro traders can spot new trends in the current business cycle and prepare to enter the market before many others realize the impending changes. These traders tend to be well aware of the overall market sentiment and look for early shifts in market sentiment and psychology.
Although macroeconomic traders rely primarily on fundamental analysis techniques, they also often use technical analysis to plan their trades and find optimal market entry and exit points.
An important analytical method used by many macroeconomic traders is the use of intermarket analysis. They regularly study the cause-and-effect relationships between different asset classes.
For example, macroeconomic traders want to know:
- How do government bonds move relative to stocks?
- What impact do certain currencies have on crude oil prices?
- What are the prices of basic commodities relative to the US dollar?
- What is the relationship between gold and stocks?
These are just some of the questions that macroeconomic traders try to answer before making their forecast.
# 15. Pump and dump on the stock exchange (Pump and dumps or P&D)
Penny stocks (trading as low as $1) have caused people to lose a lot of money over the years and should generally be avoided.
Penny stock promoters pay to promote worthless companies, which are usually little more than "projectiles" for shadier operations.
Marketing campaigns push ultra-cheap stocks down to a couple of cents and allow promoters to get their money back and more. They then sell their shares, leaving those who bought them with large losses.
But is it possible to take advantage of fraud by going the other way?
Tim Sykes is a stock trader who watches for scams in Penny Stocks, then he tries to sell them once they are pumped up by the promoters.
The moves from some of these dumps can be very sharp and fast, making them ideal for day traders.
So what pump and dump should you look for? Marijuana, solar energy, bitcoin, biotechnology, mining, foreign companies.
It turns out that volumes on the FX market are a hoax?
We asked the same question. And they found the answer in currency futures:
Open TradingView and enter "Euro futures" or copy "6E1!" and paste it into the search. The Eurodollar futures chart will open.
Next, on the top panel near the plus sign, click “Fx”: a list of indicators will open. Enter "Volume" and select it from the list:
Volumes will appear on the chart. Compare them with volumes on the Eurodollar, EUR/USD. Same columns, just different scale.
#16. Go with the flow - read the feed
Jesse Livermore is one of the most famous stock traders of all time, and he is known for relying on his tape reading skills and pure price action.
Jesse traded so much in the market that he developed an intuition. Because of this, he never needed anything more than bare price sequence to open trades.
Trading this way requires you to go with the flow. You tune into the market and become “one” with it without trying to predict.
It may take years of practice, but it still works...
For example, a Japanese CIS day trader can monitor hundreds of different markets and sense when a stock is about to move. He "monitors chats and has his eyes glued to the bid-ask screens." He typically looks at the 300 most heavily traded stocks.
And his only rule is: “buy shares that are being bought and sell shares that are being sold.”
What should be the strategy for beginners
Trading strategy in the foreign exchange market - business tactics, a model for determining the moments of opening and closing transactions.
There is no consensus on which scheme is ideal for novice traders. Each person is individual, has specific skills and abilities. One person finds technical analysis easy, while the other uses indicators and charts. When choosing an investment model, beginners should be guided by personal preferences. For example, a strategy replete with terms, indicators, and complex formulas will be difficult to understand. If a Forex market user does not perceive the work of a particular analyzer, the investment will be erroneous and lead to losses. You should not completely abandon indexes; it is advisable to choose two or three as a basis and become familiar with their purpose in detail.
Forex strategies for beginners should be simple and understandable. The optimal option is a scheme that will not require constant training or long-term contact with the trading platform from the trader. At the initial stage, it is better to spend short periods of time investing so that each step is meaningful and deliberate. Gaming experience does not come immediately.
Basic recommendations on setting stop losses, choosing take profits, and foreign exchange assets greatly simplify trading. A detailed description of the system’s algorithm allows the investor to understand the principle of chart operation and trend formation. Therefore, the market client can independently select and conclude profitable deals without much difficulty.
It is recommended to avoid strategies with high stated profitability. High returns always go along with maximum risks. A beginner is not ready to professionally manage his own capital; the probability of losses is very high. It is very difficult to earn millions from the first day of being on the foreign exchange market; it is better to increase the amount of finance by a few percent, but steadily.
Today, dozens of simple tactics have been formed that are ideal for inexperienced traders. Each scheme includes elements of popular programs. After standard training, a beginner is able to independently decide on trading instruments and create a system of rules.
In most cases, it is most effective to use a plan that has been worked out over the years. Professionals actively share their experience of building a successful business, post videos, conduct forums, webinars, and publish articles. These materials provide real statistics on the development of a business and describe the effectiveness of a particular strategy. Before making an investment, it is better to spend extra hours getting acquainted with reviews and ratings than to regret the lost money later.
#17. Moving averages and long-term trend
Another thing Jesse Livermore teaches is that nothing is more important than the long-term trend. In other words, are you in a bull market or a bear market?
I know traders who enter a bull market and try to sell every day, simply because it seems like the most natural thing to do. After all, the market is more expensive than yesterday, so it should be lower today.
This is the most difficult way, since the trend continues on and on.
An easier way to trade is to determine the direction you want to trade and then use short-term indicators to enter your positions.
In fact, it may be the easiest way to trade, whether you are a beginner or a professional.
If you are in a bull market, trade long positions. And if the 20th MA crosses the 50 Moving Average, open a position.
Likewise, if you are in a bear market, only trade short.
Analysis of the graph and search for patterns
Let's get down to business. Let's come up with a strategy by searching for patterns in quotes. Let's open an hourly chart for example.
If you have a mathematical mind, then it is not difficult to discover many regularities (patterns). For example, you can look for a pattern in the fact that at the opening the market most often opens with growth. If you look even more closely, you can say that the strongest growth occurs in the first hour; at lunchtime, quotes slow down or begin to fall. Beginners like to study morning price gaps because most often they are followed by a pullback.
And if we add indicators to the chart, we will find even more patterns. For example, I like the RSI oscillator. It’s easy to notice that when it enters the red zone (below 20), the price bounces up (of course, this is not in 100% of cases, but often). This situation is called oversold. And if the RSI is in the green zone (above 80), there is a possibility of an early decline.
Great, we've already come up with a few patterns. Is it time to earn money? We begin to act according to our methodology and it turns out that after the first two profitable transactions, the last one produces a loss. What to do? I don’t want to close it down. The market always rolls back up. As a result, our trading gradually developed into investing. The deal is going further into the negative, and we are just waiting.
Here's what happened a week after the flat discussed above:
If we also opened positions based on oversold and overbought conditions, we would have ended up in a good minus. As I already noted: one strategy works great in one period of time and loses in another.
What was the mistake? The fact is that we did not limit losses with a stop loss. But in today's market, placing stops is problematic due to high volatility. Large players know exactly where the flow of sell orders accumulates and can artificially bring prices down to this level. And they themselves will buy our assets cheaply.
Therefore, if you set a stop, you need to do it at a decent distance from the current price. So that market noise and stock sharks do not cut him off. But if we set the stop 5-10% lower, it turns out that in one trade we are risking too much of the deposit. This means we will have to open a position for a smaller amount. Somewhere by 10-20% of the deposit. In this case, we will risk significantly less even with a stopping level over a long distance. But on the other hand, we will earn less.
Further testing of the strategy turns into an inconvenient undertaking. After all, every time we will think differently and set stops the same way, so we need some rules. How to set a stop loss so that it really protects our position is an extremely large topic. I recommend to read:
- How to look for the best stop loss levels;
The divergence and convergence of the RSI and MACD indicators also works great.
We made a small profit from price fluctuations. Well, let's say 1-3% per transaction. Over time, the trader will discover that periodically there are moments when the price leaves the range and moves by 10-15% in the direction of the breakout. We could make the average trader's annual income in one trade. So maybe we were wrong? Maybe it was worth opening positions the other way around? When RSI exceeds 80, should you buy rather than sell? Strange as it may seem, such a strategy is likely to even give more profit, and the whole point comes from the paradox of price (we discussed this a little higher).
What can we say in the end?
Do the patterns in the market that we obtained when analyzing history over the past 1-2 months work? They work, but with a huge risk of going negative and turning us into long-term investors who will stubbornly hold on to what falls, instead of making money on subsequent growth. Setting a stop loss is difficult and no one wants to.
Of course, with a more thorough analysis of the history for at least 2 years, you can adjust the strategy in such a way that 2 transactions are negative and 3 are positive. In this case, the annual result will most likely be at the level of 10-20% per annum plus. Which is extremely small for daily trading operations. This takes up our time. Securities already grow by this percentage on average every year.
In fact, longer-term strategies bring more profit. Let's talk about them further.
#18. Build a mechanical trading system
If you want to build a mechanical day trading system and test it using a program like Amibroker or TradeStaion, you're in for a big hit.
Building an intraday system will bring with it a very long list of obstacles, and it is an expensive and time-consuming process.
In fact, I will save you time by telling you not to try to use an automated trading system for day trading (especially Forex). You simply cannot make money from this. Not when you're playing against Goldman Sachs and the "robots."
The best bet would be to create a basic trading system that at least breaks even.
Then use your human intuition and market knowledge to join forces with the robot and come out ahead.
Trading strategies: let's summarize
In this lesson, we discussed a variety of trading strategies in financial markets. We covered scalping, day trading, swing trading, as well as position trading on macroeconomic indicators. Additionally, we discussed the use of discretionary and algorithmic trading systems.
With this knowledge, you can decide which trading style best suits your personality. For example, my trading style is focused on a discretionary swing trading style. This is what works best for me and I stick with it. Now it’s your turn to explore the various options available and choose the best trading strategy for yourself.
#19. Use of screening and online tools
In the next article, I will discuss some free online tools that traders use while trading. They are mainly designed for medium to long term trading, but you can use them for day trading as well.
Using a stock screener such as Finviz or Google Screener, you can display stocks that you think might be good candidates to buy or sell during day trading.
Look for high volume stocks that are significantly oversold or overbought according to RSI or technical readings. Combine these readings with fundamental indicators such as PE or PEG.
Let's say you find a stock with a PE below 15, PEG below 1, RSI of 18, and high insider ownership. You could buy at the open and exit at the close.
Overall, while there is momentum in short-term day trading, fundamental value drivers can take a long time to change.
You can also look for interesting articles on Seeking Alpha Pro that may be relevant in your next session.
Or, browse StockTwits and Twitter for stocks that are experiencing high social volume.
If you see a stock market starting to trade on StockTwits, take a look at the price chart. Maybe it is near a support level or maybe it is about to break a trend line. Keep watching it and if it breaks out you will have your deal.
Types of trading strategies
Below we will look at some types of trading strategies in the stock market.
Asset Allocation
Investment strategy with different classes of instruments. There is no single trading scheme that strictly stipulates - this is 5%, that is 7.5% and not an ounce more. Forming an investment portfolio in this strategy is similar to the approach of an artist - a lot depends on inspiration and goals.
The main thing is risk diversification. The ideal situation is when portfolio assets do not correlate with each other, the correlation is negative. Moreover, the movement of one does not automatically affect the price of the other. But in reality this is impossible: the correlation is taken into account and, if possible, minimized.
Old fact: gold is an indicator of fear. When the market falls, the precious metal often goes against the stock market. Stocks are falling, gold is rising. Simple trading strategy.
There is no strict list of assets for forming a portfolio in the stock market. This:
- stock market instruments - shares, bonds;
- mutual funds, ETFs;
- commodity assets;
- REITs and sometimes real estate;
- cash, currency;
- derivatives on underlying assets - from the stock market to dairy products.
The list can be expanded indefinitely. The approach to portfolio formation is flexible. The general point of a trading strategy is the distribution of risks and expected returns.
Dividend strategy
Based on dividend payments by companies. We are interested in those who pay dividends regularly. The size and terms of payments are determined by shareholders. This happens once a year, less often - six months or three months.
Technology for receiving dividends:
- Shareholder cut-off date. It is known in advance and follows the reporting period. Payments for 2021: cut-off for Gazprom shares - 07/19/2019, Rosneft - 07/02. Dates are at the discretion of the companies themselves. At the cut-off time, shares must be in the account to receive dividends. It is not necessary to hold shares for the entire previous year; you can buy a few days before the cutoff and sell immediately after it.
- After the cut-off, no later than two months, shareholders gather and approve the amount of payments.
Table of dividend payments for 2021 in the oil and gas and banking sectors. Companies are traded on the MICEX.
The average size is from 1 to 9%.
The usual practice of dividend stocks on the market is that before the cutoff the value increases, and after it the value falls. If you bought just before the cutoff on growth and then sold, the size of the dividends may not cover these jumps. This is always an additional risk in the stock market.
How to choose securities with the best dividends
Issuers are required to post information about “material facts.” This includes decisions of the board of directors.
55 days before the meeting at which the cut-off date is determined, they decide on the payment or absence of dividends and preliminary amounts. This gives you time to analyze and buy in advance. In addition, two to three weeks pass from the meeting to decide the date until the cutoff. This is an additional period for thinking about whether it is worth participating in the dividend race of the stock market.
Expert opinion
Vladimir Silchenko
Private investor, entrepreneur and blog author
Ask a Question
In addition to the approach of buying exclusively for dividends, there remains a “buy and hold” strategy with an investment horizon of one year.
Cost strategy
A strategy built on undervalued market assets. The trading investment horizon is a year or more. The investor determines the criteria for valuation below the market himself - based on experience, insight or fundamental indicators. The latest trading approach is based on fundamental analysis ratios.
Some of them:
- EPS is the ratio of net profit to the number of shares, that is, how much you can earn on one share. A key parameter for building a strategy.
- P/B is the ratio of share price to inventory. Inventories are the balance of materials after debts are paid off. When the parameter is less than 1, the company is undervalued, from 1 to 2 is a fair assessment, >2 is overvalued.
- EV/EBITDA - gives a quick assessment of overvaluation or, conversely, compared to competitors. Shows over what time period the company’s profit not spent on depreciation and payment of interest and taxes will recoup the cost of its acquisition.
Growth strategy
Based on the assumption of an increase in the value of securities on the stock market. The starting point for making a decision may be:
- fundamentals;
- inside information - information available to a limited circle of people that can change the value of assets;
- there is a long-term upward trend.
The decision to purchase can be made based on fundamental ratios showing the revaluation of trading assets on the market.
Trading
Trading - active trading of assets intraday or over a medium-term horizon - up to several weeks.
Varieties:
- Scalping. Frequent intraday transactions. The instrument is the stock order book.
Algorithm: buy/sell in a spread. I bought it and immediately put it up for sale. The number of transactions reaches hundreds per trading day on the stock exchange. For scalping, automated trading is often used, when orders are placed by a robot based on a hard-wired algorithm. Watch the video to see how this happens in stock trading. - Intraday. Intraday trading. The standard working time frame is from 5 to 15 minutes. An open position cannot be carried over to another trading day.
- Swing strategy. Trading on price changes in the short term. The trader does not consider fundamental indicators; the trend movement is used for entry. Getting into a trend on time, closing a trade on time and reversing into the opposite position is the essence of a swing. Trading from one day, working frame - 15 minutes/1 hour/4 hours.
The chart shows a theoretical version of entries and closings with a reversal, hourly candles.
#20. Just sit and wait.
Sometimes the best approach for a day trader is to do nothing. Short-term opportunities rarely arise, so traders must learn to do nothing at all until a suitable opportunity arises.
Wait on the sidelines and don't take any action until something really big happens that is so incredible that it would be a mistake to miss it.
If you stay focused and continue to do your analysis and research, these opportunities will actually become more frequent, which is what most traders realize.
But if the markets are calm and there are no trends or opportunities, just do nothing.
Even day traders don't have to trade every day.
- Tweet
- Share 0
- +1
- LinkedIn 0
- VKontakte
VSA - a new approach to trading
Volume Spread Analysis (VSA) - this direction is based on the analysis of impulses, volumes and further price reaction. In other words, the trader must find the actions of major players and understand what he is doing: buying or folding. For beginners, analyzing the situation using VSA will seem like a dark forest, since such studies require a lot of experience.
Many traders are fanatical about VSA, believing it to be the only way to reliably make money. But as practice shows, it’s not worth giving strong hopes for this.
I agree that there are some VSA patterns that you should know (up trend, pin bar for example). But it would be wrong to base your trading solely on this data. Or more accurately, it may be correct if you are already very experienced. But an experienced trader also applies other knowledge. He can’t even describe this experience in words, he just feels the market better: when to enter and when not to.
If you tell the same strategy to several traders, then, as real practice has shown, they will all show different results. This is due to individual characteristics.
And in VSA the interpretation becomes even more complicated. Everyone sees something different. Hence the results are completely different for everyone.
- VSA analysis - simple about complex things;