Exchange rate for today: 20.0662 rub. +0.0753
- Recalculate:
- in rubles
- in hryvnia
- in tenge
- In Euro
- in dollars
According to the Central Bank of the Russian Federation as of May 26, 2021. Recalculation is carried out at the cross rate
Notifications: no
Install
Official zloty exchange rate for tomorrow
The exchange rate as of May 27 is 20.0485 rubles.
-0.0177 Data “for tomorrow” are published after 11:30 on weekdays. What does the exchange rate mean for tomorrow?
Show statistics
:
- for the last
- year
- month
- a week
- for 2021
- in 3 years
- during all this time
How the PLN RUB (zloty to ruble) exchange rate is set on the stock exchange
PLN RUB is the cross rate of national currencies among themselves, which is set automatically on the exchange based on the exchange rate of both currencies to the US dollar. How did the rate turn out to be 16.20 on 01/30/2020?
- exchange rate USD PLN = 3.89
- exchange rate USD RUB = 63.03
- cross rate PLN RUB = the cost of one Polish zloty is 16.2 rubles (63.03 / 3.89)
If the National Bank of Poland and the Bank of Russia (as the only issuers of the zloty and ruble issues, respectively) change the quotes of their currencies to the US dollar , then the USD PLN rate will automatically change on all exchanges in the world that have this financial instrument listed.
Long-term Polish zloty exchange rate forecast for 2021, 2021, 2022, 2023, 2024 and 2025.
| Month | Open | Min-Max | Closing rate (forecast) | Months,% | Total,% |
| 2021 | |||||
| May | 20.07 | 20.03 — 20.11 | ▼ 20.03 -0.18% | -0.18% | 0.40% |
| June | 20.03 | 19.69 — 20.37 | ▼ 19.69 -1.91% | -1.91% | 3.34% |
| July | 19.69 | 19.14 — 20.24 | ▲ 20.24 0.86% | 0.86% | 5.43% |
| August | 20.24 | 20.21 — 20.27 | ▲ 20.27 1.01% | 1.01% | 0.30% |
| September | 20.27 | 19.88 — 20.66 | ▼ 19.88 -0.94% | -0.94% | 3.78% |
| October | 19.88 | 19.85 — 19.91 | ▼ 19.91 -0.78% | -0.78% | 0.30% |
| november | 19.91 | 19.80 — 20.02 | ▼ 19.80 -1.34% | -1.34% | 1.10% |
| December | 19.80 | 19.51 — 20.09 | ▲ 20.09 0.12% | 0.12% | 2.89% |
| 2022 | |||||
| January | 20.09 | 19.83 — 20.35 | ▲ 20.35 1.39% | 1.39% | 2.56% |
| February | 20.35 | 20.34 — 20.36 | ▲ 20.36 1.44% | 1.44% | 0.10% |
| March | 20.36 | 19.97 — 20.75 | ▼ 19.97 -0.48% | -0.48% | 3.76% |
| April | 19.97 | 19.94 — 20.00 | ▼ 19.94 -0.63% | -0.63% | 0.30% |
| May | 19.94 | 19.84 — 20.04 | ▼ 20.04 -0.13% | -0.13% | 1.00% |
| June | 20.04 | 19.87 — 20.21 | ▲ 20.21 0.71% | 0.71% | 1.68% |
| July | 20.21 | 19.75 — 20.67 | ▼ 19.75 -1.60% | -1.60% | 4.45% |
| August | 19.75 | 19.20 — 20.30 | ▲ 20.30 1.15% | 1.15% | 5.42% |
| September | 20.30 | 19.67 — 20.93 | ▼ 19.67 -2.01% | -2.01% | 6.02% |
| October | 19.67 | 19.41 — 19.93 | ▼ 19.93 -0.68% | -0.68% | 2.61% |
| november | 19.93 | 19.90 — 19.96 | ▼ 19.90 -0.84% | -0.84% | 0.30% |
| December | 19.90 | 19.69 — 20.11 | ▼ 19.69 -1.91% | -1.91% | 2.09% |
| 2023 | |||||
| January | 19.69 | 18.99 — 20.39 | ▲ 20.39 1.59% | 1.59% | 6.87% |
| February | 20.39 | 19.90 — 20.88 | ▼ 19.90 -0.84% | -0.84% | 4.69% |
| March | 19.90 | 19.89 — 19.91 | ▼ 19.89 -0.89% | -0.89% | 0.10% |
| April | 19.89 | 19.38 — 20.40 | ▲ 20.40 1.64% | 1.64% | 5.00% |
| May | 20.40 | 20.22 — 20.58 | ▲ 20.22 0.76% | 0.76% | 1.75% |
| June | 20.22 | 19.98 — 20.46 | ▼ 19.98 -0.43% | -0.43% | 2.35% |
| July | 19.98 | 19.89 — 20.07 | ▲ 20.07 0.02% | 0.02% | 0.90% |
| August | 20.07 | 19.77 — 20.37 | ▲ 20.37 1.49% | 1.49% | 2.95% |
| September | 20.37 | 19.84 — 20.90 | ▼ 19.84 -1.14% | -1.14% | 5.07% |
| October | 19.84 | 19.57 — 20.11 | ▲ 20.11 0.22% | 0.22% | 2.69% |
| november | 20.11 | 19.88 — 20.34 | ▲ 20.34 1.35% | 1.35% | 2.26% |
| December | 20.34 | 20.08 — 20.60 | ▲ 20.08 0.07% | 0.07% | 2.52% |
| 2024 | |||||
| January | 20.08 | 19.67 — 20.49 | ▼ 19.67 -2.01% | -2.01% | 4.00% |
| February | 19.67 | 19.58 — 19.76 | ▼ 19.76 -1.55% | -1.55% | 0.91% |
| March | 19.76 | 19.35 — 20.17 | ▲ 20.17 0.51% | 0.51% | 4.07% |
| April | 20.17 | 19.77 — 20.57 | ▼ 19.77 -1.50% | -1.50% | 3.89% |
| May | 19.77 | 19.60 — 19.94 | ▼ 19.94 -0.63% | -0.63% | 1.71% |
| June | 19.94 | 19.77 — 20.11 | ▼ 19.77 -1.50% | -1.50% | 1.69% |
| July | 19.77 | 19.16 — 20.38 | ▲ 20.38 1.54% | 1.54% | 5.99% |
| August | 20.38 | 20.35 — 20.41 | ▲ 20.41 1.68% | 1.68% | 0.29% |
| September | 20.41 | 19.94 — 20.88 | ▼ 19.94 -0.63% | -0.63% | 4.50% |
| October | 19.94 | 19.67 — 20.21 | ▲ 20.21 0.71% | 0.71% | 2.67% |
| november | 20.21 | 20.17 — 20.25 | ▲ 20.17 0.51% | 0.51% | 0.40% |
| December | 20.17 | 20.00 — 20.34 | ▼ 20.00 -0.33% | -0.33% | 1.67% |
| 2025 | |||||
| January | 20.00 | 19.61 — 20.39 | ▲ 20.39 1.59% | 1.59% | 3.83% |
| February | 20.39 | 20.20 — 20.58 | ▲ 20.20 0.66% | 0.66% | 1.85% |
| March | 20.20 | 20.09 — 20.31 | ▲ 20.09 0.12% | 0.12% | 1.08% |
| April | 20.09 | 19.86 — 20.32 | ▲ 20.32 1.25% | 1.25% | 2.26% |
| May | 20.32 | 20.06 — 20.58 | ▼ 20.06 -0.03% | -0.03% | 2.53% |
| June | 20.06 | 19.76 — 20.36 | ▲ 20.36 1.44% | 1.44% | 2.95% |
| July | 20.36 | 20.01 — 20.71 | ▼ 20.01 -0.28% | -0.28% | 3.38% |
| August | 20.01 | 19.66 — 20.36 | ▼ 19.66 -2.07% | -2.07% | 3.44% |
| September | 19.66 | 18.98 — 20.34 | ▲ 20.34 1.35% | 1.35% | 6.69% |
| October | 20.34 | 19.85 — 20.83 | ▼ 19.85 -1.09% | -1.09% | 4.70% |
| november | 19.85 | 19.69 — 20.01 | ▼ 19.69 -1.91% | -1.91% | 1.60% |
| December | 19.69 | 19.39 — 19.99 | ▼ 19.99 -0.38% | -0.38% | 3.00% |
| 2026 | |||||
| January | 19.99 | 19.57 — 20.41 | ▲ 20.41 1.68% | 1.68% | 4.12% |
| February | 20.41 | 20.02 — 20.80 | ▼ 20.02 -0.23% | -0.23% | 3.75% |
| March | 20.02 | 19.84 — 20.20 | ▼ 19.84 -1.14% | -1.14% | 1.78% |
| April | 19.84 | 19.40 — 20.28 | ▲ 20.28 1.05% | 1.05% | 4.34% |
| May | 20.28 | 20.28 — 20.28 | ▲ 20.28 1.05% | 1.05% | 0.00% |
| June | 20.28 | 19.87 — 20.69 | ▼ 19.87 -0.99% | -0.99% | 3.96% |
| July | 19.87 | 19.66 — 20.08 | ▲ 20.08 0.07% | 0.07% | 2.09% |
| August | 20.08 | 19.73 — 20.43 | ▼ 19.73 -1.70% | -1.70% | 3.43% |
| September | 19.73 | 19.58 — 19.88 | ▼ 19.88 -0.94% | -0.94% | 1.51% |
| October | 19.88 | 19.81 — 19.95 | ▼ 19.95 -0.58% | -0.58% | 0.70% |
| november | 19.95 | 19.56 — 20.34 | ▲ 20.34 1.35% | 1.35% | 3.83% |
| December | 20.34 | 20.10 — 20.58 | ▲ 20.10 0.17% | 0.17% | 2.33% |
Reverse exchange rate quote RUB PLN ruble to Polish zloty
RUB PLN is the value of one ruble in Polish zloty . It is also installed automatically and allows you to convert zlotys to rubles online. How did the rate turn out to be RUB PLN = 0.0617 as of 01/30/2020?
- exchange rate USD PLN = 3.89
- exchange rate USD RUB = 63.03
- cross rate RUB PLN = 0.0617 (3.89 / 63.03). Those. vice versa than in the example above.
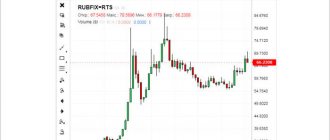
RUBPLN chart courtesy of TradingView
Interesting information about the Polish zloty to ruble exchange rate (PLN RUB)
The most popular (and naive) search queries of Yandex and Google users are:
- “the zloty rate in Sberbank”, “at Energotransbank”, “at Privatbank” (answer: their zloty rate is exactly the same as in the graph above, plus the bank’s “margin”);
- “zloty to ruble exchange rate in Bialystok”, Kaliningrad, Minsk, Brest (answer: the exchange rate is almost identical in all cities of the world, since the Polish zloty is a freely convertible currency);
- how much will “3000 zlotys in rubles” cost (answer: 3 thousand zlotys X 16.2 rubles (as of 01/20/2020) = 48,600 rubles);
- how to find out the “zloty to ruble exchange rate for tomorrow” (answer: forex traders - see below).
Zloty exchange rate in the past
The authorities of socialist Poland officially allowed citizens of socialist Poland to store and exchange currency in 1956. Exchange through government agencies was considered legal. However, the exchange rate of the zloty to the dollar, set by the National Bank until 1989, did not correspond to the real value of the Polish monetary unit - it was greatly overestimated.
The official exchange rate was used in international payments; within Poland itself there was a “black market” for exchange. The republic's authorities were loyal to illegal exchange transactions. Thanks to the “black market,” ordinary Poles could purchase dollars to use in state-owned currency stores “Pewex” and “Baltona”, from where the foreign currency supply was directed to the needs of the country. Depending on the political and economic situation, the exchange rate of the zloty on the “black market” was constantly changing. The minimum values occurred during the initial period of economic reforms in the 1970s. But later, after the oil crisis of 1973, they subsequently provoked the devaluation of the zloty. If we compare by year, the shadow exchange rate of the Polish zloty was:
- 220 to the dollar in 1957
- 91 to the dollar in 1974
- 138 to the dollar in 1978
At the beginning of the Martial Law period, December 1980, the dollar jumped up and briefly traded around 1000 zlotys, but then fell to around 400 zlotys. After the lifting of Martial Law in 1983, changes gradually began in the economic structure of the Polish economy. But the heavy load of foreign borrowing made during the heyday of socialist Poland effectively devalued the national currency as the printing press was turned on to reduce the budget deficit. The regulated exchange rate of the Polish zloty began to decline significantly, reaching a value of 570 zlotys per dollar by the time private currency exchanges were legalized in March 1989.
Online exchange rates.
Denomination and “new” zlotys
High inflation prompted the Polish government to resort to “shock therapy” economic reforms in 1990. In the early 90s, the dollar exchange rate was continuously growing:
- 9500 zlotys in 1990
- PLN 10957 - December 1991
- 15767 zlotys end of 1992
- 21344 zlotys at the end of 1993
- 24372 zlotys end of 1994
By 1995, the country's economy had stabilized and denomination was carried out. At the rate of 1 to 10,000, the old zloty was exchanged for the new one (international currency code PLN), which is the payment unit of Poland to this day. The exchange rate immediately after the denomination was 2.43 PLN per 1 dollar.
Transition to a floating exchange rate for the zloty
From 1995 to 2000, there was government regulation of the exchange rate. Fluctuations should not exceed 7% of the set value. However, this fact could not stop the dollar from rising. At the beginning of 2000, the dollar was already worth more than 4 zlotys. Since April 2000, the state has stopped interfering in the exchange rate formation of the zloty. Since then, the zloty exchange rate has gradually strengthened and by mid-2008 reached a level of almost 2 zlotys per 1 US dollar. But the global financial crisis of 2008-2009 changed the growth trend of the zloty to a gradual depreciation of the Polish currency. As a result, by 2021 the exchange rate returned to 4 zlotys per dollar. It should be noted that the zloty has proven itself to be a fairly stable currency over the past two decades and most Poles do not want to switch to the pan-European currency euro.
How to make a long-term forecast for the PLN RUB exchange rate?
Making a long-term forecast is one of the most difficult tasks of professional forex trading and stock exchanges . There are 4 generally accepted market analysis methods in the world:
- fundamental analysis;
- technical analysis;
- Elliott wave analysis;
- analysis of the volumes of current supply and demand for currency futures (in this case, the ruble and zloty) on the GPW (Warsaw Stock Exchange) and MOEX (Moscow Exchange MICEX-RTS).
Let us consider in detail the application of each of them to the exchange rate of the Polish zloty to the Russian ruble.
Fundamental analysis of the zloty to ruble exchange rate (PLN RUB)
Fundamental analysis of PLN RUB is carried out by specialists through a comparison of macroeconomic indicators of states as a starting point for the formation of their exchange rates. The stronger and more stable the economic position of a country, with equal political risks, the stronger the exchange rate of its national currency in relation to competitors to form long-term growth (bull market) of its national currency.
The comparison involves such objective indicators for both countries as GDP growth rates , inflation rates (respectively, the key rate of the Central Bank), unemployment rates, changes in external debt, changes in the volume of gold and foreign exchange reserves, budget deficit, etc.
In the Masterforex-V trading system this comparison is presented in the form of a table:
| Comparative fundamental analysis of Masterforex-V of 2 countries (Masterforex-V training material on fundamental analysis of trading) | ||
| Macroeconomic data | State A | State B |
| GDP growth rate | +3.5% | +1.1% |
| Inflation | +3.4% | +6.5% |
| External debt | +0.1% | +2.5% |
| Budget deficit | 1.5% | 4% |
| Unemployment rate | 3% | 6% |
| Gold reserves | +1% | -2% |
| Central Bank key rate | 3.5% | 6% |
| Devaluation to USD | 1% | 9% |
| Standard Poor's credit rating | A+ | BB- |
| Moody's credit rating | Aa2 | IN |
| Fitch credit rating | A | IN |
| Political risks | — | + |
| International sanctions | — | — |
It is not difficult to guess that the currency of state A is stronger than its competitor from state B , for which a bullish trend should form. Any discrepancy (flat or bearish trend) can be at most short-term or medium-term and be temporary for traders and investors.
For more information on Polish zloty fundamentals, see articles
- Polish zloty is the currency of Poland through the eyes of Masterforex-V traders;
- National Bank of Poland through monitoring of Masterforex-V traders
Information about Polish zloty (PLN)
The Polish zloty is the national currency of Poland. The name of the currency comes from the name of the “golden ducat” - a state means of payment that was in circulation in the 16th century. It was preceded by the hryvnia and kopa, borrowed from the Czech Republic. The Ostrubl and then the Ostmark were in circulation during the German occupation of the country. At the end of the last century, the modern zloty experienced hyperinflation and underwent redenomination. It is now stable and pegged to the single European currency. 1 zloty is equivalent to 100 grosz. The name of the unit of exchange “penny” comes from the Latin term grossus, translated meaning “thick”. The National Bank of Poland issued banknotes in denominations of 10, 20, 50, 100, 200 zlotys. In addition to them, coins were minted: 1, 2, 5, 10, 20, 50 groschen, as well as 1, 2, 5 zloty. The letter currency symbol is PLN. Its digital code, according to the ISO 4217 classification, is 985. Currently, the popularity of the Polish currency is increasing mainly among Polish traders. This is facilitated by the country's successful economy and relatively low inflation rate. Among other exchange rates, the zloty is considered an exotic currency. However, for most participants in the Forex PLN market it is not of particular interest, since it is not characterized by high profitability.
Macroeconomic data of fundamental analysis of the Polish zloty exchange rate
Main article - main characteristics of the Polish zloty with detailed statistics
- ISO 4217 code, zloty forex ticker (PLN), zloty banknotes and coins, financial regulator, etc.;
- trends on large timeframes w1 and MN for devaluation / revaluation of the Polish zloty against the US dollar (USD PLN), zloty against the euro (EUR PLN), zloty against the Japanese yen (PLN JPN), zloty against the Swiss franc (PLN CHF), zloty against the Australian currency dollar (AUD PLN), zloty to pound sterling (GBP PLN), Chinese yuan to Polish zloty (CNY PLN), Czech crown to zloty (CZK PLN), zloty to Belarusian ruble (PLN BYN), Turkish lira (PLN TRY), Israeli new shekel (PLN ILS), Romanian leu (PLN RON), Canadian dollar (PLN CAD), Hungarian forint (PLN HUF), Swedish krona (PLN SEK), South Korean won (PLN KRW), Moldovan leu (PLN MDL), Azerbaijani manat (PLN AZN), UAE dirham (PLN AED), Mexican peso (PLN MXN), Vietnamese dong (PLN VND), New Zealand dollar (PLN NZD), Thai baht (PLN THB), Georgian lari (PLN GEL), Ukrainian hryvnia (PLN UAN), Kazakhstani tenge (PLN KZT), Uzbek sum (PLN UZS), Indian rupee (PLN INR), Hong Kong dollar (PLN HKD), Singapore dollar (PLN SGD), Norwegian krone (PLN NOK), Danish krone (PLN DKK), etc.
- country's stock market (national stock exchange, stock indices WIG 20, WIG, shares - blue chips, ordinary shares (410 Polish and 50 foreign companies), preferred shares (prefs), bonds, stock indices (4), bills, currency pairs (4 ), derivatives, warrants, options, 4 ETFs, etc.);
- famous traders and investors of the country, forex brokers, the largest banks in Poland, payment systems,
- local commodity exchange and its export futures (wheat, corn, barley, sunflowers, pork carcasses, sugar, potatoes, milk, butter, cheese, iron ore, coal, steel), and import futures (oil, natural gas, aluminum, copper, rubber, lithium, molybdenum, palm oil)
- legally permitted (taxes 19%) in the country of cryptocurrencies (BTC, ETH, BCH, XRP, LTC, ETC, BNB, NEO, DASH, ZEC, NEM, DSH, TRX, etc.)
The main article on the policy of the country's Central Bank - the National Bank of Poland, through monitoring of Masterforex-V traders, gives a detailed description of the Polish economy and the policy of the National Bank of Poland to stabilize the exchange rate of the Polish zloty.
- Gold and foreign currency reserves ($116.9 billion);
- GDP ($593.295 billion, 21st place in the world) with a falling GDP growth rate of 3.7% (2019) versus 5% (2018) and 4.8% (2017);
- growing inflation 1.96% (2019) compared to 1.6% (2018);
- budget deficit 2.2% (GDP, 2019);
- unemployment rate 3.2% (October 2019);
- Central Bank key rate 2.5% from November 2021
- the basic deposit rate of the Central Bank is only 1%;
- interest on loans from commercial banks: mortgage: 3.5% -5.5% per annum, business development loan - 3.16% -6%, cash loan 8% -10% per annum
- Poland's Standard Poor's credit rating is A-, the same as Spain, Malta, Saudi Arabia, Malaysia, etc.
PLN rate:
| 1 PLN = | 0.00000000 AED |
| 1 PLN = | 0.00000000 AFN |
| 1 PLN = | 0.00000000 ALL |
| 1 PLN = | 0.00000000 AMD |
| 1 PLN = | 0.00000000 AOA |
| 1 PLN = | 0.00000000 AUD |
| 1 PLN = | 0.00000000 AZN |
| 1 PLN = | 0.00000000 BAM |
| 1 PLN = | 0.00000000 BBD |
| 1 PLN = | 0.00000000 BDT |
| 1 PLN = | 0.00000000 BGN |
| 1 PLN = | 0.00000000 BHD |
| 1 PLN = | 0.00000000 BOB |
| 1 PLN = | 0.00000000 BRL |
| 1 PLN = | 0.00000000 BSD |
| 1 PLN = | 0.00000000 BTC |
| 1 PLN = | 0.00000000 BTN |
| 1 PLN = | 0.00000000 BTS |
| 1 PLN = | 0.00000000 BYN |
| 1 PLN = | 0.00000000 CAD |
| 1 PLN = | 0.00000000 CHF |
| 1 PLN = | 0.00000000 CNY |
| 1 PLN = | 0.00000000 COP |
| 1 PLN = | 0.00000000 CRC |
| 1 PLN = | 0.00000000 CZK |
| 1 PLN = | 0.00000000 DASH |
| 1 PLN = | 0.00000000 DKK |
| 1 PLN = | 0.00000000 DOGE |
| 1 PLN = | 0.00000000 DOP |
| 1 PLN = | 0.00000000 DZD |
| 1 PLN = | 0.00000000 EAC |
| 1 PLN = | 0.00000000 EGP |
| 1 PLN = | 0.00000000 EMC |
| 1 PLN = | 0.00000000 ETB |
| 1 PLN = | 0.00000000 ETH |
| 1 PLN = | 0.00000000 EUR |
| 1 PLN = | 0.00000000 FCT |
| 1 PLN = | 0.00000000 FTC |
| 1 PLN = | 0.00000000 GBP |
| 1 PLN = | 0.00000000 GEL |
| 1 PLN = | 0.00000000 GGP |
| 1 PLN = | 0.00000000 GIP |
| 1 PLN = | 0.00000000 GTQ |
| 1 PLN = | 0.00000000 HKD |
| 1 PLN = | 0.00000000 HNL |
| 1 PLN = | 0.00000000 HRK |
| 1 PLN = | 0.00000000 HUF |
| 1 PLN = | 0.00000000 IDR |
| 1 PLN = | 0.00000000 ILS |
| 1 PLN = | 0.00000000 INR |
| 1 PLN = | 0.00000000 IQD |
| 1 PLN = | 0.00000000 IRR |
| 1 PLN = | 0.00000000 ISK |
| 1 PLN = | 0.00000000 JMD |
| 1 PLN = | 0.00000000 JOD |
| 1 PLN = | 0.00000000 JPY |
| 1 PLN = | 0.00000000 KES |
| 1 PLN = | 0.00000000 KGS |
| 1 PLN = | 0.00000000 KHR |
| 1 PLN = | 0.00000000 KRW |
| 1 PLN = | 0.00000000 KZT |
| 1 PLN = | 0.00000000 LBP |
| 1 PLN = | 0.00000000 LKR |
| 1 PLN = | 0.00000000 LTC |
| 1 PLN = | 0.00000000 MAD |
| 1 PLN = | 0.00000000 MDL |
| 1 PLN = | 0.00000000 MGA |
| 1 PLN = | 0.00000000 MMK |
| 1 PLN = | 0.00000000 MVR |
| 1 PLN = | 0.00000000 MWK |
| 1 PLN = | 0.00000000 MXN |
| 1 PLN = | 0.00000000 MYR |
| 1 PLN = | 0.00000000 MZN |
| 1 PLN = | 0.00000000 NAD |
| 1 PLN = | 0.00000000 NGN |
| 1 PLN = | 0.00000000 NMC |
| 1 PLN = | 0.00000000 NOK |
| 1 PLN = | 0.00000000 NPR |
| 1 PLN = | 0.00000000 NVC |
| 1 PLN = | 0.00000000 NXT |
| 1 PLN = | 0.00000000 NZD |
| 1 PLN = | 0.00000000 OMR |
| 1 PLN = | 0.00000000 PAB |
| 1 PLN = | 0.00000000 PEN |
| 1 PLN = | 0.00000000 PGK |
| 1 PLN = | 0.00000000 PHP |
| 1 PLN = | 0.00000000 PKR |
| 1 PLN = | 0.00000000 PLN |
| 1 PLN = | 0.00000000 PPC |
| 1 PLN = | 0.00000000 PYG |
| 1 PLN = | 0.00000000 QAR |
| 1 PLN = | 0.00000000 RON |
| 1 PLN = | 0.00000000 RSD |
| 1 PLN = | 0.00000000 RUB |
| 1 PLN = | 0.00000000 SAR |
| 1 PLN = | 0.00000000 SEK |
| 1 PLN = | 0.00000000 SGD |
| 1 PLN = | 0.00000000 STR |
| 1 PLN = | 0.00000000 SVC |
| 1 PLN = | 0.00000000 SZL |
| 1 PLN = | 0.00000000 THB |
| 1 PLN = | 0.00000000 TND |
| 1 PLN = | 0.00000000 TOP |
| 1 PLN = | 0.00000000 TRY |
| 1 PLN = | 0.00000000 TTD |
| 1 PLN = | 0.00000000 TWD |
| 1 PLN = | 0.00000000 TZS |
| 1 PLN = | 0.00000000 UAH |
| 1 PLN = | 0.00000000 UGX |
| 1 PLN = | 0.00000000 USD |
| 1 PLN = | 0.00000000 UYU |
| 1 PLN = | 0.00000000 UZS |
| 1 PLN = | 0.00000000 VEF |
| 1 PLN = | 0.00000000 VND |
| 1 PLN = | 0.00000000 VTC |
| 1 PLN = | 0.00000000 VUV |
| 1 PLN = | 0.00000000 WST |
| 1 PLN = | 0.00000000 XAF |
| 1 PLN = | 0.00000000 XMR |
| 1 PLN = | 0.00000000 XOF |
| 1 PLN = | 0.00000000 XPM |
| 1 PLN = | 0.00000000 XRP |
| 1 PLN = | 0.00000000 ZAR |
| 1 PLN = | 0.00000000 ZMW |
Technical analysis of the PLN RUB exchange rate (zloty to ruble)
Technical analysis is the determination of the current trend in the market through trend reversal and continuation patterns formed at important resistance (or support) levels. See the Masterforex-V graphic pattern of the beginning of the trend for its reversal and continuation patterns.
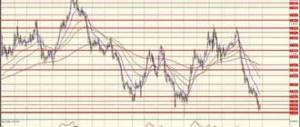
Trends in the PLN RUB exchange rate (Polish zloty to ruble) are clearly visible in the following chart of PLN RUB since 2007.
- Long-term trend of PLN RUB since 2007. - up - cm.
- The “fan of moving averages MF” is correctly turned upward and there is not a single signal (crossing the averages in the opposite direction) for the falling movement of the current price and the global devaluation of the zloty against the ruble;
- Medium-term trend since 2015 — flat (sideways movement) between important levels of accumulation of orders at 14 and 19 rubles per zloty, which began after the capture of protective orders at 23.5 zlotys per ruble. In a flat, an upward trend continuation model is forming more and more openly - a symmetrical triangle with divergence on the MACD indicator.
The cancellation of these calculations is a kind of force majeure with the price of PLN RUB breaking through and fixing at 14 rubles per zloty and moving to the next protective orders at around 11 rubles per zloty. There is not a single basis for this (backup) option today.
Read more:
- trend reversal patterns - “head and shoulders”, triple and double top or bottom (shown in the example below), “diamond”, “spike”, “cup with handle”, etc.
- trend continuation patterns - flag or pennant, wedge, rectangles, triangles - symmetrical triangle, ascending and descending triangles, expanding triangle, gap (Gaps), etc.
Other ruble rates on the forex market
PLN RUB (zloty to ruble) is just one of the currency pairs involving the Russian ruble . For other online charts of quotes for its currency pairs, see the following links - USD RUB (US dollar to ruble exchange rate), EUR RUB (euro to ruble), GBP RUB (pound sterling to ruble), AUD RUB (Australian dollar to ruble), CAD RUB (Canadian dollar to ruble), BYN RUB (Belarusian ruble to Russian ruble), RUB CZK (ruble to Czech crown), UAH RUB (Ukrainian hryvnia to ruble), RUB VND (ruble to Vietnamese dong), GEL RUB (Georgian lari to ruble), TRY RUB (Turkish lira to ruble), RUB ILS (ruble to shekel), RUB AZN (ruble to Azerbaijani manat), HUF RUB (Hungarian forint to ruble), RUB MDL (ruble to Moldovan leu), RON RUB (Romanian leu to ruble), CHF RUB (Swiss franc to ruble), SEK RUB (Swedish krona to ruble), AED RUB (UAE dirham to ruble), THB RUB (Thai baht to ruble), , NZD RUB (New Zealand dollar to ruble), CNY RUB (Chinese yuan to ruble), INR RUB (Indian rupee to ruble exchange rate), HKD RUB (Hong Kong dollar to ruble), SGD RUB (Singapore dollar to ruble), MXN RUB (Mexican peso to ruble exchange rate) and etc.
Recommended brokers for forex trading
To trade the Polish zloty and other currency pairs to make a profit on trends, a trader must first open a trading account (deposit) with one of the forex brokers . Masterforex-V Academy has been maintaining its independent rating of Forex brokers for more than 12 years, based on more than 30 objective criteria for assessing brokers (spread and swaps, presence or absence of licenses from financial regulators, offering CFDs, NDD, STP, ECN, PAMM and LAMM accounts, opportunities opening a large number of lots and hedging them (including through a lock/lock instead of Stop Loss), the availability of financial instruments from stock, futures, cryptocurrency, currency and commodity exchanges, etc.), as well as on the reviews of the traders themselves.
As a result, out of 400 companies, we identified only 12 “best Forex brokers” of the major league and another 20 reserve companies from the 2nd league (popular companies, but with numerous complaints from clients). Here is a list of them.
| Broker name | Year of foundation | Financial instruments | Licenses from financial regulators | |
| Major League | ||||
| 1. | NordFX | 2008 | currency pairs, commodity futures, stock indices, cryptocurrencies, stocks | CySEC, MiFID |
| 2. | Swissquote | 1996 | commodity futures, currency pairs, stock index futures, cryptocurrencies, metals, ETFs, warrants, shares | FINMA, FCA, SFC, Dubai FSA |
| 3. | Dukascopy | 1998 | stock indices, commodity futures, currency pairs, stocks, bonds, ETFs | FINMA, FCMC |
| 4. | Alpari | 1998 | metals, energy, indices, currency pairs, cryptocurrencies | ARFIN |
| 5. | FxPro | 2006 | indices, commodity futures, stocks, currency pairs | FCA, CySEC, FSB, Dubai FSA, BaFin, ACPR, CNMV |
| 6. | Interactive Brokers | 1977 | stocks, bonds, derivatives, currency pairs, forward contracts, bills, warrants, options, stock indices, currency and commodity futures | NFA, CFTC, FCA, IIROC |
| 7. | Oanda | 1996 | bonds, stock indices, currency pairs, commodity futures | NFA, CFTC, FCA, IIROC, MAS, ASIC |
| 8. | FXCM | 1999 | currency pairs, stock indices, commodity futures, cryptocurrencies | FCA, BaFin, ACPR, AMF, Dubai FSA,SFC, ISA, ASIC, FSB |
| 9. | Saxo Bank | 1992 | currency and commodity futures, stock indices, currency pairs, ETFs, stocks, bonds, derivatives | Danish FSA, Consob, Czech National Bank, Bank of the Netherlands, ASIC, Monetary Authority of Singapore, FINMA, Bank of France, Central Bank of the UAE, Japanese Financial Services Agency, Securities and Futures Commission in Hong Kong. |
| 10. | FOREX.com | 1999 | currency pairs, stocks, stock indices, commodity futures, cryptocurrencies | NFA, CFTC, FCA, ASIC, JSDA, MAS, SFC |
| 11. | FIBO Group | 1998 | metals, energy, currency pairs, commodities, cryptocurrencies, indices | CySEC |
| 12. | FINAM FOREX | 1994 | currency pairs | Bank of Russia |
| Second League | ||||
| 13. | Forex Club | 1997 | currency pairs, indices, commodities, stocks, ETFs | ARFIN |
| 14. | TeleTrade | 1994 | commodities, currency pairs, indices, stocks | ARFIN |
| 15. | ActivTrades | 2001 | indices, commodities, currency pairs, stocks, bonds, ETFs, cryptocurrencies, options | FCA, SCB |
| 16 | FreshForex (Fresh Forex) | 2004 | indices, commodities, stocks, currency pairs | — |
| 17. | eToro (eToro) | 2007 | currency pairs, indices, commodities, stocks, ETFs, cryptocurrencies | ASIC, FCA, CySEC |
| 18. | FortFS | 2010 | currency futures, currency pairs, indices, commodities, bonds, stocks, cryptocurrencies, ETFs | IFSC Belize |
| 19. | 2011 | currency pairs, indices, commodities, stocks | ASIC, IFSC, CySEC | |
| 20. | BCS Forex (BCS Forex) | 2004 | currency pairs, stocks, indices, commodities | — |
| 21. | GKFX | 2009 | currency pairs, indices, commodities | FCA, JFSA, DMCC, BaFin, AMF, AFM, Consob, CNMV, , CNB, Národná Banka Slovenska |
| 22. | NPBFX (Nefteprombank) | 2016 | commodities, currency pairs, cryptocurrencies | — |
| 23. | Admiral Markets | 2001 | cryptocurrencies, currency pairs, commodities, stocks, ETFs, indices, bonds | ASIC, FCA, EFSA, CySEC |
| 24. | Grand Capital (Grand Capital) | 2006 | stocks, indices, commodities, cryptocurrencies | — |
| 25. | RoboForex (Roboforex) | 2009 | indices, commodities, currency pairs, stocks, cryptocurrencies | CySEC, IFSC Belize |
| 26. | FinmaxFX | 2018 | currency pairs, indices, commodities, bonds, stocks, options | CROFR, VFSC Vanuatu |
| 27. | FXOpen | 2005 | indices, commodities, cryptocurrencies, currency pairs, | FCA |
| 27. | Forex Optimum Group Limited | 2009 | indices, commodities, currency pairs, stocks | — |
| 29. | EXNESS | 2008 | commodities, currency pairs, cryptocurrencies | FSA Seychelles |
| 30. | HYCM | 1989 | indices, commodities, currency pairs, stocks, cryptocurrencies | FCA, CySEC, CIMA, Dubai FSA |
| 31. | Alfa Forex (Alfa Bank) | 2003 | currency pairs | Bank of Russia |
| 32. | Forex4you (Forex fo you) | 2007 | stocks, indices, currency pairs, commodities, cryptocurrencies | FSC BVI |
Sincerely, wiki Masterforex-V, free (school) and professional training courses Masterforex-V.
Exchange rate table
- by month
- by days
- on years
| Month | Average price, rub. |
| May 2021 | 19.8251 |
| April 2021 | 19.8877 |
| March 2021 | 19.2254 |
| February 2021 | 19.9546 |
| January 2021 | 19.8815 |
| December 2020 | 20.1372 |
| November 2020 | 20.1913 |
| October 2020 | 20.0841 |
| September 2020 | 20.0176 |
| August 2020 | 19.7653 |
| July 2020 | 18.1273 |
| June 2020 | 17.5267 |
| May 2020 | 17.4174 |
| date | price, rub. |
| 26.05.2021 | 20.0662 |
| 25.05.2021 | 19.9909 |
| 22.05.2021 | 19.9832 |
| 21.05.2021 | 19.8899 |
| 20.05.2021 | 19.8609 |
| 19.05.2021 | 19.8752 |
| 18.05.2021 | 19.8005 |
| 15.05.2021 | 19.807 |
| 14.05.2021 | 19.7599 |
| 13.05.2021 | 19.7815 |
| 12.05.2021 | 19.7236 |
| 08.05.2021 | 19.5752 |
| 07.05.2021 | 19.6116 |
| 06.05.2021 | 19.622 |
| 05.05.2021 | 19.8987 |
| 01.05.2021 | 19.8433 |
| 30.04.2021 | 19.6534 |
| 29.04.2021 | 19.7572 |
| 28.04.2021 | 19.8411 |
| 27.04.2021 | 19.836 |
| 24.04.2021 | 19.8324 |
| 23.04.2021 | 20.204 |
| 22.04.2021 | 20.2669 |
| 21.04.2021 | 20.1515 |
| 20.04.2021 | 20.1664 |
| 17.04.2021 | 19.8982 |
| 16.04.2021 | 20.2602 |
| 15.04.2021 | 19.8772 |
| 14.04.2021 | 20.1527 |
| 13.04.2021 | 20.3199 |
| 10.04.2021 | 20.2131 |
| 09.04.2021 | 20.1193 |
| 08.04.2021 | 20.1177 |
| 07.04.2021 | 19.6028 |
| 06.04.2021 | 19.5571 |
| 03.04.2021 | 19.5366 |
| 02.04.2021 | 19.2742 |
| 01.04.2021 | 19.0484 |
| 31.03.2021 | 19.1177 |
| 30.03.2021 | 19.2035 |
| 27.03.2021 | 19.2812 |
| 26.03.2021 | 19.4292 |
| 25.03.2021 | 19.4607 |
| 24.03.2021 | 19.4584 |
| 23.03.2021 | 19.1939 |
| 20.03.2021 | 19.145 |
| 19.03.2021 | 19.1112 |
| 18.03.2021 | 18.8996 |
| 17.03.2021 | 18.9575 |
| 16.03.2021 | 19.0673 |
| 13.03.2021 | 19.1328 |
| 12.03.2021 | 19.2523 |
| 11.03.2021 | 19.21 |
| 10.03.2021 | 19.2254 |
| 06.03.2021 | 19.4003 |
| 05.03.2021 | 19.5388 |
| 04.03.2021 | 19.5898 |
| 03.03.2021 | 19.729 |
| 02.03.2021 | 19.7558 |
| 27.02.2021 | 20.0397 |
| 26.02.2021 | 19.8661 |
| 25.02.2021 | 19.8865 |
| 21.02.2021 | 19.9852 |
| 20.02.2021 | 19.9686 |
| 19.02.2021 | 19.8108 |
| 18.02.2021 | 19.8037 |
| 17.02.2021 | 19.8332 |
| 16.02.2021 | 19.8042 |
| 13.02.2021 | 19.8784 |
| 12.02.2021 | 19.8733 |
| 11.02.2021 | 20.0305 |
| 10.02.2021 | 19.9546 |
| 09.02.2021 | 19.9174 |
| 06.02.2021 | 20.0087 |
| 05.02.2021 | 20.2231 |
| 04.02.2021 | 20.445 |
| 03.02.2021 | 20.3608 |
| 02.02.2021 | 20.2351 |
| 30.01.2021 | 20.3438 |
| 29.01.2021 | 20.2432 |
| 28.01.2021 | 20.0449 |
| 27.01.2021 | 20.1485 |
| 26.01.2021 | 20.0866 |
| 23.01.2021 | 19.9238 |
| 22.01.2021 | 19.6143 |
| 21.01.2021 | 19.6794 |
| 20.01.2021 | 19.7071 |
| 19.01.2021 | 19.6404 |
| 16.01.2021 | 19.5933 |
| 15.01.2021 | 19.7432 |
| 14.01.2021 | 19.8099 |
| 13.01.2021 | 19.9608 |
| 12.01.2021 | 20.0883 |
| 01.01.2021 | 19.8393 |
| 31.12.2020 | 20.008 |
| 30.12.2020 | 20.1319 |
| 29.12.2020 | 20.0734 |
| 26.12.2020 | 19.9206 |
| 25.12.2020 | 20.275 |
| 24.12.2020 | 20.4264 |
| 23.12.2020 | 20.4084 |
| 22.12.2020 | 20.186 |
| 19.12.2020 | 20.2479 |
| 18.12.2020 | 20.1241 |
| 17.12.2020 | 20.1372 |
| 16.12.2020 | 20.0742 |
| 15.12.2020 | 19.9779 |
| 12.12.2020 | 19.9546 |
| 11.12.2020 | 20.1417 |
| 10.12.2020 | 20.0196 |
| 09.12.2020 | 19.914 |
| 08.12.2020 | 20.0563 |
| 05.12.2020 | 20.1867 |
| 04.12.2020 | 20.3567 |
| 03.12.2020 | 20.4487 |
| 02.12.2020 | 20.4016 |
| 01.12.2020 | 20.3623 |
| 28.11.2020 | 20.1819 |
| 27.11.2020 | 20.1307 |
| 26.11.2020 | 20.1207 |
| 25.11.2020 | 20.1479 |
| 24.11.2020 | 20.1265 |
| 21.11.2020 | 20.1913 |
| 20.11.2020 | 20.1737 |
| 19.11.2020 | 20.1633 |
| 18.11.2020 | 20.1968 |
| 17.11.2020 | 20.4139 |
| 14.11.2020 | 20.3063 |
| 13.11.2020 | 20.2374 |
| 12.11.2020 | 19.9689 |
| 11.11.2020 | 20.1758 |
| 10.11.2020 | 20.3823 |
| 07.11.2020 | 20.2051 |
| 06.11.2020 | 20.367 |
| 04.11.2020 | 20.33 |
| 03.11.2020 | 20.3236 |
| 31.10.2020 | 20.0532 |
| 30.10.2020 | 19.9752 |
| 29.10.2020 | 19.7852 |
| 28.10.2020 | 19.6767 |
| 27.10.2020 | 19.7638 |
| 24.10.2020 | 19.7946 |
| 23.10.2020 | 19.95 |
| 22.10.2020 | 19.9555 |
| 21.10.2020 | 19.9753 |
| 20.10.2020 | 20.1022 |
| 17.10.2020 | 20.0345 |
| 16.10.2020 | 20.0778 |
| 15.10.2020 | 20.2039 |
| 14.10.2020 | 20.3581 |
| 13.10.2020 | 20.3342 |
| 10.10.2020 | 20.3134 |
| 09.10.2020 | 20.4396 |
| 08.10.2020 | 20.5004 |
| 07.10.2020 | 20.5593 |
| 06.10.2020 | 20.4262 |
| 03.10.2020 | 20.3692 |
| 02.10.2020 | 20.0841 |
| 01.10.2020 | 20.391 |
| 30.09.2020 | 20.3023 |
| 29.09.2020 | 20.1226 |
| 26.09.2020 | 19.6741 |
| 25.09.2020 | 19.8933 |
| 24.09.2020 | 19.8396 |
| 23.09.2020 | 19.8923 |
| 22.09.2020 | 20.0575 |
| 19.09.2020 | 19.9633 |
| 18.09.2020 | 19.938 |
| 17.09.2020 | 19.9962 |
| 16.09.2020 | 20.0706 |
| 15.09.2020 | 19.9426 |
| 12.09.2020 | 19.9127 |
| 11.09.2020 | 20.0721 |
| 10.09.2020 | 20.1295 |
| 09.09.2020 | 20.2114 |
| 08.09.2020 | 20.0864 |
| 05.09.2020 | 20.039 |
| 04.09.2020 | 20.1845 |
| 03.09.2020 | 19.854 |
| 02.09.2020 | 20.0865 |
| 01.09.2020 | 19.9626 |
| 29.08.2020 | 20.1736 |
| 28.08.2020 | 20.2018 |
| 27.08.2020 | 20.2895 |
| 26.08.2020 | 20.0729 |
| 25.08.2020 | 19.9642 |
| 22.08.2020 | 19.9418 |
| 21.08.2020 | 19.8187 |
| 20.08.2020 | 19.9692 |
| 19.08.2020 | 19.8572 |
| 18.08.2020 | 19.6678 |
| 15.08.2020 | 19.6732 |
| 14.08.2020 | 19.7963 |
| 13.08.2020 | 19.5221 |
| 12.08.2020 | 19.5631 |
| 11.08.2020 | 19.6938 |
| 08.08.2020 | 19.7452 |
| 07.08.2020 | 19.6422 |
| 06.08.2020 | 19.6637 |
| 05.08.2020 | 19.6221 |
| 04.08.2020 | 19.7561 |
| 01.08.2020 | 19.7653 |
| 31.07.2020 | 19.5427 |
| 30.07.2020 | 19.2298 |
| 29.07.2020 | 19.153 |
| 28.07.2020 | 19.035 |
| 25.07.2020 | 18.828 |
| 24.07.2020 | 18.6269 |
| 23.07.2020 | 18.3555 |
| 22.07.2020 | 18.2523 |
| 21.07.2020 | 18.4359 |
| 18.07.2020 | 18.2497 |
| 17.07.2020 | 18.1097 |
| 16.07.2020 | 18.1273 |
| 15.07.2020 | 17.9606 |
| 14.07.2020 | 17.8995 |
| 11.07.2020 | 17.9801 |
| 10.07.2020 | 17.9629 |
| 09.07.2020 | 17.9866 |
| 08.07.2020 | 18.205 |
| 07.07.2020 | 18.0131 |
| 04.07.2020 | 17.7439 |
| 03.07.2020 | 17.8459 |
| 02.07.2020 | 17.8093 |
| 01.07.2020 | 17.7068 |
| 30.06.2020 | 17.6058 |
| 27.06.2020 | 17.418 |
| 26.06.2020 | 17.5251 |
| 25.06.2020 | 17.475 |
| 24.06.2020 | 17.5262 |
| 23.06.2020 | 17.4991 |
| 20.06.2020 | 17.5285 |
| 19.06.2020 | 17.5272 |
| 18.06.2020 | 17.6016 |
| 17.06.2020 | 17.8431 |
| 16.06.2020 | 17.8274 |
| 12.06.2020 | 17.5784 |
| 11.06.2020 | 17.5391 |
| 10.06.2020 | 17.4058 |
| 09.06.2020 | 17.4057 |
| 06.06.2020 | 17.5283 |
| 05.06.2020 | 17.4386 |
| 04.06.2020 | 17.4795 |
| 03.06.2020 | 17.5151 |
| 02.06.2020 | 17.5405 |
| 30.05.2020 | 17.6364 |
| 29.05.2020 | 17.6667 |
| 28.05.2020 | 17.5913 |
| 27.05.2020 | 17.3756 |
| 26.05.2020 | 17.2617 |
| The table is too large to display on the screen. | |
| Year | Average price, rub. |
| 2021 | 19.8328 |
| 2020 | 18.7535 |
| 2019 | 16.8088 |
| 2018 | 17.2929 |
| 2017 | 15.8586 |
| 2016 | 16.7765 |
| 2015 | 16.4466 |
| 2014 | 11.6844 |
| 2013 | 10.0323 |
| 2012 | 9.58365 |
| 2011 | 9.99279 |
| 2010 | 10.1765 |
| 2009 | 10.2184 |
| 2008 | 10.6407 |
| 2007 | 9.1687 |
| 2006 | 8.7837 |
| 2005 | 8.70486 |
| 2004 | 7.81171 |
| 2003 | 7.8297 |
| 2002 | 7.61692 |
| 2001 | 7.021 |
| 2000 | 6.4195 |
| 1999 | 6.1975 |
| 1998 | 1.79305 |