Despite its simplicity, this combination is informative and easy to use. However, in order for transactions concluded using G&P signals to be profitable, the trader needs to understand all the nuances of this figure.
Features of the head and shoulders figure
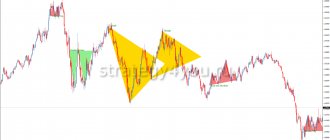
Head and shoulders is a reversal pattern. The name of the formation comes from the visual characteristic of the pattern - it appears in the form of two shoulders and a head between them. The pattern is formed by creating a top on the chart. Price then creates a second top, which is above the first top. After this, a third vertex is created, but it is lower than the second vertex and approximately at the same level as the first vertex.
The image above is a sketch of the Head and Shoulders model. The vertices in (1), (2) and (3) create three important points:
- Point (1) corresponds to the first shoulder.
- Point (2) is the “head” of the model.
- Point (3) corresponds to the second arm.
Notice that there is an initial bullish trend in the figure above. Then the left shoulder is formed, then the head and finally the right shoulder.
Let's understand the key features of the pattern so that you can determine the most favorable conditions for trading.
As you can see from the picture above, the Head and Shoulders pattern has five key properties. In order of appearance they are:
- Uptrend.
- Left shoulder.
- Head.
- Right shoulder.
- Neck line.
Please note that the neck line comes last. This may seem strange at first. However, we first need to see the shoulders and head of the pattern appear before we can identify the neck line.
Uptrend
The very first part of the Head and Shoulders pattern is an uptrend. In other words, a long-term price movement in a certain direction that eventually comes to an end. Typically, the longer a trend continues, the more likely it is to end.
Left shoulder
The price moves down and a pullback forms. At this moment we receive the first signs of the formation of a figure. At the moment, it is impossible to say whether the market will change, because pullbacks occur regularly in a trending market.
Head
Now that the left shoulder has formed, price makes a higher high which forms the head. At this point we have the left shoulder and head. The neck is also starting to take shape, but we need to wait until the right shoulder appears before we can draw the neck line.
Right shoulder
The right shoulder is where all the attributes of the pattern come together. Here we see an obvious sign that buyers are running out of strength and the price may soon reverse. Once the right shoulder has formed, we have enough data to draw the neck line. However, the figure is not yet completely completed, so it would be best to consider it as a draft for now, and not a working version.
Neck line
Once we have a head and two shoulders visible on the chart, we can draw a neck line. This level will be the key for us to enter the market for a breakout. Think of the neckline as the final boundary between buyers and sellers.
Features of the G&P figure in trading
First of all, a trader needs to learn how to find this pattern on a chart.
The classic GiP figure is characterized by several features:
- It is formed only during an uptrend.
- The presence of this pattern on the chart indicates an imminent trend reversal. In other words, the bears will soon take the initiative into their own hands.
The HyP model consists of several parts:
- Left shoulder. During an uptrend, the price makes a top and pulls back.
- Head. After the pullback, which created the left shoulder, the price goes up again and creates a new top. It should be larger than the previous one.
- Right shoulder. After the price rollback, another top appears, which is called the second shoulder.
- Neck. The neckline represents the support level, which is drawn at the lows of this figure. It can be drawn only after the civil engineering model is fully formed.
Why is this figure formed?
As I already mentioned, the Head and Shoulders formation is a reversal pattern. Formation thus represents a loss of consumer faith in the prevailing trend. The right shoulder on the chart, which is below the head, gives the trader some important clues. This falling top on the chart represents a slowdown in the trend, which may lead to a reversal.
Any price movement on the chart carries a certain message. Some messages are easier to read than others, but we can always get some information using price action.
Regarding the Head and Shoulders pattern, the information we need is that buying power is running out and we should prepare for a potential market reversal.
The price structure forces the market to change its direction. There is a redistribution of buyers and sellers. The pattern that emerges is the result of this process.
Let's look at the following graph:
Note that after breaking through the higher high (head) and subsequent pullback, buyers were unable to push the price above the head again. This eventually formed the right shoulder.
A clear sign of an impending trend change is a succession of rising highs and lows. However, the current trend is not technically broken until we see a lower high and a lower low.
The Head and Shoulders pattern works precisely because of the change in the price structure of the uptrend. Therefore, always watch for a series of highs and lows of price movement.
It is important to remember that the Head and Shoulders pattern is confirmed only after the neck line is broken. By breakout I mean closing the price below the level.
A common mistake among traders is to assume that the pattern is complete when the right shoulder forms. In fact, it is only complete when the price closes below the neckline.
Let's take a closer look at the moment of breakdown:
Please note that price closing below the neckline was required to confirm the breakout. Although there were several candles before that were close to breaking out, they did not actually close below the level.
Features of pattern formation
The first important sign of a Head and Shoulders reversal pattern is the appearance of a bottom after a head has formed. If you also have a trend, the formation of a bottom will most likely cause its intensity to slow down. In many cases, this also sets the stage for a subsequent breakout of the trend line.
This is the first sign of a Head and Shoulders pattern appearing on the chart. We have two tops that are rising and in line with the bullish trend. However, the bottom created after the head is formed breaks the trend line. This indicates that the bullish momentum is slowing.
After the formation of the head is completed, we can expect the appearance of a third peak, which will be lower than the head. Sometimes, during the formation of the right shoulder, the price may test an already broken trend line as resistance.
The appearance of the third top on the chart means the full formation of the Head and Shoulders pattern.
The neck is considered the most important component in pattern trading. The reason for this is that the neckline acts as a trigger to enter the market. To draw the neckline, you need to find two bases - the bottom just before the head is formed and the bottom just after the head is formed. Then you must connect these two points with one line.
It is important to note that this line can be horizontal or slanted.
Inverted GiP pattern
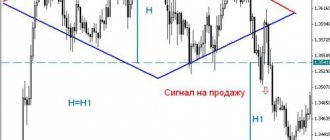
The inverted Head and Shoulders is a mirror image of the classic pattern. Instead of 3 peaks, 3 minimums are formed here. The lowest in this case will be the second minimum.
The peculiarity of this model is that it appears on the chart during a downward (bearish) trend. In case of a confirmation signal, you should soon expect an increase in the price of the asset.
How to enter a breakout of the neck line?
A breakout of the neckline is the signal we need to open a trade. To get a valid breakout of the Head and Shoulders pattern, we need to see price break through the neckline.
There are two breakout entry techniques.
Method No. 1
You can use a stop order to place a short position just below the neckline. Note that those using this method do not wait for the price to close below the neckline. The problem with this approach is that you expose yourself to the risk of a false breakout.
Method No. 2
The second method involves waiting for the neckline to be retested, and only then entering the market.
With the second entry method, we expect a retest of the neckline as a resistance level.
This allows us to:
- Get additional confirmation of the recent breakout.
- Get a better risk-to-reward ratio.
It is because of these factors that I almost always prefer the second method.
However, in this case, there is a possibility of missing the entry point if the price continues its downward movement without a rollback. Then we can enter the market on the first pullback. Just wait for it to happen.
The best pullbacks occur on small candles. But what if the candles are very large and the pullback happens much stronger than you expect? All is not lost because you can use the neckline retest technique to enter the trade and set the stop loss at the ATR of the retracement candle.
Method No. 3
You can also speed up entering a trade using a head and shoulders pattern before it even forms. This will give us an even better profit to loss ratio.
Wait for the market to form a left shoulder and head. After the market goes up again and the right shoulder begins to form, enter the trade at the first signs of a downward market reversal. You can use pin bars or an engulfing pattern to enter. And set the stop loss at 1 ATR.
Method No. 4
If you want to find the highest probability of a head and shoulders trade setup, you should use multiple time frames. The higher timeframe should be in a downtrend. The figure leans against the resistance line.
Ways to enter a long position
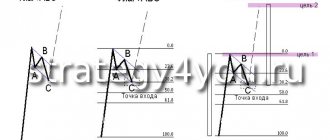
Figure 3 - Ways to enter Long.
There are three such ways:
- aggressive;
- standard;
- conservative.
The trading strategy for all methods is almost identical; their main difference is in determining the point for opening an order.
Aggressive way
Adherents of this strategy enter the market at the top of the right peak, marked on the chart by point E. By opening an order at this point, you can expect a profit of 1.5-2 times more than when trading with other methods. But until the model is fully defined, you need to be prepared that it is false and the price will go up. Therefore, it is better to play it safe and set a stop loss just above the level of the middle peak.
Standard method
The trade is entered after waiting for obvious signs of a reversal, but before the neck retest. The advantage is that you can get more profit than when trading with a conservative method. Disadvantage: when entering a position, it is still unclear whether the price will break through the level, or whether buyers will be able to defend it and it will go up. Therefore, it is advisable to also place a stop loss at the level of the middle peak.
Conservative way
The most optimal option in terms of profit and risk ratio. The market is entered after a retest at the price of the neck line. Although the risk in this case is minimal, to be on the safe side it is better to place a stop loss at the level of the right top or slightly higher. The advantage of this strategy is that there is a clear price reversal. Disadvantage - you have to sacrifice part of the profit to reduce risks.
Setting a stop loss
There are several options for placing a stop loss. Some traders prefer to place a stop above the right shoulder, while others choose a more aggressive placement. Therefore, you must choose the method that is most suitable for your trading style.
Let's look at three ways to place a stop loss.
Method No. 1
Place a stop loss above the right shoulder level.
In this case, we leave enough free space between our entry point and stop. However, this is not at all necessary. I would even say that it does more harm than good. A stop loss placed above the right shoulder is excessive.
Method No. 2
This is my preferred stop loss placement, where the stop is placed above the most recent retracement level.
In this case, the size of the stop loss is significantly reduced.
You can always use a tighter stop loss as it all depends on your trading style. However, remember that the closer the stop loss is placed to the entry point, the higher the likelihood of premature exit from the position.
Method No. 3
In this method, we close the position when the price closes above the neckline after recording a close below it. This means the model is no longer valid and the sellers are no longer in control.
Flag chart template
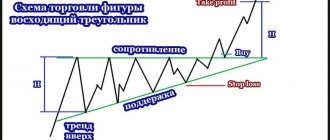
Pattern of continuation of a real trend. This is similar to a flag: after a strong price movement (flagpole), the price forms a correction zone (fabric) that is either horizontal or inclined to the flagpole. The fabric can take the shape of a rectangle, triangle or wedge. After the price completes the correction and consolidates above the Fabric resistance line, it is recommended to buy. The purpose of the template is the height of the flagpole. Flag chart template
Flag chart template
How to take profit?
Knowing when to take profits is one of the most difficult aspects of trading. When it comes to the Head and Shoulders pattern, there are several ways to take profits.
Approach #1
The first and more conservative approach is to take profits at the nearest key support level, a significant area on the chart where a strong price rebound can occur. However, remember to look for a favorable risk-to-reward ratio. That is, the nearest support level should be placed at a sufficient distance.
Approach #2
A second and more aggressive approach is to use price movement distance measurements.
When you use this method, you measure the height of the entire figure. Thus, regardless of the situation, you will always have a specific goal for fixing profits.
To do this, we need to measure the distance from the head to the level of the neck, and then set aside the same distance from the breakdown point.
While measured goals can be extremely accurate, they are rarely perfect. So to be more confident, consider them simply as areas, and always pay attention to the nearest level of support.
Approach #3
You can use the trailing stop technique and move the stop along the 20-period moving average. This means that you will only stop trading if the market closes above the 20MA.
Approach #4
You can also carefully monitor the price and exit the trade at the first attempts at an emerging consolidation or strong pullback.
Some examples of the Head and Shoulders figure
Here are a couple more examples of this pattern. Be sure to note that each time the price structure is formed uniquely, however, all the necessary elements are still present in it.
In the last example, the neck line will rarely look like a horizontal level, although more often than not it will be slanted.
Rectangular chart
This is a universal model that can predict both the reverse and continuation of a real trend. It looks like a sideways channel formed by horizontal support and resistance levels, where the price is consolidating. It is recommended to trade in the direction of the pattern breakout - if the price consolidates above the resistance line, buy; if it settles below the support line, sell. The pattern target is the pattern height (H) in pips.
Rectangular chart template
Key rules
At this point we are already familiar with the Head and Shoulders figure. We know how to enter the market correctly, where to place a stop loss and how to take profits. However, there are a few key rules that must be followed when trading this pattern.
The pattern should only form after an uptrend
This rule speaks for itself. Take a close look at the chart. There must be empty space on the left.
Shoulders should not be higher than head
You can't lift your shoulders above your head, right? The same applies to this pattern. The head should always protrude above the left and right shoulders. And although there are no exact rules for the minimum distance between them, it should be obvious at first glance.
The inclination of the neck line should be horizontal or upward, but not downward
If you find a head and shoulders where the neck line moves from the top left to the bottom right, the figure is considered untrustworthy. Eg:
While you may still see a reversal, the odds are not in your favor.
So you only need to see this pattern:
Notice that the neck line moves from the lower left to the upper right. This indicates the correct structure of this figure.
In my experience, the steeper the neck angle, the more aggressive the subsequent breakout and reversal will be.
The shoulders should be formed within the boundaries of one horizontal area
The graph below illustrates this rule well:
However, the left and right shoulders may extend beyond the horizontal range to some extent.
Which head and shoulders shape is the most reliable?
How reliable is this pattern and when can you enter a trade using it? Not all setups for this formation are suitable for trading. There are two things you need to pay attention to: the structure of the market and the duration of the pattern on the chart.
If the market is in a strong uptrend, it is unlikely that a small figure will change the price course. Instead, the market will likely continue to grow.
A head and shoulders that takes 200 days to form will be more significant than the same figure that takes just 20 days to form. Because if the market breaks the 200-day neckline, a large number of traders will be trapped in an open buy position and their exit from trades will increase pressure on the price, which will fall down. Therefore, if you want to find reliable trading opportunities for this pattern, you must pay attention to the market structure and the duration of its formation on the chart.
Stick to daily and weekly charts
The Head and Shoulders pattern shows the best results on daily and weekly timeframes. Although you can trade this pattern on a 1-hour or 4-hour chart, you risk losses due to the many false patterns.
Head & Shoulders Dashboard Indicator
The indicator, which is installed according to standard instructions, provides a summary table of patterns from all currency pairs and timeframes. Each pattern is indicated by the instrument name, time frame, signal direction (bullish or bearish), formation time (bars ago) and an instant link to the chart of the pattern. By clicking on the button with the name of the instrument and timeframe, a chart with the detected pattern will open.
Indicator settings:
- Symbols — list of instruments separated by commas;
- Is... Timeframe Enabled - enables or disables the search for patterns on a specific timeframe;
- Sort By - by what indicator to sort the found patterns. It is worth noting that sorting is also available by clicking on the column header;
- Sort Type - sorting in ascending (ascendent) or descending (descending) order;
- Price Proximity Percent - accuracy of pattern construction. A larger value will allow you to find more setups;
- Fill Patterns with Color - draw shapes with filling;
- Display Head and Shoulder - enable/disable display of the traditional figure;
- Display Reverse Head and Shoulder - enable/disable display of the reverse figure;
- Depth, Deviation, Backstep — parameters of the standard ZigZag indicator;
- Alert Title - alert title;
- Popup Alerts - enable/disable notifications about new signals in the terminal.
Trading examples
Let's look at a few examples of pattern trading within the framework of technical analysis.
The chart starts with a bullish trend. As the price moves, a Head and Shoulders pattern is formed. Once we have determined this model, let's draw a neck line. This is a horizontal line on a graph. A short position can be opened when the candle closes below this line. In addition, the stop loss should be placed above the second shoulder as shown in the figure. The minimum target is equal to the size of the pattern, as we discussed earlier.
As you can see, the price enters a bearish trend after the pattern is confirmed. Then the price reaches the minimum level of the pattern’s potential. At this point, you can either close your entire position or decide to leave it open to try to get some extra momentum out of the trade. In this example, we close the position when the price closes above the downward trend line.
We see a neck line that runs through the two bases. A short trade can be entered when the price breaks the neckline. The stop loss can be placed above the second shoulder as shown in the picture. You then need to measure the size of the pattern to get the minimum potential price movement.
Price action enters a strong bearish trend after the breakout. This trade can be continued until the price breaks the trend line in a bullish direction.
Note that the pattern occurs after a bearish trend when the market direction changes. This time the neck line connects the top and not the bottom because the pattern is reversed. A stop loss can be placed under the second shoulder that forms the pattern.
The price begins to rise after the breakout. However, the increase is not very sharp and shows price fluctuations. The lines on the chart show that the price increase resembles a consolidation in the shape of an ascending expanding triangle. This type of triangle has strong reversal potential. Therefore, the best option in this case would be to close the trade immediately after reaching the minimum target of the inverted Head and Shoulders pattern.
Figures in technical analysis
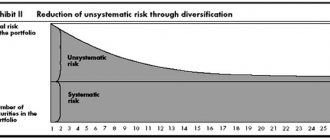
Trading based on technical analysis is based on natural price fluctuations that take place in the market. Despite the differences between markets and traded instruments, such movements often have characteristic features associated with the activities of trading participants. It is these actions that form stable trends, on the basis of which it is possible to predict the subsequent direction of prices.
One of the forecasting methods is based on the construction of graphical models that perform two main tasks:
- forecasting subsequent market movements;
- selection of entry and exit points.
Among graphic models there are three main groups:
- U-turns.
- Continuations.
- Uncertainties.