Good afternoon
Today I will talk about what stock market indicators are. What are they and what do they show? How to use them in practice? What determines the choice of one or another stock indicator for analytical work?
Advantages and disadvantages of specific tools. In addition, I’ll tell you how to combine them for more effective analysis, and in the end I’ll try to answer the main question: is it possible to really make money from this.
Now let's begin!
What are indicators and why are they needed?
Indicators in the stock market are mathematical formulas that are based on the study of available statistical data on the progress of trading and the presentation of this in a visually acceptable form (line, graph, histogram, etc.).
Such technical analysis tools help traders process data faster and study trends in the stock market.
Principle of operation
Any indicator is based on some data. For example, these could be average quotes, trading volumes, discrepancies or correlations between stock market instruments, etc.
Depending on what a particular technical assistant is researching, it can be used in different ways.
Since all information is transformed into a visual representation, a trader, using an indicator for a specific stock asset, has the opportunity to quickly determine overbought or oversold, trend changes, uncharacteristic surges and activity of market participants. And then use the obtained data directly in your trading, making more intelligent decisions.
Advantages and disadvantages
The advantages of stock market indicators include:
- ease of use;
- versatility of use;
- availability of large tools;
- availability.
Among the disadvantages, the following should be highlighted:
- subjectivity of indicators;
- relatively low reliability.
Momentum
Due to its simplicity and ease of interpretation, the momentum indicator has become widely used among traders. Momentum is calculated as the difference between the current price of the financial instrument in question and the price of the former price a certain period of time ago. This period of time is called the period of the momentum indicator. In fact, momentum is equal to the profit (or loss) received over a given period of time for the purchase of one unit of the financial instrument in question.
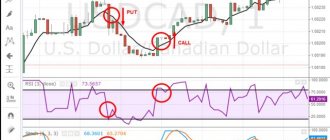
Momentum indicator on the price chart
Technically, this indicator shows the presence or absence of a trend, as well as the direction of this trend. Positive values of the indicator indicate an upward trend, negative values indicate a downward trend. A change in the indicator sign indicates a change in trend.
The main signals of this indicator are when it crosses the zero mark. That is, when momentum changes its sign, thereby indicating a change in the prevailing trend at a given moment in time. When the sign changes from plus to minus (the trend changes from upward to downward) it is a signal to sell, and when, on the contrary, from minus to plus (the trend changes from downward to upward) it is a signal to buy.
Read more about the momentum indicator in this article.
Types of indicators
In a basic sense, regarding the stock market data indicators involved in the algorithm for constructing indicators, they can be divided into the following types:
- Trending.
- Oscillators.
- Volumetric.
- Informational.
Below we will talk about each group in more detail.
Trending
Stock market trend indicators are generally used to clearly identify the prevailing trend or overall trend. Those. They are based precisely on the analysis of past quotes of the instrument.
Most of these technical assistants are plotted in the same window as the chart of the underlying asset.
The most popular representative of this family of technical analysis indicators and also the most used in principle is the “Moving Average” or “moving average”.
Its principle is quite simple. “Moving Averages” smooth out market activity relative to a certain period, resulting in a line that shows the average direction of price movement, excluding excessive volatility of the stock asset.
Oscillator indicators
Oscillators are a study of market volatility in conjunction with other time-varying factors.
In practice, they serve to determine the strength and stage of trend formation in the stock market in a certain range of quotes.
The most popular representatives of these stock market indicators are stochastics, ROC and RSI.
Most of these instruments are plotted in a separate window from the chart of the underlying asset, appearing as a limited range. For traders, a signal to act will be the oscillator entering the so-called “overbought” and “oversold” zones of the market.
Volume indicators
This group of technical tools contains algorithms that study trading volumes for stock market instruments.
Their goal is to determine when the market is most active.
The leader in popularity here is the “On Balance Volume” tool, which shows average volume data for the corresponding period of time.
Graphically, representatives of this family are plotted in a separate window from the quotes of the underlying asset and can look like lines or histograms.
Information
This is a non-standard type of indicative instruments, but it is often used by traders and is in demand.
Informational ones include, for example, an economic or corporate calendar, some special widgets with news reports, information about open positions and submitted applications.
They allow traders to determine moments relative to real information when markets may experience increased volatility or changes in movement during fundamental factors, monitor their accounts, opening/closing trading in different time zones, etc.
Moving average
This is perhaps the most popular indicator of all existing ones. The moving average is designed to smooth out the price chart and identify the main trends on it. It is calculated in such a way that each point provides information on prices for a certain period of time. This period of time is called the moving average period.
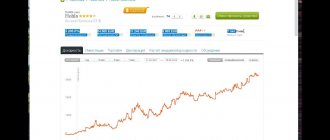
Price chart with moving average
That is, at each point of the moving average, the average price is calculated for the time interval specified in its settings. The longer this interval (period), the smoother the moving average and the less it reacts to small, insignificant price movements. On the contrary, as the period decreases, the moving average becomes more and more sensitive to each next surge (or trough) on the price chart.
The MA period is selected in such a way that, on the one hand, random fluctuations (volatility) of the price chart are ignored, and on the other hand, truly important price changes are not missed.
The simplest interpretation of the readings of this indicator comes down to analyzing its intersections with the price chart. If the price crosses the moving one from bottom to top, then this is a signal to buy. On the contrary, when crossing from top to bottom (the price crosses the moving average from top to bottom), we are talking about a signal to sell.
There are several types of moving averages:
- Simple Moving Average (SMA)
- Weighted Moving Average (WMA)
- Exponential Moving Average (EMA)
- Modified Moving Average (MMA)
As practice shows, the best results are shown by a simple moving average (SMA).
You can read more about moving averages, the signals they provide, as well as the methodology for calculating them here.
Rating of the most popular technical analysis indicators
The TOP list of the most popular technical assistants is as follows:
| Name | Group | Visual representation | Target |
| 1. Moving Average | Trending | Line on top of the underlying asset chart | Identifying trends |
| 2. MACD | Trending | Line chart in a separate window | Determination of change of direction of movement |
| 3. Stochastic Oscillator | Oscillators | Line in a separate window with highlighted zones | Finding zones (overbought/oversold) by determining the strength of the direction of the price impulse |
| 4.On Balance Volume | Volumes | Line chart in a separate window | Analysis of trading volumes |
| 5. Relative Strength Index (RSI) | Oscillators | Line in a separate window with highlighted zones | Determining overbought/oversold zones, as well as the presence of divergence. |
Calculation formula
Since 2012, the calculation of the values of the RTS and the Moscow Exchange has been carried out using a single formula. The indicators contain a list of identical issuers with the same weight.
Formula for calculating index values:
Where,
In — indicator value;
MCn—securities capitalization;
Dn is the divisor value.
The calculation includes the numbers at the time of calculation.
Formula for calculating the weight of the issuer as part of the value:
Where,
Cap i is the cost of the object of the i-th issuing enterprise;
W i is the specific weight of the value of the object of the i-th issuer in the total value of enterprises whose assets are contained in the base for calculating the indicator.
Information about the Moscow Exchange and RTS indices is updated in real time and posted on the official website of the Moscow Exchange. Investors can view:
- current price;
- leaders of growth and decline;
- change in quotes at closing;
- trading volume and price chart.
How to work with indicators
The first thing that is necessary to work with such tools on the stock market is a clear understanding of how the technical assistant used by the trader works.
It is important to realize that indicators are not accurate predictors of prices for exchange assets, but only reflect information about the current course of trading in a simple, understandable form.
Now regarding the effectiveness of using these tools. The beauty here lies in the correct combinatorics. To obtain more logical results, you should use several assistants at the same time. But they must be selected in such a way that the trader’s arsenal includes stock market indicators from the different groups that I indicated above.
Those. Covering your monitor screen with 10 trending instruments, while not paying attention to other factors, does not make any sense.
In turn, transactions will be more effective when several indicative signals are received in one direction at once.
RTS Index
The RTS Index (RTSI, RTS Index) is the price value of the Russian stock market, invented in 1995. Like IMOEX, calculations are carried out by the Moscow Exchange based on market capitalization. The composition includes the most liquid securities of Russian issuers. The list of companies and their share in the index are reviewed quarterly. RTSI is calculated in dollars and has a common calculation base with IMOEX.
The current market capitalization of the assets of individual issuers is reflected in relative units.
Example. The total capitalization of certain issuers for 2005 is 100 units. The RTS indicator for 2021 is 1,700. Accordingly, the market value of the property over the past 15 years, converted into American currency, has increased 17 times = 1,700 / 100.
RTSI is determined throughout the entire trading session. Calculation frequency is 1 second. There are two meanings here:
- The first value is the opening coefficient;
- The last value is the closing ratio.
The indicator accurately reflects the mood of market participants. When investors worry, the value increases, and complete calm causes the indicator to decrease.
Differences between RTSI and IMOEX
The Moscow Exchange and RTS index differ in the following criteria:
- Construction currency. IMOEX is determined based on stock prices in rubles, and RTSI - in dollars.
- Factors of change. The dynamics of RTSI depend on fluctuations in the dollar exchange rate. The fall of the American currency contributes to the growth of the RTS index by an identical amount. The IMOEX index is not linked to this.
- Volume of shares for calculation. The Moscow Exchange index is determined based on the assets of 30 issuing companies, and the RTS index is based on 50.
RTSI involves a wider market, but the trading volume on the Moscow Exchange is larger compared to the RTS platform, which indicates the advantage of the IMOEX index in terms of objectivity in reflecting the current situation on the market as a whole.