What is an exchange
Let's start from the very beginning, let's define what an exchange is.
Firstly, it is a huge market where securities are bought and sold. The word “market” is key here; it means that the laws of the market, the law of supply and demand, are fully in effect here.
Nise
Behind every price there is a certain person who set it. Therefore, prices very often demonstrate the mood of these people, which directly affects the price of shares or other securities.
At first glance, it seems that the exchanges are organized in the interests of the traders themselves, many of whom earned capital by carrying out speculative transactions. But this is actually not the case. Exchanges perform many functions:
- Exchange trading.
There is constant trading on the stock exchange, something is bought and sold. Brokers work as normal - they act as intermediaries between the exchange and traders.
- Preparation of exchange contracts.
Contracts are concluded on the exchange
. The contract in this case acts as the moment of the transaction itself. The procedure for completing a transaction is discussed in advance, the commission and deadlines for closing the trade transaction are specified.
Important! The task of the exchange will be to provide prompt assistance in concluding transactions and providing reporting information on the work done.
- Price quotes.
In general, price is an agreement between the parties to a transaction about the value of the transaction object in a specific period of time. The exchange constantly monitors the sentiments of trading participants and, based on this, issues a price displayed in charts.
It is important to understand here that being influenced by the opinion of the crowd will not help you achieve the desired results. You need to have your instincts, backed up by knowledge, all this will help you sell and buy securities on time.
Price quotes on charts
- Acts as a guarantor of transaction execution.
To perform this function, the exchange sets various rules and restrictions.
One of the most effective is the so-called “Margin Call”, which determines the stop level, expressed as a percentage of the deposit.
When this level is reached, the broker will be prohibited from opening new transactions. Thus, the necessary level of financial resources is ensured to fulfill the obligations already taken.
How to read a chart
But in addition to the order book, an investor needs to look at the chart to determine the stock price. Sometimes it's just a line, but it's not informative. Therefore, most often it is represented in the form of so-called Japanese candles. Here is an example of what a candlestick chart looks like.
And here’s another interesting article: Where to buy shares and how to get dividends on them
The chart shows how the price of a stock changes over a certain time - 5 minutes, 30 minutes, 1 hour, 1 day or even 1 month. These time intervals are called “timeframes”.
Each Japanese candlestick has four parameters:
- opening price – the price at which trading began in the selected period of time;
- maximum price – the price that the stock reached during the selected period of time;
- minimum price – the price to which the stock fell;
- closing price – the price at which the current candle closed.
These parameters form the body and shadow of the candle. If the closing price is higher than the opening price, then the stock has risen - the candlestick will turn green. If the stock price has fallen, the candle will be red. I showed everything in the picture.
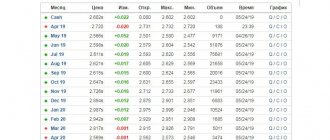
What can you understand by analyzing this candle? First, let’s pay attention to the timeframe – here it is daily. We analyze how the Sberbank share price changed on October 31, 2021.
Opening price, i.e. the price at which trading began on that day was 240.7 rubles. During the day it went up to 242 and fell to 234.01, but closed at a price of 234.89 rubles. The total price drop per day is 1.93%, or 4.62 rubles.
To see how the price behaved within a day (i.e., when exactly it fell and grew), you need to look at a lower timeframe.
To assess the global trend – i.e. where the stock is moving in general - you need to look at higher time frames - weekly and monthly. But a day is enough for a preliminary assessment.
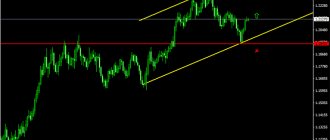
Looking at Japanese candlesticks, you can see repeating combinations. They are called patterns. Technical analysis was created based on these patterns. Adherents of this method try to determine the future of stocks and currencies using past data. To do this, various charts are drawn, levels are constructed, and various indicators are used (for example, moving averages, parabolics or MACD). Now I will not talk about whether technical analysis works or not - that is the topic of another article.
I will only note that a long-term investor does not need to dive deeply into technical analysis and make any forecasts, especially for the next two or three days. Fibonacci lines, alligators, scalping, martingale and all this is the lot of traders, not investors.
But you need to look at the chart and understand what is happening with the stock right now. For example, if a stock has fallen sharply, then you will be able to determine whether this is a consequence of a prolonged fall and a breakout of stops, after which the stock will not rise for a long time, or simply a nervous reaction to negative news. Or, if the stock has been growing for a long time and persistently, then you can roughly determine where the correction will be - i.e. look at the nearest resistance levels.
You can also see from the chart how volatile a stock is. If the candles are long, it means that the price changes sharply and unpredictably. The stock is said to be highly volatile. If the candles are short, with almost no shadows, the stock is low-volatility.
It should be noted that the same stock may behave differently at different periods of time. When there is euphoria or panic in the market, the candles become longer. With quiet trading, they decrease.
In general, of course, it is better to combine fundamental and technical analysis and draw conclusions based on all the data. But at the initial stage of analysis, a candlestick chart is also enough.
And here’s another interesting article: Pump and dump strategy, or How to avoid becoming stock market meat
By the way, it is useful to read what the stock price depends on - this way you can predict and understand both the rise and fall of the stock price. And you won't have to panic. Or you will start to panic, realizing that “everything is lost!” (With).
Types of exchanges
Speaking about “Exchange”, as a rule, a generalized concept is implied, but in fact, exchanges are quite different and have their own classification and purpose.
American Stock Exchange
These can be universal exchanges on which both goods and money (currency) are sold, for example:
- Sydney
- Chicago
- Tokyo.
Or specialized exchanges on which trading of a certain type of product is carried out, such exchanges, for example:
- New York Stock Exchange
- London Metal Exchange.
London Metal Exchange
In addition to this, exchanges can be classified according to other, quite different criteria.
For example, by its role in the international market, by the number and composition of participants, the principle of organizing the auction, and the product sold. By the last criterion, by the way, they are classified most often.
Stock exchanges
On such sites, the main assets are shares of various companies and enterprises, as well as various debt securities. Such exchanges exist in both economically developed and developing countries.
For example:
- Bombay Stock Exchange.
Bombay Stock Exchange
Stock exchanges provide an opportunity to accumulate and use financial resources. Helping to redistribute finances, directing them to the most promising areas.
Commodity exchanges
On such exchanges, a variety of goods are sold, ranging from agricultural products to precious metals. Commodity exchanges can be narrowly specialized or universal.
At the same time, highly specialized exchanges are more common. Examples of such exchanges could be:
- London Wool Exchange
- Kansas City Board of Trade, which sells wheat.
Kansas City Board of Trade
Commodity exchanges help weaken the influence of monopolists.
Also, reduce costs during trade operations or develop certain standards for the quality of goods and their prices, which can subsequently be used by other participants in international trade.
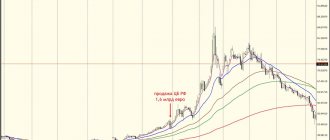
Currency exchanges
On such exchanges, goods such as “currency” are sold, that is, money of various states.
The main place for currency trading now is FOREX.
One of the largest currency trading exchanges was the Moscow Interbank Currency Exchange.
She subsequently opened a stock market.
And since 2012 it has been called “Moscow Exchange”.
Based on the type of organization of exchanges, the following can be distinguished:
Private exchanges
Distributed mainly in the USA and Great Britain. To participate in the work of the exchange, you must purchase a share.
State exchanges
Participants must be entered in the trade register and the business must meet established criteria.
Mixed exchanges
In this case, in addition to state regulation, private structures are also involved. The business invests financial resources and organizes the work itself and the entire bidding process. Control functions remain with the state.
Stock price forecasting: how realistic is it?
Due to the simultaneous influence of various external and internal factors on quotes, it is quite difficult to predict the direction and rate of their changes. Experienced investors use fundamental analysis methods to assess the feasibility of investing in certain assets.
The methodology is very labor-intensive because it involves a complex analysis:
- economic situation in the country;
- industry development prospects;
- results of the enterprise's work;
- securities market.
As a result, only a few professionals are able to qualitatively assess the prospects of investments, because income depends on a lot of chance.
Can you rely on technical analysis?
Technical analysis involves evaluating graphical images of quotes, and, unlike fundamental analysis, does not require additional information about the state of the company, market or industry. Its essence is the use of statistical and mathematical methods to identify patterns and make forecasts.
Professionals are skeptical about using mathematical functions without taking into account external factors. In their opinion, technical analysis can determine a trend with a certain probability, but no more.
Types of sites
Venues can also be divided into indoor and outdoor:
Closed
Only brokers who represent the interests of clients can take part in operations on such exchanges. Considered more secure than open exchanges.
Open
Not only professional traders, but also visitors have the right to conclude transactions using trading terminals (programs).
Depending on the scope of international trade, there is also such a nomenclature.
National
Operating within only one state, and taking into account the level of its development. Only representatives of this state can participate in the auction.
For example, the Port Moresby Stock Exchange, located in Papua New Guinea.
International
In this case, several states unite and create a common wholesale market. On such exchanges it is possible to make speculative transactions and transfer the profits without restrictions.
Using the glass in trading
Depth of Market is often used by traders who aim to guess price movements. We remember that you need to be careful with trading, but let’s consider using such a tool as a practice.
For example, a trader sees that there is a level on the chart that resembles support; it bounced upward from a specific level and was bought back. The market participant intends to check it, what will happen the next time it goes down, breaks or rebounds. To do this, turns to the glass, which according to applications in the area of this level. If there is a large order to buy, then most likely they will buy it again; if orders to sell are concentrated in a large volume at the level, the bears will win and the price will break through the level. There are other factors that need to be taken into account.
One more example. There is a short-term downward trend in the market, everything is falling, then the price suddenly turns around and begins to move upward. The trader is trying to understand whether this is a trend reversal or a regular correction. We look at the glass, if there are a lot of sell orders on the market, most likely this indicates the end of a growing trend and there will be a decline.
The order book requires attention from traders, as it can provide additional information for more accurate, efficient trading.
How the exchange works
The bull is one of the symbols of trading on the stock exchange.
Currently, the work of stock exchanges is carried out electronically, so when talking about the mechanism of their work, we will rely on this type. Exchanges with a paper form for carrying out transactions, of course, remain, but they will not interest us now.
And so, we can note three main components that interact with each other:
- traders (clients)
- brokers
- exchange (trading system)
In the diagram it will look something like this:
When conducting a transaction (buy or sell), the trader, using a trading terminal (program, for example QUIK), sends an order to the broker's trading terminal. The broker, through his direct connection to the exchange system, sends this order there.
After an order is received, the computing power of the exchange's trading system processes it and executes it automatically, selecting the best offers (within the order).
In addition to the named participants, a clearing house and a depository are also involved in the work of the exchange. More on this in the next chapter.
Who is a trustee and how is he related to the stock exchange?
The management company helps the investor select instruments that meet his financial goals, risk appetite and provide the desired return. The advantages of this type of investment are that the client does not need to monitor market changes hourly in order to buy or sell assets at the right time. Specialists will monitor this.
This method of investing is suitable for clients with little experience in the stock market. When concluding an agreement with a manager, you can choose a strategy according to which the company will work with your funds or agree with it on individual trust management. The client agrees in advance on the list of investment instruments, investment terms and the moment when the security needs to be sold if its value has dropped below the threshold set by the investor.
Exchange participants
The composition of exchange participants is not always the same; it also depends on its type and current legislation. At the same time, all the main participants can be divided into three categories:
- Participants concluding transactions;
- Organizing transactions;
- Participants controlling the progress of trading.
Only trained and accredited participants receive direct access to the exchange. The following groups can be distinguished among the licensed ones:
Brokers
It is brokers who represent the interests of private investors and organize access directly to trading. The main function of a broker is to mediate between the exchange and traders.
To participate in trading, the investor must enter into an agreement for brokerage services, and the broker must provide a trading terminal. Brokers perform operational activities, which are paid by traders in the form of commissions.
Executing client orders, maintaining reports and calculating taxes - all this is done by the broker.
Thus, to access trading, an investor must:
- enter into an agreement for brokerage services;
- open an account;
- install a trading program (terminal);
- start trading directly.
Dealers
These are the largest market participants.
Dealers are legal entities (commercial banks, investment companies) that carry out transactions at their own expense and in their own interests.
Such participants have significant capital and qualified employees. Dealers undertake to set prices for assets and execute trades at stated prices.
Registrars (register holders).
Any security does not exist on its own, but is issued by some organization or state, in other words, by the issuer. The issue of securities is carried out in the interests of the issuers, but their circulation is freely available.
In order for the issuer to have information about all holders of securities and to be able to fulfill its obligations, it is necessary to keep records of them. This is the kind of accounting that registrars (register holders) do.
Depositories
Accounting and storage of securities is carried out by depositories acting in the interests of investors.
Clearing and Settlement Houses
In such a huge mechanism as the stock exchange, various transactions with securities are carried out every second. There is no way to do this without the executor of orders and commands.
The functions of settlements, blocking of funds, transferring them from account to account are assigned to clearing and settlement houses. The activities of these participants ensure the fair execution of transactions and the availability of the necessary funds for this.
St. Petersburg order book for Apple shares
Let's look at an example:
We see that the red block is the prices of sellers, the green block is the prices of buyers. Near the price there is information regarding the number of lots that can be bought/sold. Let's assume that you intend to buy 100 lots of the company, the price is 284 dollars 70 cents, which is the current market price. But, you see that 15 lots are available at this price, it turns out that you will buy a further number of lots at a higher price. Conversely, if you wish to sell 100 lots to the company, the purchase price is $284.50 and there are currently 101 lots listed.
An important point is the difference between the lowest and highest selling price, called the spread. In this example the spread is 20 pips. Apple is not the most actively traded stock.
Let's go further, back to the example that we did not have enough lots to purchase at the posted price of 284.70 cents at the market price. If you want to buy the entire volume at a given price or buy at a low cost, then you need to place a limit order. The order falls into the glass and is placed there; you need to wait for the person who will be ready to sell at the set price and volume.
What is the main function of the stock order book ? Providing information about liquidity is an opportunity to sell an asset as quickly as possible at a price as close as possible to the market price. To assess the liquidity of an asset or instrument, we look at the number of orders and their density. Order density means whether at each price step at least some number of orders are placed. The price step is its minimum change. In the example under consideration, if we had a liquid market, orders were at the level of 284.70/284.71/284.72, etc. The gap in this case is large, this indicates that not at every cost step there are applications, the density is low and it is clear that there are not many applications. This is a characteristic that the market is not the most liquid.
Next, if you are concerned about the purchase price. Not every long-term investor cares about some cents or rubles, but if there is a large volume, I would not want to miscalculate the price. If an asset has high liquidity, we see that its glass is full, orders are placed at each price step, the volume is large, then in principle you don’t have to worry and buy at the market price. There are smooth price changes, narrow spreads, and most likely the user will not lose anything. If the purchase is made of low-liquidity instruments, the glass is empty or half-empty, this applies to ETFs, here it is better to buy through the glass. When the spread is large, immediately when you buy at the market you lose, and it is not a fact that you will have the paper at the market price, there is a possibility of slippage, the price will jump. If you don't use the order book, you won't know where the sell price is, so you can end the trade at a disadvantageous price.
If you are not in a hurry, liquidity is low, and you have time, then it is better to place limit orders here.