Analytics on oil reserves in the United States. What an investor needs to know
Every week, two American organizations, the Energy Information Administration ( EIA) and the American Petroleum Institute ( API), publish data on US oil and petroleum product inventories. How this information is useful for investors and what is worth paying attention to, we will tell you in this review.
In the oil market, like in any other, there are buyers and sellers who create supply and demand. In equilibrium, demand is approximately equal to supply. This means that all the oil that oil companies produce is sent to oil refineries and is then used by consumers in the form of gasoline, jet fuel, fuel oil, lubricants, raw materials for the production of plastic and other petroleum products.
Due to the nature of oil fields, most wells in the world produce continuously. Stopping and starting an individual well is a complex and expensive process. That is why, during periods of low demand, oil companies cannot quickly reduce production. Excess oil begins to accumulate in storage facilities. On the contrary, when demand exceeds supply, the shortage of oil is compensated from inventories.
When there is a surplus on the market, inventories of oil and petroleum products increase, and when there is a deficit in the market, inventories decrease. This relationship allows oil reserves data to be used as an indicator of market balance. This is especially useful for estimating demand, since there are practically no more accurate methods for measuring it.
Since oil production occurs continuously, many oil market indicators, including demand, production, imports and exports, are measured in barrels per day (b/d). Oil reserves are usually measured in barrels.
Why are oil reserves tracked in the US?
The United States is the world's largest oil consumer, accounting for about 20% of total global consumption. Recently, the United States has also become the largest oil producer, surpassing Saudi Arabia and Russia in terms of production.
The balance of supply and demand in the US can provide insight into the market as a whole. Since the start of the shale revolution in the 2010s, the rise or fall of the country's oil reserves has increasingly attracted the attention of bidders. Currently, this data is one of the key indicators of market demand. Every week, traders and other market participants monitor the publication of fresh statistics, which are often accompanied by an increase in volatility.
Let's take a closer look at the organizations that publish this information.
API (American Petroleum Institute) - American Petroleum Institute
This is an industry association representing American companies engaged in the production, processing and distribution of hydrocarbons. On Tuesdays at 23:30 Moscow time, API publishes the “Weekly Statistical Bulletin,” which reflects the activities of about 90% of all companies in the sector (about 650 enterprises), as well as data on oil reserves. If a day off falls on Monday, statistics are published on Wednesday.
EIA ( Energy Information Administration) - Energy Information Administration under the US Department of Energy.
The US Department of Energy regulates government energy policy. Every week on Wednesday at 17:30 Moscow time summer time (18:30 winter time), the department publishes a detailed report including key statistics of the oil industry: oil reserves, production, imports, exports, etc. If Monday is a day off/holiday day, then the data is published on Thursday at 18:00 Moscow time.
Key parameters that analysts are interested in in the EIA report:
Domestic Production - oil production in the USA, shows the level of production over the past week. Represents an approximate preliminary estimate that will subsequently be adjusted. The EIA rounds this figure to 100,000 bps.
Percent Operable Utilization - refinery load factor. The higher the refinery load, the more active oil refining occurs and the higher the demand for liquid fuel.
Commercial Crude Oil Stocks (Excl. Lease Stock) - commercial oil reserves. A key indicator that indicates the dynamics of oil reserves in the United States.
Total Motor Gasoline Stocks - gasoline stocks. The demand for gasoline is seasonal: in the summer it increases, which is characterized by a decrease in reserves. Deviation of stock dynamics from the average for a given time of year is a signal of a possible imbalance.
Distillate Fuel Oil Stocks - stocks of distillates.
Crude Oil Import - import of crude oil. Rising oil inventories can sometimes be a consequence of a surge in imports.
Crude Oil Export—export of crude oil. Over the past year, exports have been growing steadily. Before the coronavirus pandemic, analysts expected to see the United States as the leading exporter by 2024.
Whose data on oil reserves should you trust?
Data from API and EIA can sometimes differ significantly. This is due to the data collection methodology.
Unlike the API, the EIA is a government policy and requires companies to strictly disclose performance information. For untimely or false information, administrative or even criminal penalties are provided.
The API collects data on a voluntary basis. According to the association, the coverage of corporations is high, but there is no confidence in the accuracy and completeness of the published data. This mainly explains the differences in statistics.
Thus, EIA data is more accurate than information from the API and takes precedence when analysts assess the market situation. In turn, the advantage of data from the American Petroleum Institute is the publication time - they come out a day earlier. Traders can use the API statistics as a guide to adjust their forecasts to the EIA statistics.
How to use oil reserves data in trading
Short-term trading strategies based on the publication of data on oil reserves are no different from trading techniques on other news. At the time of publication of data on oil futures, there may be an impulse movement. A trader can either take a position on the movement or try to make money on a reversal. The direction of trading should be chosen depending on market sentiment, the technical picture and the data that has been published. The more actual data differs from forecasts, the greater the price momentum may be.
To plan longer-term strategies that involve holding a position for several days or weeks, it is useful to monitor trends that can be seen in statistical data. For example, a decrease or increase in inventories for several weeks in a row, as well as significant deviations from the average values for the last 3 or 5 years, are important. A graph comparing current stock dynamics with the 3-year average monthly level can be found in regular publications on our website.
Dynamics of oil reserves in comparison with the average level for 5 years.
“Shale bomb”: $30 per barrel and a new collapse
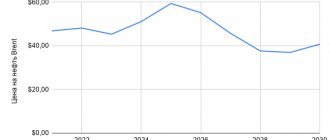
On February 9, the price of Brent oil exceeded $61 per barrel for the first time in a year. Prices for the WTI mark on the London ICE exchange also exceeded $58. Experts associate the rise in price of “black gold” with the OPEC+ deal to reduce production, as well as with additional obligations that Saudi Arabia voluntarily assumed, reducing production by a million barrels per day.
Although rising oil prices are traditionally considered a positive trend for Russia, as it helps fill the budget, too high a rise in the price of raw materials threatens the market with unpleasant consequences due to the intensification of shale production in the United States. According to oil services company Baker Hughes, the number of drilling rigs in America grew by 9% in January alone. Oil installations account for 299 units; for comparison, from June to October 2021 their number did not exceed 200 units.
Restarting production in shale fields takes much less time than in conventional ones, so once oil prices approached $60, which is considered the break-even point for most wells, production immediately picked up.
Countries with the largest proven oil reserves
7th place Russia 103,200,000,000 (103.2 billion barrels)
| Place | A country | Barrels |
| 1 | Venezuela | 298,400,000,000 |
| 2 | Saudi Arabia | 268,300,000,000 |
| 3 | Canada | 171,000,000,000 |
| 4 | Iran | 157,800,000,000 |
| 5 | Iraq | 144,200,000,000 |
| 6 | Kuwait | 104,000,000,000 |
| 7 | Russia 103,200,000,000 | |
| 8 | United Arab Emirates | 97,800,000,000 |
| 9 | Libya | 48,360,000,000 |
| 10 | Nigeria | 37,070,000,000 |
| 11 | USA | 36,520,000,000 |
| 12 | Kazakhstan | 30,000,000,000 |
| 13 | Qatar | 25,240,000,000 |
| 14 | China | 24,650,000,000 |
| 15 | Brazil | 15,310,000,000 |
| 16 | Algeria | 12,200,000,000 |
| 17 | Mexico | 9,812,000,000 |
| 18 | Angola | 9,011,000,000 |
| 19 | Ecuador | 8,832,000,000 |
| 20 | Azerbaijan | 7,000,000,000 |
News
Breaking News: Powell's Speech and Booking.comInvesting.com Report - 02/24/20215
Investing.com - Jerome Powell returns to Capitol Hill for a second straight day of speaking engagements, but he hasn't quite calmed the bond market yet. There is a sale in the Chinese market, while Hong Kong has...
European markets trade mixed on Wednesday Investing.com - 02/24/2021 Investing.com - European stocks traded mixed on Wednesday as traders weighed stronger-than-expected German economic growth and a string of corporate reports. At 03:45 p.m....
Breaking News: Stimulus details and profits for Lyft and UberInvesting.com - 02/10/20212 Investing.com - US House Democrats confirm plans to boost stimulus, the Senate votes to allow Donald Trump's trial to continue, inflation data in...
Latest US API Weekly Crude Inventories (BBL/1m)
What is the growth in US crude oil inventories?
- The volume of weekly oil inventories from API in the United States increased by 12.79 BBL/1 million. in March 2021. The maximum change reached 14.3 BBL/1 million, and the minimum -12.4 BBL/1 million.
- Data published weekly by the American Petroleum Institute.
| 12.79 | 09.03.2021 |
| 7.36 | 09.02.2021 |
| -4.26 | 05.01.2021 |
| -4.79 | 08.12.2020 |
| 4.15 | 11.11.2020 |
| -8.01 | 06.10.2020 |
| -0.83 | 09.09.2020 |
| -6.36 | 11.08.2020 |
US petroleum and refining industry
US Department of Energy
At the US government level, the fuel and energy complex is the responsibility of the US Department of Energy; hereinafter referred to as the US Department of Energy. The main structural divisions of the US Department of Defense include the departments of Nuclear Safety, Science, Energy and the Environment. The US DOE is headed by the Secretary of Energy, appointed by the US President. The post of Energy Secretary is held by Danny Ray Brouillette, effective December 2, 2021.
Reserves
According to the Energy Information Administration (EIA), proven reserves of petroleum raw materials in the United States at the beginning of 2019 amounted to 6.42 billion tons (12.1% higher than the level of the beginning of 2021). In the structure of reserves, crude oil accounted for 93.1%, condensate - 6.9%.
More than 70% of US oil reserves were concentrated within the states:
- Texas - 41.7%;
- North Dakota - 12.5%;
- New Mexico - 7.3%;
- Oklahoma - 5.3%;
- Alaska - 5.1%;
- California - 4.9%.
The 100 largest fields accounted for 56% of all oil and condensate reserves in the United States in 2014.
Texas is home to 27 of the top 100 US oil fields, including the country's largest, Eagleville (part of the Eagle Ford Shale), as well as the Spraberry Trend Area (2nd in the US), Briscoe Ranch (5th). , part of the Eagle Ford shale structure), Wasson (8th place), Sugarkane (13th place), De Witt (14th place).
19 of the largest oil fields in the United States are located in North Dakota. These include the Bakken shale plays of Stanley (19th in the country), Sanish (28th), Russian Creek (32nd) and Elm Coulee (34th).
15 of the top 100 US oil fields are in California, including Belridge South (9th), Midway Sunset (15th), Kern River (16th), Cat Canyon (17th) .
In Alaska, the most important oil and gas region is the North Slope, which includes the National Petroleum Reserves of Alaska (NPRA), the Arctic National Wildlife Refuge (ANWR), which are under the jurisdiction of the US federal government, and the Prudhoe Bay field, the third largest oil field. countries. The giant deposits located here also include Kuparuk River (6th place).
Significant oil reserves (11.9%) are concentrated on the country's continental shelf, which is under the jurisdiction of the US federal government. The largest deposits of Thunder Horse (7th place in the country), Atlantis (10th place), Mars (11th place), Mad Dog (12th place), Ursa (20th place) are located within the shelf.
In September 2009, BP discovered the Tiber field in the Gulf of Mexico, which, according to the company, could become the largest offshore field in the United States (estimated reserves are up to 800 million tons of oil). In November 2009, an influx of commercial hydrocarbons was received at the Kaskida offshore structure, whose oil reserves are estimated at 300–400 million tons. The operator of work at both fields was BP. In May 2010, as a result of the accident in the Gulf of Mexico, a temporary moratorium for a period of 6 months was introduced on deepwater drilling off the coast of Alaska, as well as in the Gulf of Mexico. However, in October 2010, the US government decided to lift the moratorium - the first company to again receive permission to drill was Noble Energy (March 1, 2011). Work on the Tiber field was resumed in 2013, and in January 2015, BP transferred the functions of the project operator to the American Chevron. Deepwater drilling began again at the Kaskida field in November 2011.
Given the high degree of dependence of the US economy on imported oil supplies in 1977, during the first world energy crisis, the Strategic Petroleum Reserve began to be created in the country to stabilize the oil market. To store oil in the Strategic Reserve, salt caves in the states of Texas and Louisiana are used with a total maximum storage volume of 99.2 million tons of oil:
- Bayou Choctaw storage area (6 salt caves) is located near Baton Rouge (Louisiana). Total storage capacity - 10.4 million tons of oil;
- Big Hill storage area (14 salt caves) is located near Beaumont (Texas). Total storage capacity - 23.2 million tons of oil;
- Bryan Mound storage area (19 salt caves) is located near Freeport (Texas). Total storage capacity - 34.6 million tons of oil;
- The West Hackberry storage area (21 salt caves) is located near Lake Charles (Louisiana). The total storage capacity is 31.0 million tons of oil.
If the country's leadership decides to reopen the reserve, the technical capabilities allow for oil sampling in the amount of 0.6 million tons per day. As of February 2021, the volume of oil in the US strategic reserve was 90.7 million tons.
Oil production
In 2021, the United States produced an estimated 545.8 million tons of oil, which is 17.2% higher than 2021 levels. Since the mid-1980s, US oil production has declined steadily, falling 44.3% between 1985 and 2008. However, between 2009 and 2015 there was an increase in production associated with active development of the deep-water shelf of the Gulf of Mexico and with technological innovations that allowed the development of unconventional oil in a number of states. In 2021, there was a decrease in oil production in the country, which, in particular, was due to the delayed effect of the reduction in the number of operating oil drilling rigs in 2015–2016. So, at the end of May 2016, their number was only 316 units. (-51.1% by the end of May 2015 and -79.4% by the end of May 2014), by the end of December 2021 it increased again - to 747 units. As a result, oil production increased again in 2021.
Most of the estimated oil produced in 2021 (41.4%) came from fields in the state of Texas, another 15.4% was produced on the country’s federal shelf, 11.5% in North Dakota, 5.5% in New Mexico, 4.8% in Oklahoma, 4.2% in Colorado, 3.8% in Alaska, 3.7% in California, 2.3% in Wyoming, 1.0% in Louisiana.
The sharp increase in production in 2012–2015 is primarily due to the increase in production capacity in Texas (Eagle Ford and Permian Basin shale structures) and North Dakota (Bakken structure). Oil production, million tons
| 2009 | 2010 | 2011 | 2012 | 2013 | 2014 | 2015 | 2016 | 2017 | 2018 |
| 267,5 | 273,7 | 282,1 | 324,8 | 373,3 | 437,6 | 470,4 | 442,8 | 465,7 | 545,8 |
According to EIA
Key oil companies in the US include Chevron, ExxonMobil, EOG Resources, ConocoPhillips, Anadarko Petroleum and BP.
BP's main assets are located in the Gulf of Mexico, Anadarko Petroleum - in Texas and Colorado, Chevron - in California and the Gulf of Mexico, ExxonMobil - in California and Alaska, ConocoPhillips - in Alaska, EOG Resources - in Texas (Eagle Ford). 20 largest US oil producers in 2021
| Name | Oil production in the USA, million tons/year |
| CHEVRON CORP. | 30,8 |
| EXXONMOBIL CORP. | 27,6 |
| CONOCOPHILLIPS CO | 22,5 |
| EOG RESOURCES INC. | 19,7 |
| ANADARKO PETROLEUM CORP. | 19,5 |
| BP PLC | 19,2 |
| SHELL OIL CO. | 19,1 |
| OCCIDENTAL PETROLEUM CORP. | 15,8 |
| PIONEER NATURAL RESOURCES | 12,7 |
| DEVON ENERGY CORP. | 11,7 |
| MARATHON OIL | 11,3 |
| NOBLE ENERGY | 8,8 |
| CONTINENTAL RESOURCES | 8,4 |
| CONCHO RESOURCES | 8,4 |
| EQUINOR | 8,2 |
| APACHE CORP. | 8,1 |
| BHP BILLITON | 7,9 |
| HESS | 7,8 |
| CHESAPEAKE OPERATING INC. | 7,0 |
| RANGE RESOURCES | 5,8 |
According to company annual reports
Development of hard-to-recover oil fields
According to the US Geological Survey, the largest oil shale basin in the country is the Green River, located at the junction of the states of Wyoming, Colorado and Utah and containing about 200 billion tons of geological reserves of oil shale. The reserves of the Piceance structure in western Colorado reach 200 billion tons, Uinta in Utah - 150 billion tons. These structures are not being developed, their technically recoverable reserves have not been assessed.
Proven reserves of oil from tight reservoirs (including shale oil) in the United States amounted to 2.74 billion tons at the beginning of 2018.
More than 90% of proven reserves are concentrated within 3 basins: Permian (1,134 million tons; New Mexico and Texas), Bakken (743 million tons; North Dakota, Montana and South Dakota), and Eagle Ford (657 million tons; Texas). The Woodford structure (Oklahoma) accounted for 56 million tons, the Marcellus structure (Pennsylvania, West Virginia) - 38 million tons, and the Niobrara structure (Colorado, Kansas, Nebraska, Wyoming) - 32 million tons. Production of hard-to-recover oil, million tons
| 2009 | 2010 | 2011 | 2012 | 2013 | 2014 | 2015 | 2016 | 2017 | 2018 |
| 29,7 | 39,4 | 61,5 | 103,3 | 146,0 | 195,8 | 229,1 | 211,8 | 247,0 | 323,9 |
According to EIA (Tight oil production estimates)
Tight oil production in the United States in 2021 amounted to 323.9 million tons (+31.1% by 2021), of which the Spraberry structure accounted for 21.0%, Bakken - 18.3%, Eagle Ford - 15, 9%, Wolfcamp - 18.7%, Bone Spring - 7.9%, Niobrara - 6.8%.
Most of the US shale oil production comes from the Eagle Ford Basin, which Petrohawk began developing in south Texas in 2008. Licenses to develop the largest license areas by area are held by EOG Resources, Chesapeake, Apache, and BP.
In the case of the Bakken, fractured shales serve as reservoirs that store hydrocarbons. The depth of the productive layers ranges from 1400 to 2100 m, the average thickness of the productive layer is 6.7 m, the porosity of the parent rock is about 8%. About 20 companies are involved in the development of the Bakken Basin. Licenses to develop the largest license areas by area are held by Continental Resources, Hess, ExxonMobil, Whiting Petroleum Corporation, and Newfield Exploration.
Production in the Permian Basin, located in the states of Texas and New Mexico, is carried out at the Spraberry, Wolfcamp, Bone Spring, Delaware, Glorieta and Yeso structures. Minor shale oil production is carried out at the Monterey/Santos structure in California (1.6 million tons in 2021). Geological exploration work on the adjacent Avalon structure is being carried out by Devon Energy, Chesapeake, Anadarko.
The rest of the shale oil production in the United States comes from structures that mainly produce shale gas: Marcellus, Barnett.
Oil export and import
The United States ranks first in the world in terms of crude oil import volumes, which allows the country to directly influence the state of the global oil market and the formation of oil prices.
Import and export of petroleum raw materials, million tons
| 2011 | 2012 | 2013 | 2014 | 2015 | 2016 | 2017 | 2018 | |
| Import | 446,8 | 427,5 | 386,5 | 367,2 | 368,2 | 392,5 | 396,8 | 386,3 |
| Export* | 2,4 | 3,4 | 6,7 | 17,6 | 23,2 | 29,5 | 57,6 | 99,8 |
According to EIA * Including re-exports
US oil imports were estimated at 386.3 million tons in 2021, down 2.6% from 2021 levels. The traditional suppliers of oil to the American market are the Persian Gulf countries (73.3 million tons in 2018), providing a total of 19.0% of crude oil imports to the United States.
Due to growing oil production in Canada, the share of heavier North American crude oils in the structure of US oil imports and consumption has been increasing in recent years.
Thus, Canada’s share in US oil imports in 2021 amounted to 47.6% (184.0 million tons), which is more than the total imports from the Gulf countries. Mexico's share is 8.6% (33.1 million tons). Structure of crude oil imports to the United States by exporting countries, %
| Canada | S. Arabia | Mexico | Iraq | Venezuela | Colombia | Ecuador | Nigeria | Brazil | Angola | Algeria | Other |
| 47,6 | 11,2 | 8,6 | 6,7 | 6,5 | 3,8 | 2,3 | 2,3 | 1,6 | 1,2 | 1 | 7,2 |
According to EIA
US oil is imported both through oil pipelines from Canada and by sea. The largest oil port in the United States is South Louisiana, located on the coast of the Gulf of Mexico. In 2021, 51.3 million tons of oil were imported through it (13.0% of all US oil imports). The largest oil terminals in the United States also include Houston, Corpus Christi, and Texas City.
Until December 2015, it was possible to obtain a license to export oil to the United States in only a few cases: for supplies to Canada for subsequent domestic consumption, for the export of Alaskan and heavy Californian oil, as well as for the re-export of unblended oil. In December 2015, restrictions on oil exports were lifted. In 2021, the United States exported and re-exported 99.8 million tons, up 73.1% from 2017. Supplies were made mainly to Canada (18.9%), the Republic of Korea (11.8%), China (11.4%), as well as to European countries.
Oil refining
In terms of production capacity of primary oil refining, the United States ranks first in the world.
The basis of the country's oil refining industry as of the beginning of 2018 was 132 refineries with a total primary processing capacity of 930.8 million tons of crude oil per year. Refinery capacity for primary oil refining, million tons per year
| 2009 | 2010 | 2011 | 2012 | 2013 | 2014 | 2015 | 2016 | 2017 | 2018 |
| 883,6 | 879,2 | 886,8 | 866,1 | 891,2 | 896,2 | 898,4 | 915,8 | 930,8 | 930,8 |
According to EIA data at the beginning of the corresponding year
The main owners of refineries in the United States are the following companies:
- Marathon Petroleum (16 refineries with a capacity of 150.6 million tons per year),
- Valero Energy (13 refineries with a total capacity of 108.6 million tons per year),
- ExxonMobil (5 refineries with a capacity of 86.3 million tons per year),
- Phillips 66 (9 refineries with a capacity of 83.1 million tons per year),
- Chevron (4 refineries with a capacity of 46.1 million tons per year),
- PBF Energy (5 refineries with a capacity of 43.1 million tons per year),
- Shell (5 refineries with a capacity of 41 million tons per year),
- PDV America (3 refineries with a capacity of 37.6 million tons per year),
- BP (3 refineries with a capacity of 33.8 million tons per year),
- Koch Industries (2 refineries with a capacity of 31.9 million tons per year);
- Motiva (a subsidiary of Saudi Aramco; 1 refinery with a capacity of 30.2 million tons per year).
The largest US refinery is the Motiva refinery located in Port Arthur (Texas) with a capacity of 30.2 million tons per year.
The country's largest refineries also include: Galveston Bay (Texas, 29.1 million tons per year), Garyville (Louisiana, 28.1 million tons per year), Baytown (Texas, 27.9 million tons per year), Baton Rouge (Louisiana, 25.0 million tons per year), Whiting (Indiana, 21.4 million tons per year), Lake Charles (Louisiana, 20.8 million tons per year), Beaumont (Texas, 18.4 million tons per year ), Carson (California, 18.1 million tons per year). Largest US refineries
| Location | Capacity, million tons/year | Operating company |
| Port Arthur | 30,2 | Motiva Enterprises |
| Galveston Bay | 29,1 | Marathon Petroleum |
| Garyville | 28,1 | Marathon Petroleum |
| Baytown | 27,9 | ExxonMobil |
| Baton Rouge | 25,0 | ExxonMobil |
| Whiting | 21,4 | B.P. |
| Lake Charles | 20,8 | PDV America (CITGO) |
| Beaumont | 18,4 | ExxonMobil |
| Carson | 18,1 | Marathon Petroleum |
| Pascagoula | 17,7 | Chevron |
| Philadelphia | 16,7 | Philadelphia Energy Solutions (part of the Carlyle Group) |
| Port Arthur | 16,6 | Valero |
| Wood River | 16,8 | WRB Refining (Phillips 66" - 50%, Cenovus" - 50%) |
| Saint Paul | 15,9 | Flint Hills Resources |
| Corpus Christi | 15,9 | Flint Hills Resources |
Primary processing capacity of over 15 million tons per year according to EIA data as of January 1, 2021
In 2015, two new refineries were put into operation in the United States, both in Texas: the Corpus Christi refinery owned by Buckeye Texas Processing (2.3 million tons per year) and the Petromax Refining refinery in Houston (1. 2 million tons per year). The Pelican Refining refinery in Lake Charles (Louisiana) with a capacity of 0.6 million tons per year was decommissioned.
In July 2021, ExxonMobil sold the Torrance refinery in California to PBF Energy.
In 2021, Magellan Terminal commissioned a refinery in Corpus Christi with a capacity of 2.1 million tons per year. The Antelope Refining mini-refinery in Douglas (Wyoming) with a capacity of 0.2 million tons per year was decommissioned.
In May 2021, Shell and Saudi Aramco split the Motiva Enterprises JV. The Anglo-Dutch company acquired 2 refineries in the state of Louisiana (total capacity - 22.6 million tons per year), the Saudi company, which retained the name Motiva, is the largest US refinery located in Port Arthur.
In October 2021, the oil refining companies Marathon Petroleum and Andeavor merged. The total capacity of the combined enterprise's refineries is 149.2 million tons per year.
The volume of primary oil refining at US refineries in 2021 amounted to 844.0 million tons, which is 1.7% higher than the 2021 level.
Volume of primary oil refining, million tons
| 2009 | 2010 | 2011 | 2012 | 2013 | 2014 | 2015 | 2016 | 2017 | 2018 |
| 716,8 | 736,2 | 740,3 | 749,9 | 765,6 | 792,4 | 809,4 | 809,3 | 829,7 | 844,0 |
According to EIA
Production and consumption of petroleum products
In 2021, production of petroleum products in the United States is estimated to be 926.5 million tons.
In the production structure, the share of motor gasoline was 46.1%, diesel fuel - 26.6%, aviation kerosene - 8.5%, petroleum coke - 6.4%, heating oil - 2.5%, asphalt - 2.2% , LPG - 2.1%, other petroleum products - 5.6%. Production of petroleum products, million tons
| 2011 | 2012 | 2013 | 2014 | 2015 | 2016 | 2017 | 2018 | |
| Total, including: | 852,6 | 849,9 | 871,5 | 895,7 | 906,9 | 917,4 | 926,1 | 926,5 |
| LPG | 19,5 | 19,9 | 19,6 | 20,6 | 19,3 | 19,9 | 19,8 | 19,9 |
| Motor gasoline | 387,6 | 383,0 | 395,1 | 409,5 | 417,4 | 428,9 | 426,2 | 426,8 |
| Jet fuel | 66,7 | 67,9 | 69,0 | 70,9 | 73,2 | 76,2 | 78,3 | 78,6 |
| Diesel fuel | 219,8 | 223,2 | 231,6 | 240,5 | 243,8 | 237,2 | 246,1 | 246,8 |
| Fuel oil | 29,5 | 27,5 | 25,6 | 23,9 | 22,9 | 23,0 | 23,5 | 23,3 |
| Petroleum coke | 55,8 | 56,7 | 57,7 | 58,1 | 57,9 | 60,5 | 59,7 | 59,5 |
| Asphalts | 21,9 | 21,0 | 19,3 | 19,3 | 20,5 | 20,0 | 19,9 | 20,0 |
| Others | 51,8 | 50,7 | 53,6 | 52,9 | 51,9 | 51,7 | 52,6 | 51,6 |
Based on EIA data (estimated using agency ratios for each petroleum product) * Estimated based on EIA data (estimated based on agency ratios for each petroleum product)
An estimated 885.1 million tons of petroleum products were supplied to the US market in 2021 (+2.1% by 2021).
In the supply structure, the share of motor gasoline was 45.1%, diesel fuel - 22.8%, LPG - 10.6%, jet fuel - 8.9%, petroleum coke - 2.5%, asphalt - 2.2%, fuel oil - 2 .0%, other petroleum products - 5.9%. Supplies of petroleum products to the domestic market, million tons
| 2011 | 2012 | 2013 | 2014 | 2015 | 2016 | 2017 | 2018 | |
| Total, including: | 825,6 | 806,8 | 822,6 | 832,0 | 846,9 | 856,5 | 867,1 | 885,1 |
| LPG | 69,4 | 71,0 | 76,8 | 75,4 | 77,2 | 77,9 | 83,2 | 94,0 |
| Motor gasoline | 374,5 | 372,5 | 378,4 | 381,7 | 392,7 | 399,8 | 399,1 | 398,8 |
| Jet fuel | 65,6 | 64,5 | 66,0 | 67,7 | 71,3 | 74,5 | 77,4 | 78,8 |
| Diesel fuel | 190,8 | 183,6 | 187,3 | 197,5 | 195,5 | 190,2 | 192,4 | 202,2 |
| Fuel oil | 25,3 | 20,3 | 17,5 | 14,1 | 14,2 | 17,9 | 18,7 | 17,6 |
| Petroleum coke | 23,9 | 23,9 | 23,4 | 23,0 | 23,1 | 22,9 | 20,9 | 22,1 |
| Asphalts | 21,4 | 20,6 | 19,5 | 19,7 | 20,7 | 21,2 | 21,1 | 19,8 |
| Others | 54,8 | 50,4 | 53,8 | 52,9 | 52,2 | 52,0 | 54,2 | 51,8 |
Based on EIA data (estimated using agency ratios for each petroleum product)
Export and import of petroleum products
Despite the fact that the United States is the largest producer of petroleum products in the world, its domestic consumption is so high that the United States imports significant amounts of fuel from abroad.
Nevertheless, in November - December 2010, exports of petroleum products from the United States for the first time exceeded imports. Since June 2011, there has been a tendency for the volume of exports of petroleum products to steadily exceed their imports. Export and import of petroleum products, million tons
| 2010 | 2011 | 2012 | 2013 | 2014 | 2015 | 2016 | 2017 | 2018 | |
| Export | 113,3 | 137,4 | 146,7 | 160,1 | 171,1 | 186,8 | 200,0 | 237,2 | 250,7 |
| Import | 116,2 | 110,8 | 90,9 | 91,4 | 83,4 | 91,3 | 95,2 | 100,2 | 100,0 |
Based on EIA data (estimated using agency ratios for each petroleum product)
In 2021, exports of petroleum products from the United States reached 250.7 million tons, exceeding the 2021 level by 5.7%.
In the commodity structure of exports, the share of diesel fuel was 24.9%, motor gasoline - 14.3%, heating oil - 4.2%, aviation kerosene - 3.9%. The main export destinations in 2021 were: Mexico (21.6%), Canada (10.4%), Japan (7.0%), Brazil (6.7%), the Netherlands (3.9%). Structure of US petroleum product exports by importing countries, %
| Mexico | Canada | Japan | Brazil | Netherlands | Chile | The Republic of Korea | China | Singapore | Others |
| 21,6 | 10,4 | 7 | 6,7 | 3,9 | 3,2 | 2,6 | 2,6 | 2,6 | 39,4 |
Structure of US petroleum product imports by exporting countries, %
| Canada | Russia | The Republic of Korea | Algeria | India | Great Britain | Netherlands | Venezuela | Belgium | Others |
| 27,5 | 13,3 | 4,6 | 4,2 | 4 | 3,9 | 3,2 | 3,2 | 3,1 | 33 |
US imports of petroleum products in 2021 amounted to 100.0 million tons (-0.2% compared to 2021). In the import structure, the share of motor gasoline is 29.5%, heating oil is 9.0%, diesel fuel is 8.4%, and aviation kerosene is 7.3%. The main suppliers of petroleum products to the United States in 2021 were Canada (27.5%), Russia (13.3%), Republic of Korea (4.6%), Algeria (4.2%), India (4.0%), Great Britain (3.9%), Netherlands (3.2%).
Who are APIs?
The American Petroleum Institute (API) is the only national non-governmental organization in the United States dedicated to research and regulatory activities in the oil and gas industry.
Every week, the API publishes a report based on forecasts for changes in the US oil industry for the week.