Just2Trade Blog | Good Reasons for the Continued Rise in Commodity Prices
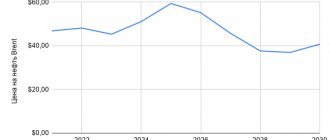
Commodity markets are booming. Oil is up about 30% this year, copper just hit a nine-year high, and grain markets are tight.
But there is one specific factor that could give global commodities an even greater boost. At a time when interest rates are low and bond yields remain historically low, rotating positions along the commodity futures curve offer tempting returns for passive investors. These thoughts have been expressed by some of the largest research units, including those at Goldman Sachs and Citigroup, analyzing the composition of commodity earnings this year.
The logic is simple. In active markets, nearby futures contracts are more expensive than later futures contracts. This means that investors can buy long-term futures contracts today and pay a lower price than those futures will cost shortly before expiration, thereby risking less in the event of an unfavorable market situation. Profiting from these value differences is what investors call circulating yield, and this attracts speculative money into commodities, pushing prices higher further.
Over the previous 12 months, this process, known as the positive outcome of asset ownership, delivered gains of 9% in oil and about 3% in copper, representing significant gains even without further price increases. With yields in many more traditional asset classes declining, this is one reason money is flowing into the commodities segment.
"If you have a market that provides 'ownership benefits,' that's pretty good," said Greg Sherenow, a portfolio manager specializing in energy and commodities at Pacific Investment Management. “That can be a really significant driver of returns and a really important component of an investor's success throughout the year.”
The fundamental reasons for the rally in commodity markets are varied. In the oil and copper markets, demand is expected to begin to outstrip supply as mass vaccinations roll out and movement restrictions ease, coupled with economic stimulus measures.
Other markets are strongly influenced by specific factors. Sugar, for example, is benefiting from delays at ports and a shortage of containers to transport sweeteners.
In the broadest sense, however, the multibillion-dollar commodity markets have one thing in common: investors' desire to profit from the global economic recovery and inflation.
“In particular, the current strong recovery in commodity markets is a consequence of investors seeking to hedge against inflation risks,” Jeff Currie, head of commodities research at Goldman Sachs, said in an interview with Bloomberg Television. “The demand for hedging such risks with commodities is quite high.”
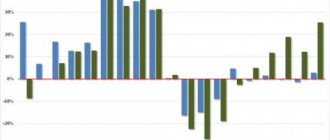
And here we should note very attractive profitability levels. Across a basket of 20 commodities, net bullish positions have risen 16% this year alone. They have jumped more than sixfold since the middle of last year.
However, there is a risk here. A sharp pullback in prices could outweigh the gains from the "upside of holding the asset" if markets turn strongly.
Perhaps in the future the influx of funds into commodity markets will increase. Citigroup says that due to soaring demand, copper prices will reach $10,000 per ton in the coming months. Deere raised its earnings forecast last week as the tractor giant saw early signs of rising demand in the agricultural economy. Over the past 10 years, when oil has been so profitable, prices have been at least $10 higher and sometimes close to $100 a barrel.
And so the cycle continues. As prices rise, the so-called “traffic,” in which short-term futures contracts cost more than contracts at later dates, steadily intensifies. This in turn helps attract new investment and means prices continue to rise.
“I suspect the price spread of the deportation could increase,” Ben Lacock, co-head of oil trading at Trafigura Group, said in an interview with Bloomberg TV, referring to crude markets. “We are optimistic about the future of the market, which means that the deportation pattern will continue for the foreseeable future.”
Open a trading account with Just2Trade broker UNIQUE OFFER FOR TRADERS
- Access from a single account to exchanges in the USA, Europe and Asia
- Stocks, bonds, commodity futures, currencies (forex), including cryptocurrencies
- Trading and support 24/7
LiveInternetLiveInternet
Tasks
1. Supply and demand on the domestic sugar market are specified by the functions:
Qd = 500 – 25P; Qs = 150 + 5P. In the foreign market of the same product, supply and demand are described as Qd* = 400 – 20P; Qs* = 200 + 10P respectively. Find the equilibrium domestic prices, the equilibrium world price and the corresponding value of imports. At world price Pw = 10, what volume of products will countries be able to export/import? Find the value of the shortage/excess of goods on the world market at the specified price.
Solution:
1 Find the equilibrium domestic prices, the equilibrium world price and the corresponding value of imports.
Equilibrium price: Qd = Qs
Equilibrium domestic price:
500 – 25P =150 + 5P
500 – 150=25P + 5P
350=30P
P = 350/30 (approx. 11.6 )
Equilibrium world price:
400 – 20P* = 200 + 10P*
400 – 200 = 20P* + 10P*
200 = 30P*
P* = 20/3 (approximately 6.66 )
At this price (P*=20/3 approximately 6.66) on the world market the volume of imports will be:
Qd* = 400 – 20*20/3= 266 (units)
The corresponding value volume will be: 266*20/3=5320/3 approximately 1773,33
2 At world price Pw = 10, what volume of products will countries be able to export/import?
world price Pw = 10
Qd* = 400 – 20*10=400-200= 200 (unit of demand)
Qs* = 200 + 10*10=200+100= 300 ( supply units)
3 Find the value of the shortage/excess of goods on the world market at the specified price.
As a result of calculations, we obtain the following inequality: Qd < Qs. Therefore, at a price of 10 there is a surplus of goods. The excess size is 100 (300-200) units.
Answer:
Equilibrium domestic price = 350/30 (approximately 11.6),
Equilibrium world price = 20/3 (approximately 6.66)
the corresponding value of import = 266 (units)
At world price Pw = 10, export of goods = 300 (units) import of goods = 200 (units)
Excess of goods on the world market 100
2. Paraguay can produce 10 thousand units per year. bicycles or 15 thousand tons of coffee. Uruguay can produce 20 thousand units over the same period of time. bicycles or 15 thousand tons of coffee. What kind of advantage and in what goods do countries have? Write the relative prices of bicycles and coffee for each country and the price ranges for which trade would be mutually beneficial.
Fill the table:
| Product | Country: Paraguay | |||||
| Bicycles (thousand pieces) | 10 | 8 | 6 | 4 | 2 | 0 |
| Coffee (thousand tons) | 0 | 3 | 6 | 9 | 12 | 15 |
| Country: Uruguay | ||||||
| Bicycles (thousand pieces) | 20 | 16 | 12 | 8 | 4 | 0 |
| Coffee (thousand tons) | 0 | 3 | 6 | 9 | 12 | 15 |
Assuming that goods are produced at the same unit cost, Uruguay has an absolute advantage in bicycle production.
In Paraguay: 1 bicycle = 1.5 tons of coffee, in Uruguay 1 bicycle = 0.75 tons of coffee, in Uruguay a bicycle is also relatively cheaper, i.e. Uruguay has a comparative advantage and can export bicycles in exchange for coffee.
Price intervals for which trading will be mutually beneficial
0.75 t coffee < 1 piece bike < 1.5 t coffee
In Paraguay: 1t. coffee = 0.667 bicycle, in Uruguay 1t. coffee = 1,333 bicycles. In Paraguay, coffee is relatively cheaper, i.e. Paraguay has a comparative advantage and can export coffee in exchange for bicycles.
Price intervals for which trading will be mutually beneficial
0.667 pieces bicycle < 1 t coffee < 1.333 pieces bicycle
Let’s say that before specialization, countries produced 6 thousand tons of coffee each.
After specialization and the beginning of international trade, the world price was established:
1 t. coffee = 1 bicycle. Countries export (import) 8 units of goods.
Find the total increase in production of coffee and bicycles and the increase in consumption for each good in Paraguay and Uruguay.
Solution:
| Before specialization | ||||||
| A country | Production | Export (-) / Import (+) | Consumption | Consumption growth | ||
| Paraguay | ||||||
| coffee | 6 | 0 | 6 | |||
| bicycles | 0 | 0 | 0 | |||
| Uruguay | ||||||
| coffee | 6 | 0 | 6 | |||
| bicycles | 0 | 0 | 0 | |||
| After specialization | ||||||
| Paraguay | ||||||
| coffee | 15 | -8 | 7 | +1 | ||
| bicycles | 0 | +8 | 8 | +8 | ||
| Uruguay | ||||||
| coffee | 0 | +8 | 8 | +2 | ||
| bicycles | 20 | -8 | 13 | +13 | ||
3. A Russian farm produces wheat and milk, for which it can use a maximum of 400 hours of labor and 600 hectares of land. Producing 1 ton of milk requires 4 hours of labor and 8 hectares of land. Production of 1 ton of wheat requires 10 hours of labor and 5 hectares of land.
1.Which factors of production are used relatively more intensively for the production of wheat, and which ones for milk?
2.Is the farm able to produce 50 tons of milk? And 90 tons of wheat?
3.What combination of goods will the farm produce if factors of production are employed at 100%?
Solution:
1.For the production of milk, 1.6 (8/5) times more land is used than for the production of wheat. Wheat production takes 2.5(10/4) times longer than milk production.
2. To produce 50 tons of milk you need: 4*50=200 hours of labor and 8*50=400 hectares of land. Tk: 200h.t.<400h.t. and 400ha<600ha, then the farm is able to produce 50 tons of milk.
To produce 90 tons of wheat you need: 10*90=900 hours of labor and 5*90=450 hectares of land. Tk: 900h.t.>400h.t. and 450ha<600ha, then the farm is not able to produce 90 tons of wheat.
3. to find the number of tons of simultaneously produced milk and grain at 100% employment, we will create a system:
Those. it is possible to produce 66.7 tons of milk and 13.3 tons of wheat using 100% of resources.
Answer:
1.: 1.6 times the land is used more intensively in the production of milk, 2.5 times the time is used more intensively in the production of wheat.
2.: the farm is able to produce 50 tons of milk, but is not able to produce 90 tons of wheat.
3.: With 100% utilization of production factors, the farm will produce 66.7 tons of milk and 13.3 tons of wheat
4. Using a unit of resources, the United States can produce 3 computers or 3 thousand bottles of wine. France can produce 1 computer or 5 thousand bottles of wine. What advantage does this example illustrate—absolute or comparative?
Solution
Because A country has an absolute advantage if there is a good that it can produce more per unit of input than other countries, then:
The USA has an absolute advantage in computer production.
France has an absolute advantage in the production of wine bottles.
Because differences remain in domestic price ratios between countries, each country will have a comparative advantage. That.:
the price of a computer in the USA is 1 computer = 1000 bottles in France 1 computer = 5000 bottles.
the price of a bottle of wine in the USA is 1 bottle = 0.001 computers. in France 1 bottle=0.0002
The US has a comparative advantage in computers, and France has a comparative advantage in producing wine bottles.
What would countries' production possibility lines look like if the maximum number of computers that could be produced in the US was 1,000, and the maximum quantity of wine that could be produced in France was 2 million bottles? (Place wine vertically (in thousand bottles), and computers horizontally (in units)).
The graph is based on the assumption that 1 computer = 1000 bottles
Draw the lines of trade opportunities for countries if the world price is set at the level of 1 computer = 2 thousand bottles of wine.
At this price, the United States can sell all its computers for 2 million bottles of wine, i.e. To buy 1000 computers, France needs to produce 2 million bottles of wine.
Let's assume that the price of a computer has increased to 4 thousand bottles of wine. How might this affect consumption levels in the US and France? Justify your answer.
If the price of computers increases to 4000 bottles per piece, then purchasing power at an initial cost of 1k = 2 thousand bottles
France will be reduced to 500 computers per bottle of wine produced (since the bottle productivity has not changed - 2 million). Wine bottle consumption in the US should not change. With an initial cost of 1k=1 thousand bottles
Consumption of bottles of wine in the USA has increased by 2 times. France's consumption of computers will also decrease by 2 times, since before that it could only buy 1000 computers, because The US does not produce more.
Characteristics of the strategy
Platform: any Trading instruments: USDCAD, AUDUSD, NZDUSD, USDCHF Timeframe: D1 Recommended brokers: Alpari, RoboForex, AMarkets
Open two daily candlestick charts, one for a leading commodity and the other for a currency pair. Add the Bollinger Bands indicator with a period of 200 to both and synchronize the candles by day of the week. Additionally in the indicator settings:
- Select the middle line;
- Add tapes with deviation sigma=1.
A signal to buy a currency pair occurs if:
- The pair crosses the lower Bollinger Band if the commodity is above the moving average.
A prerequisite for a transaction is the previous coincidence of trends - quotes were in the same zone below the moving average, and then the commodity began to rise, while the currency lagged behind the trend.
A signal to sell raw materials occurs under similar factors:
- Both instrument trends are above the moving average, after which the currency pair begins to fall and goes below the indicator’s middle line. In this case, any crossing of the upper Bollinger Band by the commodity is a sell signal.
Bollinger bands can serve as profit taking points. It is better to split the entry into several parts and add it at the time of retest or repeated crossings of the moving averages by any of the instruments, provided that the current price of the new transaction is better than the previous entry. In fact, we are talking about averaging a position.
The strategy does not provide for a specific stop loss level; the transaction can be held until the imbalance disappears: the currency and commodities converge in a trend, being simultaneously above or below the moving average. However, it is not recommended to take the transaction to this point; it may turn out to be unprofitable, given the cost of the accumulated swap.
When trading inverse pairs such as the Swiss franc, instead of selling, you should buy when both instruments are above the moving average and the currency crosses the upper band.
The situation of a strong franc exchange rate and a cheap gold price is quite a rare occurrence, so to buy the precious metal it is enough for both currencies to be below the average line, crossing the first deviation band.
“Pitfalls” of choosing commodity currencies
The strategy for trading commodity currencies only works in liquid pairs that will not “break” to win back internal news. Regardless of commodity prices, a civil war or political crisis will lead to a decline in the national currency against the dollar.
Pay attention to the country of Burundi, where coffee and gold exports account for 23%.
Both types of raw materials showed growth at the end of 2021, the cost of coffee beans especially soared, but the Burundian franc only lost its value.
For the same reason, traders who trade the USDRUB pair in correlation with oil sometimes notice how the dynamics of the ruble “refuses” this relationship.
The most reliable type of instruments that do not experience problems with liquidity and local economic crises are the main currency pairs. Commodities include the Canadian, Australian and New Zealand dollars, and the Swiss franc.
The economy of the country of alpine meadows, reliable watches and banks depends on gold no less than the African state that mines it - this is proven by the structure of exports.
Switzerland is engaged in gold processing and intermediary sales, helping some states to legalize the mined raw materials. In the 20th century, Germany resorted to its services during World War II and the USSR during the Cold War, not to mention the countries of the Middle East, Africa and Latin America.
Australia also depends on gold exports, although the continent's export structure is heavily dominated by coal.
A large number of coal grades, the specifics of transportation and delivery, as well as relatively low liquidity are factors that greatly reduce the real impact of this raw material on the national currency. Traders do not take into account its value, as can be seen from a comparison of the charts of three instruments: AUDUSD, gold and coal futures.
In the case of USDCAD, the high liquidity of a commodity that dominates the share of exports is not a clear argument for the influence of its value on the national currency. Canada's budget revenues clearly depend on foreign oil trade.
However, by plotting a graph comparing currencies and oil futures, we will not see any relationship between quotes:
The pitfall here is that traders look at the development of the US economy, only it determines the growth of Canadian oil exports, as well as car sales, which occupy no less a share of foreign trade. The benchmark for forecasting the movement of USDCAD is the S&P500 stock index.
The choice of a “guide” for the New Zealand currency also has pitfalls; the country is a leader in the supply of meat and dairy products to international markets.
The value of a currency is influenced by quotes from the CRB Index, which is a basket of commodities compiled and tracked by the Commodity Research Bureau.
Features of the forecast for the exchange rate of commodity currencies
As noted above, the trading system uses a simple logic of the relationship between the growth of raw materials and the national currency exchange rate. There are two types of cost discrepancies that have different predictive values.
If, with a medium-term fall in the currency and commodities, the latter begins to rise, this is a signal to find the bottom and open a long position in the commodity currency. The exchange rate will rise for a whole range of reasons: increased budget revenues, which have a positive impact on the economy; monetary policy measures of the Central Bank, which receives a large influx of foreign exchange earnings; actions of arbitrators, etc.
Rising prices for raw materials and a high value of the currency can lead to its sharp fall. Currency speculators will react in this way to the strengthening of the US dollar, which, in turn, may grow on crisis expectations. In this case, we can predict a subsequent drop in prices for raw materials due to a decrease in their consumption against the backdrop of economic stagnation.
How to find commodity currency?
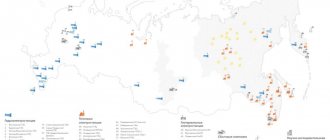
As mentioned above, the export schedule helps determine the commodity currency. On the website of the MIT Media Lab startup, you can get a fairly complete picture of any country in the world and instantly determine which product affects its GDP.
Click search (1), select the country (2) and the type of visualization (3). A more visual representation of the export structure is obtained in Tree Map mode, but the service can produce bubble charts, line graphs, etc. There are also many filters for specific products and raw materials, making it easier to find large exporters.
The picture below shows the breakdown of oil, where it is clear that the United States surpasses Russia in supplies, but this does not make the American GDP oil dependent.
To be convinced of this, just look at the structure of US exports; it has diversified budget income, since there are no foreign trade items exceeding a share of 15%.
A commodity currency is the national currency of a country with the share of exports of one type of raw material exceeding 15%. The more, the better the decorrelation “plays out”, thanks to which we are going to make money on the Forex market.