- Dollar Index Currency Basket
- Geometric weighted average
- Studying the dollar index
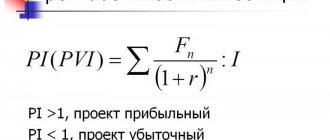
- Dollar Index Formula
- Trade-weighted dollar index
- How to Use the DXY Dollar Index in Your Trading
- Dollar smile theory
- Scenario 1: Risk Avoidance
- Scenario 2: dollar falls
- Scenario 3: Everything comes back
- Index
Indexes are a tool that allows you to get a complete picture of the state of not just a specific asset, but also an entire industry, country, and even a group of countries. Think of an index as a moving average for a group of assets. One of the most important is the dollar index.
Let's say in the USA there are such super-popular indices for working with stocks as:
- Dow Jones Industrial Average (DJIA – Dow Jones Industrial Average);
- NASDAQ Composite Index;
- Russell 2000;
- S&P 500;
- Wilshire 5000;
- In the Russian Federation, the main index is called RTS (RTSI).
If there are a bunch of indices for stocks, isn't it possible to come up with a similar one for the dollar? That's what they came up with. It’s called the US Dollar Index, also known as the US Dollar Index. You can find it on the live chart by selecting the ticker DXY .
The index includes a basket of foreign currencies whose value is compared to the value of the dollar. The principle is very simple. We have shares in a bunch of industrial enterprises. How long does it take to evaluate each one in order to get an overall picture of the state of the industry? And this has already been done for you - the Dow Jones Industrial Average is at your service.
Absolutely the same parsley with the dollar index. Want to know how the dollar is performing against key world currencies? The DXY Index comes to the rescue.
What is the dollar index
The US Dollar Index is a measure of the strength of the US currency and is followed by many market observers and analysts. It includes a basket of foreign currencies whose value is compared to the value of the dollar. It's quite simple - the dollar index shows how the dollar is doing against other world currencies, namely the euro, yen, pound, Canadian dollar, Swedish krona and Swiss franc. DXY is a convenient index that is used as a simple method to determine the strength and weakness of the US dollar. But its widespread use masks the fact that it does not reflect the value of the dollar relative to a fairly large basket of other world currencies.
Index
The dollar index is a macroeconomic indicator. Used to assess the global state of the American currency on higher timeframes. It is used either as a complement to fundamental analysis, or to find discrepancies between the index and EURUSD on 1-day time frames and above.
By examining US inflation and economic performance, the index will add another variable to the equation and provide an opportunity to assess the global outlook for the US currency. That is why he is a frequent guest on the screens of professional currency traders and analysts.
- Back: Commitments of Traders
- Next: Correlation between assets
How is the dollar index calculated?
The Dollar Index is a geometrically weighted index of the United States' major (listed above) trading partners. The structure of the dollar index is heavily skewed towards the euro and European countries that have not yet joined the European common market. Dollar index weighted components: Euro (57.5%), Japanese Yen (13.6%), British Pound (11.9%), Canadian Dollar (9.1%), Swedish Krona (4.2%) and Swiss franc (3.6%). Because of this composition of the DXY index, it is also called the “anti-European” index.
So how many countries are included in the index? If you think it's six, you're very mistaken. In fact, there are many more of them. The fact is that the euro is the official currency in 19 countries of the Eurozone - Austria, Belgium, Germany, Greece, Ireland, Spain, Italy, Cyprus, Latvia, Lithuania, Luxembourg, Malta, the Netherlands, Portugal, Slovakia, Slovenia, Finland, France, Estonia. The euro is also the national currency of 9 other countries, 7 of which are located in Europe. However, unlike Eurozone members, these countries cannot influence the monetary policy of the European Central Bank and send their representatives to its governing bodies. These countries are not included in the dollar index. Let's add to this 5 more countries - Japan, Great Britain, Canada, Sweden and Switzerland and we get almost the entire civilized world. Yes, China is missing, but the yuan is a specific currency, it never became the world’s reserve currency, and there is a special attitude towards it. The countries included in the index are not equal in their economic capabilities, so each of them is allocated only its own share in the index, which becomes more clear when looking at the formula for calculating the index:
DXY = 50.14348112 × EUR/USD^(-0.576) × USD/JPY^(0.136) × GBP/USD^(-0.119) × USD/CAD^(0.091) × USD/SEK^(0.042) × USD/CHF^ (0.036)
The first coefficient in the formula brings the index value to 100 at the starting date - March 1973, when major currencies began to be freely quoted against each other.
Disadvantages of the Dollar Index
Due to the fact that the dollar index is heavily biased towards European currencies, it significantly reduces the share of the Canadian dollar, which is a major partner of the United States. In addition, this index completely ignores the currencies of the Asia-Pacific region, including Korea, Australia, Taiwan and, more importantly, China. But even if someone tried to include the Chinese yuan in the calculation of the dollar index, it would be very difficult and not entirely correct, since China has pegged the value of its currency to the US dollar.
Despite some shortcomings, the DXY index serves as a reliable indicator of the strength and weakness of the US dollar and can be used as such, as long as it is remembered that it can become distorted during large movements of the single European currency.
Trading USDX using CFDs
The USDX Dollar Index can be traded through brokers that offer Contracts for Difference (CFD) trading on the Dollar Index.
The largest forex brokers offering the opportunity to trade CFDs:
- Alpari (broker review)
- AForex (broker review)
- Roboforex (broker review)
- LiteForex (broker review)
- Instaforex (broker review)
CFDs are derivative financial instruments whose value is determined by the value of the underlying asset of the futures contract underlying USDX traded on the Intercontinental Exchange.
Each broker has different terms and conditions for Dollar Index CFDs, so make sure these terms work for you.
History of the dollar index
The Dollar Index (DXY) was created by JP Morgan in 1973 and has only been updated once since then, when Europe adopted the euro.
The base value of the USDX index was taken to be 100.00. For example, a level of 107.50 means that the value of the dollar has increased by 7.5 percent relative to the base value. March 1973 was chosen as the base period because from that time the major trading countries introduced floating exchange rates. This agreement was reached at a conference of the Smithsonian Institution in Washington. The Smithsonian Agreement replaced the unsuccessful policy of fixed currency rates established some 25 years earlier at Bretton Woods.
Since 1973, the index has traded at a high of 160.00, and on March 13, 2008, a new low was set at 71.99. The index is updated 24 hours a day, 7 days a week. Just as the Dow Jones Industrial Average (DJI) is a leading indicator of the U.S. stock market, the USDX Index provides an overview of the international value of the U.S. dollar.
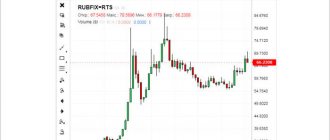
This is what his graph looks like:
The sharp drop led to price consolidation
As shown on the weekly chart, the index moved from an eighteen-year high to its lowest level since February 2018 as it declined steadily throughout 2021 and into early 2021. The most recent low was 89.165, just 1.015 above the early 2021 bottom, which was the lowest since late 2014.
The difference in interest rates plays a leading role in the value of one currency compared to another. The short-term Federal Funds rate fell to zero as the financial fallout from COVID-19 hit markets, narrowing the differential between the dollar and the euro. As dollar yields have declined, the US dollar has fallen.
Moreover, when Europe resolved the Brexit issue at the end of 2020, it lifted the cloud of uncertainty hanging over the euro and the British pound. The two currencies account for 71.2% of the dollar index. After falling from 103.96 to 89.165, or 14.2%, in nine months, the dollar index traded in a narrow range.
The daily chart shows the ICE Dollar Index futures contract traded between 89.165 and 91.605 in 2021, a narrow range of 2.44 after falling 14.795 points. The index remains near its low, but it is consolidating and has yet to challenge its critical technical support level at the 88.15 low from February 2021.
Trade-weighted dollar index
If the dollar index is so inaccurate, why is everyone paying so much attention to it? Although there are more accurate ways to evaluate the US dollar, absolute accuracy is not always important for the indicator. Many traders and financial companies probably have their own indicators that they use to track the value of the dollar, but it is always very convenient to use a common index for comparison. The dollar index is also closely correlated most of the time with the Trade-Weighted Dollar Index (TWDI) used by the US Federal Reserve.
It was created to more accurately reflect the value of the dollar relative to other national currencies, taking into account the competitiveness of American goods and services. The relative strength or weakness of the US dollar's movements reflects the huge flows of money. A 10% rise in the US Dollar Index is equivalent to a nominal fall in the value of global wealth by more than 1 trillion. dollars. A move of this magnitude does not occur in a vacuum, and the relative weakness in the dollar index reflects corresponding weakness in the trade-weighted index.
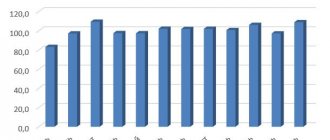
The index is quite recent, appearing in 1998. There are already many more currencies in it (there is both the yuan and even the ruble), and their share for July 2021 looks like this:
You can always get more up-to-date data on the US Federal Reserve website
By the way, there you can also get hold of the history of quotes for the period D1 of the dollar against the main world currencies since 1971.
In general, if you take a quick look at the TWDI chart, it is almost indistinguishable from DXY:
However, a closer look reveals the differences clearly. The main difference between the two dollar indices is that they contain a different number of currencies in their basket. In the case of the Fed index, many more countries are represented in it, and not all of them are industrial and financial leaders - there are many developing ones. So the TWDI index from the Fed is a more global reflection of the value of the dollar in relation to world currencies. Moreover, the share of currencies is based on trade balance data, which is updated annually.
Dollar smile theory
The dollar is a very interesting currency; it can strengthen in both bad and good economic conditions. As a result, one of the Morgan Stanley employees somehow came up with a fundamental theory that explains this phenomenon. It was Stephen Jen, an economist and currency analyst. His theory is called the "dollar smile theory." The essence of the theory is that the US dollar, in all its diversity, always adheres to only three scenarios.
The first part of the smile implies a situation where investors are looking for a “safe haven” for their funds held in dollars and yen. Because investors believe the global economy is slowing down, they are hesitant to buy risky assets and prefer to invest in less risky dollar assets, even if the US economy is not performing particularly well.
The second scenario is when the dollar falls sharply, updating its minimum values. This is the bottom part of the smile, which suggests that the US economy is weak, as is its national currency. In this scenario, discount rates are often reduced, which can also affect the depreciation of the dollar. As a result, the market gets rid of the dollar, and the smile becomes wider.
And thus we move on to the third scenario. The dollar is once again loved and respected thanks to economic growth in the US. There is more and more optimism, traders are starting to purchase dollar assets, US GDP is growing, and key rates are expected to rise.
A clear example of this theory is the 2007 crisis. In 2008, at the very peak of the economic crisis, the dollar began to strengthen sharply - investors fled to a strong currency from the global fire, triggering the first scenario. Then, in March 2009, investors switched to higher-yielding currencies and the dollar suffered a spectacular decline. This was the second scenario, after which the third was launched - a new growth of the dollar, which lasted until the summer of 2010, after which the cycle repeated.
This theory is just a particular example of how the economy of any country has a cyclical nature. Well, it’s time for us to discuss the specific application of the dollar index in trading.
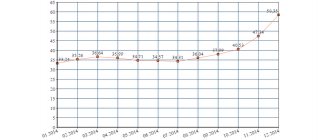
Historical data and forecasts
From the beginning of 2021 to date, the dollar index has fallen from 103.26 points to 95.72 points, showing a decline of 7.54 points.
As can be seen in the D1 period DXY index chart, it is now at the lower boundary of the channel it has been in since 2015. At the same time, at the beginning of 2017, an upward breakdown of the channel was attempted, which was not successful. I assume the further behavior will be something like this:
Apparently, pretty soon we can expect the dollar to strengthen at least to the upper border of the channel, and possibly break through it. Unless, of course, the lower border is broken. In any case, we are very close to the key point, the passage of which will serve as an excellent hint for further actions.
The rapid growth of the index, which dates back to mid-2014, has clearly taken a long-term pause, but a new serious trend is only a matter of time. And at the moment, when we are right at the key point, this question becomes very relevant, because it is in the coming months, weeks, and maybe even days that we can quite accurately catch the moment of emergence of this very long-term trend.
But of course, serious long-term traders never rely on technical analysis alone. It serves only as a trigger for making a trade - it is important to pull it at the right moment. However, it is fundamental analysis that most often determines which direction to shoot. And a number of fundamental premises also speak in favor of my forecast:
- Firstly, this is the beginning of a cycle of rate hikes by the US Federal Reserve against the protracted loose monetary policies of the ECB and the Bank of Japan;
- Secondly, there is a potential negative effect (for the pound) of the UK leaving the European Union.
Previously, a strong dollar had a negative impact on commodity assets, so a renewed negative impact on oil or, for example, copper prices cannot be ruled out if the US dollar rises. The intrigue of the year can be called the dynamics of American treasury bonds, whether the decline in securities will continue or not.
Now that we have identified the main macroeconomic drivers that confirm our forecast, to complete the picture, let's take a look at the monthly chart of the index:
In my view, the downward trend that had lasted since 2002 ended after the triangle broke upward in the second half of 2014. From this point on, we observed a strong upward trend, which gave way to a sideways consolidation range, with a breakdown of the upper boundary of which the upward trend will most likely continue.
Which indicators are best for predicting the dollar exchange rate?
In circles around the exchange, an opinion has formed that the dollar exchange rate depends on news on the US economy and statements by officials. This opinion was formed by analysts and journalists who are not real traders. However, in practice, it turns out that the release of important news is just a reason to “drive the currency up and down,” knocking down the stops of small players. When such movements occur, impulse and correction waves are formed much faster than during the normal course of the currency.
In fact, the DXY
goes from one level of accumulation of market maker orders to the next level of accumulation, as can be seen in the chart from the closed forum of the Masterforex-V Academy.
MF divides these order levels into strong and secondary (given on the closed part of the Masterforex-V Academy forum). It is also recommended to install for FREE the original indicators developed at the Masterforex-V Academy: these are AO_ZOTIK (more informative than the classic Bill Williams AO) and WPR_VSMARK (instead of the classic RSI).
Isn’t it true that it has become easier to understand the logic of dollar exchange rate movements? Please note that the chart shows only 3 of more than 30 proprietary tools developed at the Academy and which are used in professional Forex and Exchange training at the MasterForex-V Academy.
The dollar exchange rate is affected only by the purchase (Buy) or sale (Sell) volumes of the DX dollar futures, which is traded on the ICE Intercontinental Exchange. You can read more about volumes in the article Basics of Volume Theory.
Notice how trends (impulses) in the dollar index are supported by growing trading volumes, while correction trading volumes decrease:
Application in trade
It's hard to say why JP Morgan created this index and why it has become so popular. The very strange thing is that this index cannot be traded. There is no market where you can buy the dollar index. The only instruments that take into account the movement of DXY are futures and options on this index, which are traded on the InterContinental Exchange.
The dollar index chart is easy to open. Most often in the trading terminal it is designated as DXY or USDX. As mentioned above, you can see index updates on the same schedule as currency rate updates, that is, 24 hours a day from Monday to Friday.
The dollar index can be used to analyze forex market currency pairs, just as stock market investors use stock indices as an underlying contract to determine the general direction of the trend in the market. If you trade currency pairs that include USD, the dollar index will give you an idea of the relative strength of the dollar in relation to currency pairs such as EURUSD, GBPUSD, USDCHF, etc. and in case of forecast uncertainty will give a clearer picture of the market. We can safely say that USDX has a correlation with the above currency pairs and a trader can use this indicator as an additional indicator when analyzing the market. In the figure below, using the tradingview service, I derived the correlation between the dollar index and the main currency pairs that make up the index.
As you can see from the graph, the correlation is indeed quite high.
You can monitor the dollar index in a separate window of the trading terminal or in a browser window on the website, but for convenience, an indicator has been created that shows the USDX chart window under the chart of the selected currency pair. You can find/download this indicator at the end of the article.
Many people constantly monitor DXY for not only coincidence, but also divergence from the same EURUSD, since such a divergence can be considered divergence.
If the DXY exhibits increased volatility, it will be reflected in other currencies in the index, with a breakout of support/resistance on one chart corresponding to a breakout on others.
Don't forget where exactly the dollar is in your currency pair, it can be either the base or the quote currency.
If DXY strengthens and goes up (which means the dollar is strengthening), then the EURUSD chart will go down. On the contrary, for the USDCHF pair, a strengthening of the dollar means the chart is moving upward. If the dollar is the base currency (the first in a currency pair), then the dollar index and the currency pair will move in the same direction. If the dollar is a quoted currency, then the index and the currency chart will move in different directions. Quite often, movements in the index anticipate movements in major currency pairs. To test this hypothesis, I wrote a small helper bot that is based on just such a pattern. If, for example, the candle on the index is bearish, then on the EURUSD pair it should be bullish. If this is not the case, then we have divergence and will open for purchases on EURUSD. We will close the position in two days. We also use the simplest trailing stop and don’t forget to set the stop loss and take profit levels. Let's see what came out of this idea.
The EURUSD pair showed excellent results until 2012, but at the moment such a strategy is causing losses:
Perhaps you need to modify the basic strategy, introduce new rules to get a better result. However, for six whole years, from 2006 to 2012, the strategy gave very good results, so I think not all is lost and with proper study it is still possible to make a profit from it.
USDCHF performs worse, but we also have profit:
GBPUSD behaves quite well:
But USDCAD is not very suitable for such a strategy:
The chart for USDJPY is also not the worst:
The profit for the AUDUSD pair is not very good, but it is stable:
And if you trade all these pairs together, it won’t be so bad:
Well, using money management, 3% risk per transaction:
In principle, with some modification it is quite possible to work with such a strategy.
By the way, the dollar index also correlates well with oil prices:
This is due to the fact that the largest oil consumers are dollar inflation hedgers. Hence the inverse correlation of these instruments.
Because the dollar index measures the value of a basket of currencies against the dollar, it gives a clearer picture of the dollar's strength or weakness than when you look at a single currency pair like EURUSD. Many experienced traders look to the US Dollar Index before trading a USD currency pair and to avoid trading against the trend of the index.