One of the cross-currency instruments in the Forex market is the euro and Canadian dollar pair.
It is characterized by volatility, which varies between 130-200 points and exceeds the average values for the EUR/USD, USD/CAD, USD/CHF pairs.
What does the EUR CAD exchange rate depend on?
Neither the statements of officials nor economic news on the Canadian or European economy have practically any impact on the EURCAD exchange rate, but act only as a reason to “drive” the currency up and down when the wave-sub-wave cycles work out faster.
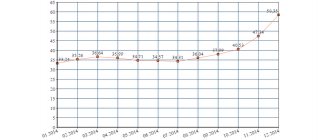
The EUR CAD exchange rate mainly depends on the movement of the Euro and Canadian dollar indices. So if you see
- trends in the EUR and CAD indices, which go in different directions, then for the euro/Canadian dollar currency pair itself, either a bearish or bullish trend will form;
- the trend of these indices goes in one direction, then a flat will be observed in the EURCAD cross.
An example of a powerful EUR CAD trend in June 2021: the euro and Canadian dollar indices are moving in opposite directions (highlighted on the chart with arrows).
The best indicators for forecasting the EUR CAD exchange rate
The EUR CAD exchange rate is also affected by
The levels of market maker order accumulations are the targets that the price strives for . The chart from the closed forum of the Masterforex-V Academy shows how the EUR CAD rate goes from one MF level to the next, which are divided into strong and secondary. And most importantly, only Masterforex-V Academy provides MF order levels not only for the main currency pairs, but also for their cross rates.
Along with the analysis of the euro and Canadian dollar indices, analysis of price behavior at MF levels, Masterforex-V recommends the free AO_ZOTIK (Zotik) indicator and the WPR_VSMARK oscillator, developed within the Academy.
This set of tools already makes it easier to understand the logic of movement of both the EUR CAD pair and other Forex currency pairs. The remaining tools are taught during professional training in Forex and Exchange at the MasterForex-V Academy.
Euro Canadian dollar exchange rate through the prism of myths from the Internet
There are opinions on the Internet that the EUR/CAD exchange rate is influenced by:
- changes in capitalization on exchanges in Europe and Canada (more precisely Euronext and the Toronto Stock Exchange);
- economic news that comes out with enviable regularity on the economies of the EU or Canada (however, the EUR CAD exchange rate and published news live separately from each other);
- quotes for the Euro Stoxx 50, CAC 40, or S&P/TSX 60 stock indices on stock exchanges in Paris or Toronto. For comparison, here are charts of NIKKEI 225 and euro Canadian dollar. Do you see the similarities? So we don't.
In addition, the EUR CAD currency pair is also affected by the volumes for sale (Sell) or purchase (Buy) of Canadian dollar (6C) and euro (6E) currency futures, which are traded on the Chicago Mercantile Exchange CME . A strong trend (impulse) in euro or Canadian dollar futures is formed when volumes increase on bullish or bearish movements. During corrections, volumes decrease. You can read more in the article Fundamentals of Volume Theory. From the article you will also learn why you cannot completely trust this tool.
For example, here is a chart for Canadian dollar futures 6C:
general characteristics
The EU currency in combination with the Canadian currency forms a cross pair. As with other instruments on the foreign exchange market, currency conversion is carried out not directly, but through US dollars.
The base currency in the pair is the Eurozone currency. Canadian dollars are a convertible currency. Based on the exchange rate, you can determine how many CAD should be given for 1 EUR.
The rate is displayed up to 4 decimal places, but there are charts that display a five-digit quote with tick fluctuations displayed.
The pair is traded mainly by traders living in Europe and North America. Despite the demand, the average difference between the purchase and sale prices is 7-11 points. This complicates the life of scalpers, who make profits with minimal price movement due to a large number of executed transactions and the choice of profitable trading strategies.
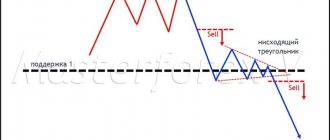
Trends for the EUR CAD currency pair
Movements in all currency pairs and in particular in the EUR/CAD pair are divided into:
- LONG-term trends (which are visible on timeframes from W1 to MN). The duration of such trends is calculated in years. Trends go from one reversal pattern to the next pattern of the same wave level (for example, “triple and double top or bottom or diamond, etc.). Before reversals, divergences are marked on the charts.
- MEDIUM-TERM trends (visible on timeframes from H8). The duration of such trends lasts from a week or more. Here you can clearly see the development of MF levels (clusters of market maker orders), real or false breakouts or rebounds from these levels. Trends continue as long as trend continuation patterns are observed - flags, pennants, wedges.
Forex forecast and cryptocurrency forecast for May 24 – 28, 2021.
First, a few words about the events of the past week:
–
EUR / USD .
“Some members of the Committee would consider it appropriate to begin discussing the topic of tapering monetary stimulus if the US economy is rapidly moving towards the targets set by the Federal Reserve,” was the phrase from the minutes of the meeting of the Federal Open Market Committee (FOMC), which was published on Wednesday, May 19 . The wording is more than vague. But it was against this backdrop that the bears tried to strengthen the dollar and push the EUR/USD pair down. As a result, pushing off from the last eight weeks’ high of 1.2245, it dropped by 85 points to support 1.2160.
However, then the markets quickly realized that in reality this phrase actually does not mean anything. And even if the US Federal Reserve starts discussing the possibility of winding down the QE program and raising interest rates in June, there is no point in expecting concrete steps on these issues yet. This “enlightenment” allowed the bulls to return the pair to a height of 1.2240. But they never managed to gain a foothold there.
On Friday, May 21, the rise in the yield of 10-year US government bonds from 1.61% to 1.63% and the decline in US stock indices, coupled with weak business activity indicators in Germany, again pushed the EUR/USD pair back to support 1.2160. Not far from which, at the level of 1.2180, the last chord of the week sounded;
–
GBP / USD .
The British currency fluctuates following investors' risk appetites. And naturally, the dynamics of GBP/USD are influenced by the same factors as the previous pair. At the same time, the pound seeks to update not only the annual, but also the 36-month maximum at 1.4241, and has already almost reached this goal.
Giving a forecast for the past week, most experts pointed to a corridor of 1.4100–1.4200. And this forecast, with a minimum tolerance, turned out to be almost perfect.
At the beginning of the week, pushed by positive statistics from the UK labor market, the pair rose from the horizon of 1.4075 to 1.4220. Then, after the rebound, trading shifted several points to the north – into the range of 1.4100–1.4232.
On Friday, during the American session, the growth of Treasuries and impressive data from IHS Markit on the US services sector forced the bulls to retreat again, and the pair completed the five-day period at 1.4153;
–
USD / JPY .
For four weeks in a row, most experts sided with the bears, expecting the pair to decline to support 109.00, and then 108.35. And their expectations were justified - having broken through the support at 109.00, the pair moved further south. True, it did not reach the second goal, and the local bottom was fixed at 108.56.
The yen was supported throughout almost the entire week by falling US bond yields and commodity prices. Perhaps the pair could have fallen further, but rising oil prices and Treasury yields returned it to the horizon of 109.00, near which – at the level of 108.93, it ended the trading session;
– cryptocurrencies.
The bullish rally that began in the fall of 2021 has left many investors in a state of euphoria. Having decided that digital assets will grow forever, they completely forgot that the crypto market is not just volatile, but extremely volatile. And that only a small push is enough to cause serious fluctuations. What if there are several such shocks, and they are strong enough? In this case, like during an earthquake, panic immediately arises, and the tsunami wave literally washes away from the market all positions opened using leverage.
In the first two decades of May, the crypto market experienced three such serious earthquakes. The first two were associated with Elon Musk.
First, Tesla announced that it would stop selling its electric vehicles for bitcoins, citing concerns about the environment. “We are concerned about the use of fossil fuels for mining. The future of our planet depends on the amount of gas emissions into the atmosphere. And we are not going to remain on the sidelines in solving environmental problems,” her press release said.
The second blow to the market came from Elon Musk’s tweet that Tesla might still sell previously acquired bitcoin tokens. Let us remember that just three months ago, BTC quotes jumped by 22% on the news that Tesla had invested $1.5 billion in Bitcoin. And now it can part with them.
The third panic hit the crypto market after Chinese financial institutions were banned from providing services related to digital assets. The statement was issued by three financial regulators overseeing online financial transactions, the payments market and clearing.
Now Chinese financial institutions cannot provide cryptocurrency storage and management services, as well as issue products related to digital assets. It is also prohibited to use them as a payment instrument. The three regulators said in a joint statement that virtual currencies “are not backed by real value, their prices are easily manipulated, and trading contracts are not protected by Chinese law.”
The head of the US Federal Reserve, Jerome Powell, expressed solidarity with the Chinese authorities, criticizing cryptocurrencies, saying that they pose risks to financial stability, and indicated that stricter regulation may be required. In parallel, the US Department of the Treasury came up with a proposal according to which information about cryptocurrency transfers in the amount of more than $10,000 must be reported to the tax service.
Let us recall that on April 14, Bitcoin reached a historical high at $64,600. And just five weeks later, on May 19, it fell to $30.225, losing 53%. (For Ethereum, these figures were, respectively, $4,364, $1,927 and 56%). Then the market seemed to be on the mend, and the BTC/USD pair rose to $42.285. However, on Friday, May 21, there was a reversal again, and by the evening of the same day it dropped to $33,550.
The Bitcoin Fear & Greed Index fell to its lowest level in the last 12 months on May 20 and amounted to only 11 points. By the very end of the working week, on May 21, it also increased slightly - to 19 points, and is now in the “Extreme Fear” zone. According to the index developers, such values indicate that the market is still in severe panic, and that perhaps after some time it will begin to grow.
It is clear that panic selling affected not only Bitcoin, but the entire crypto market as a whole. If on May 12 its total volume was $2.54 trillion, then on May 19 – just seven days later – this figure fell to $1.43 trillion. It was at the same level on the evening of Friday, May 21.
Concluding the review of the past week, it will be useful to add a little optimism to the sea of negativity. After all, in addition to those who lost their money, there are also those who made big money from the collapse in prices. Thus, according to the portal itsblockchain, one of the whales sold 3,000 BTC on May 9 at an average price of $58,500, and from May 15 to 19 bought back 3,521 BTC at an average price of $44,500. Thus, this investor made a profit of $18.7 million, and at the same time he increased his holdings by 521 BTC. And here it is appropriate to recall that the NordFX brokerage company offers its clients the opportunity to earn not only on growth, but also on market decline. At the same time, to open both long and short positions with a volume of 1 BTC, it is enough to have only $150 in your account. (For 1 ETH this figure is 10 times lower and equals $15).
***
As for the forecast for the coming week, summarizing the opinions of a number of experts, as well as forecasts made on the basis of a variety of methods of technical and graphical analysis, we can say the following:
–
EUR / USD .
If in the spring of 2021 The determining factor was the collapse of the economy under the blows of the coronavirus, but a year later everything turned 180 degrees. And now the main driver of the markets has become reflation, that is, economic recovery due to its active stimulation.
The S&P500 and Nasdaq indices update their historical highs over and over again. And investors, despite the overheated stock market, time after time, sell dollars to buy back sagging stocks and other risky assets.
Starting March 30, 2021 The DXY dollar index is trending down, and the EUR/USD pair is trending up. And while Fed officials say discussions about tapering QE could begin as early as June, that could only strengthen the dollar in the short term. The weakness of recent macro statistics is unlikely to allow the regulator to deprive the US economy of financial support. And if any concrete steps are taken, then most likely this will happen only by the end of this year.
Of course, no one is questioning the robust recovery of the US economy. However, this process has recently slowed down noticeably. So perhaps Europe will be the model for recovery from the COVID-19 pandemic. Today the Eurozone looks significantly stronger than it did a few months ago. The acceleration of the pace of vaccination and the reduction of quarantine measures in many EU countries suggest an imminent economic recovery. The European Commission has already raised its GDP growth forecast for 2021 from 3.8% to 4.3%. And now at the June ECB meeting we can expect an attack from the “hawks”.
The European economy is export-oriented. Therefore, the Joe Biden administration can also seriously help it by reducing the import tariffs introduced by the previous US President Donald Trump.
All this suggests that the bullish trend for the EUR/USD pair may continue. 70% of experts agree with this forecast, indicating this year’s maximum of 1.2350 as the target. The nearest resistance levels are 1.2245 and 1.2300. In the longer term, we can talk about the pair growing to a height of 1.2550.
The remaining 30% of analysts believe that the overbought US stock market should lead to a large-scale correction, as a result of which the pair will break through the support of 1.2160, drop first to the level of 1.2050, and then reach support in the zone of 1.1985–1.2000. Graphical analysis indicates that the EUR/USD pair will remain in the trading range of 1.2160-1.2245 for some time, after which it will move south. There is some confusion among the technical indicators on H4. But on D1 their readings are more definite - 85% of oscillators and 90% of trend indicators are colored green.
Regarding macro statistics, the most interesting is Thursday, May 27th. On this day we will learn the volume of orders for durable goods, as well as data on US GDP;
–
GBP / USD .
Given the improvement in weather conditions, May is likely to be a strong month for UK spending and business activity. In addition, the country's government is actively lifting the remaining quarantine restrictions, planning to lift them all on June 21. All this may lead to the fact that the bulls will achieve their goal, and the GBP/USD pair will update its 36-month high at 1.4241. 65% of analysts agree with this forecast, supported by 90% of oscillators and 95% of trend indicators on D1, as well as graphical analysis on H4 and D1.
True, then, in the first ten days of June, graphical analysis predicts a fall for the pound. The remaining 35% of experts also expect a correction to the south. Support levels 1.4100, 1.4075 and 1.4000;
–
USD / JPY .
Japan's low CPI (consumer price index), which was released on Thursday May 20, showed that real yields there are significantly higher than those in other countries. And this despite the serious weakening of the yen during the first quarter of this year.
The yen, as a safe haven currency, is under strong pressure from global reflation, as well as rising yields on long-term government securities of other countries, especially the United States. For comparison, the yield on 10-year Japanese bonds is 0.25%, while similar US securities are 1.63%.
On the other hand, the yen is supported by its purchasing power and the resistance of the Japanese economy to rising prices and inflation. Published PPI data showed that actual Japanese bond yields turned out to be positive in April, while their US counterparts, thanks to the Fed's printing press, are plunging deeper and deeper below zero.
Like the four previous weeks, the majority of experts (this time 75%) believe that the weakening of the yen has gone too far and it should continue to regain lost ground from the dollar. Although expectations in this case are quite modest - the levels of 108.55, 108.30 and 108.00 are indicated as targets. And support at 107.50 seems to be a very distant goal. The remaining 25% of experts are waiting for the pair to return to the 110.00 zone. The nearest resistance is 109.35.
The indicator readings on H4 look quite varied, on D1 there is a slight advantage (60%) on the side of the bears. Graphic analysis on both time frames indicates a sideways movement of the pair in the channel 108.30–110.00;
– cryptocurrencies.
After such a collapse, as one would expect, interested influencers unanimously rushed to reassure and convince the crypto community that not everything is so scary and the best is yet to come.
For example, Joel Kruger, a strategist at the institutional platform LMAX, believes that Elon Musk’s statements about Bitcoin’s high energy consumption were only a catalyst for a long-overdue correction. “There is too much noise around Tesla and Elon Musk,” he writes. “The pullback is caused to a much lesser extent by this, and to a much greater extent by technical overheating after the parabolic movement of the rate.”
Popular cryptocurrency analyst Lark Davis also believes that traders should not worry about Elon Musk's comments or the decline in Bitcoin's price. Davis advises taking a look at the 2021 bull run to see if Bitcoin can survive multiple declines. He noted that then there were 4 different corrections ranging from 30–45%.
Lark Davis is confident that the current growth is only in its early stages, and believes that rates will soar much higher before the end of 2021. “You have to take a broader view,” he advises. – The current situation with Bitcoin is not a cause for concern. This is a fairly ordinary situation that happens in the cryptocurrency market. Most likely, in a few weeks the trend will again become mega-bullish. Everyone will start saying again that BTC is a new concept of money and stuff like that. Now is not the time to panic and sell cryptocurrency, but rather the time to panic buy it. We have a great buying opportunity."
Glassnode analysts confirm Davis’s words. According to their data, during the pullback, when many new investors panicked out of their positions, long-term investors, on the contrary, continued to increase their investments. For example, business intelligence company MicroStrategy took advantage of Bitcoin's decline and purchased an additional 229 BTC worth $10 million. The purchase was made at an average price of $43,663. The author of the popular book “Rich Dad Poor Dad,” investor Robert Kiyosaki, also plans to buy on the current fall in Bitcoin.
Despite the collapse, Ark Invest fund manager Cathie Wood reaffirmed her forecast for Bitcoin. In an interview with Bloomberg, she said that in the future the price of the main cryptocurrency will rise to $500,000. Cathie Wood believes that the fall in the price of BTC was due to too strong emotions, which, as a rule, are not related to fundamental factors. However, she still sees a certain connection with the fact that the most volatile and innovative part of the stock market has undergone a significant correction.
A fly in the ointment can be considered Cathie Wood’s statement that, despite falling by more than 50%, the price of Bitcoin has not yet reached its bottom.
As for the main altcoin, there are plenty of bullish forecasts here too. For example, the founder of the crypto bank Galaxy Digital, Mike Novogratz, in an interview with New York Magazine, predicted an increase in Ethereum quotes to $5,000. According to him, this is driven by a combination of three factors: payment applications and stablecoins, decentralized finance and non-fungible tokens (NFTs). “I’m almost 100% sure that the price will rise – it’s just mathematics,” Novogratz explained.
And at the end of the review, our mini-section of crypto-life hacks. This time about how you can make money from the negative statements of famous newsmakers.
Outraged by Elon Musk's aforementioned tweets, crypto enthusiasts have developed a new token, Fuck Elon Tweet (FUCKELON). According to their statement, the maximum supply will be 1 billion coins. FUCKELON was created on the basis of Binance Smart Chain, and more than 9,000 wallets have already become its holders. And most importantly, the coin has already risen in price by 2000% and at the time of writing is trading at $0.005260.
Warning: These materials do not constitute a recommendation for investment or guidance on working in financial markets and are for informational purposes only.
Trading in financial markets is risky and may result in a complete loss of your deposited funds. #eurusd #gbpusd #usdjpy #forex #forex_forecast #nordfx #cryptocurrencies #bitcoin
Trading and earnings in Euro/Canadian dollar
Unfortunately, working on only one EUR/AUD pair will not bring the desired rate of profit, because about 20% of the entire movement of the euro/New Zealand dollar currency pair is in a trend, which gives the main profit to the trader, and the rest of the time the pair is in a complex flat-like movement.
Traders of the Masterforex-V Academy, who trade successfully and profitably, prefer to work not on ONE specific market or one instrument, but on different ones: be it the Forex currency market, futures or stock market, commodity market, cryptocurrency market, and so on. Thus, a successful trader does not care what market or instrument to trade on, but the presence of a trend is important, which could be for the euro and New Zealand dollar this month, gold or silver the next, cryptocurrencies in the third, etc. and so on. Got the idea?
It is work on DIFFERENT markets and instruments that will bring constant earnings of 300%-700% for several years, which is confirmed by the statistics of our Rebate - auto-copying service pro-rebate.com.
Examples and strategies for trading
For profitable Forex trading, it is important to adhere to some kind of action plan. Depending on the preferences of the trading person, you can choose a strategy aimed at obtaining quick profits or small income with minimal risks.
Experts identify hundreds of strategies. But before using them, it is advisable to test the selected tactics on a demo version of the account. This will allow you to avoid thoughtless expenses if you start using an ineffective strategy.
When choosing, you should focus on the degree of automation of the plan, the time interval for which the strategy is designed, risks, and possible profits.
A trader can choose a strategy based on fundamental or technical analysis. They are suitable for assessing the movement of the EUR/CAD currency pair. Also popular are the “Switchmen”, “Breakthrough”, and “Slope” strategies.
Recommended brokers for trading and investing in the Euro Canadian Dollar pair
The broker rating of the Masterforex-V Academy, which has existed for more than 10 years, notes that the TOP 5 brokers have all the financial instruments necessary for investing and trading, and in particular the EUR NZD currency pair.
About 50% of successful traders of the pro-rebate.com free autocopy rebate service trade with the NordFX broker, which can provide traders
- 33 currency pairs for trading, among which you can find EUR USD, USD CAD, GBP USD, NZD USD, USD JPY, USD CHF, GBP CHF, AUD USD, GBP JPY, USD RUB, EUR RUB, GBP SEK, NZD CHF, SEK CHF, USD SEK, USD NOK, AUD SEK, EUR CHF, EUR JPY, NZD SEK, EUR GBP, EUR NZD, EUR AUD, unfortunately, pairs such as USD BYN, USD CNY, SEK JPY, GBP SEK, USD UAH for now not available.
- stock indices (DAX 30 Index, S&P 500, Dow Jones 30 Index, FTSE 100, etc.), as well as cryptocurrencies: BTC, ETH, XRP, LTC and others.
- CFDs on oil, gold and silver.
Traders will love it
- the presence of popular trading platforms MetaTrader 4 for desktop and mobile systems, with ready-made indicators and oscillators for technical analysis of charts;
- opportunity to open an account from $10;
- the ability to trade various strategies - scalping and day trading or swing trading, etc.;
- providing low spreads (from 0.2 points) and high swaps (up to 5-6 dollars per day for one standard lot).
Traders are no less successful in trading with other recommended brokers: FxPro and the Swiss Dukascopy Bank SA.