Lazy Investor Blog > Stock Exchange
Let's say you decide to try your hand at the stock market, for example, in the USA. In Russia, stock exchanges can be counted on one hand, and the number of securities in free circulation amounts to several dozen. The stock market in the USA is many times larger, and in order not to get confused in the flow of information, find the right securities, analyze them correctly and you need stock screeners (see the commandments of a successful investor in the US stock market).
How to use the Sigma index in medium-term trading
The Sigma index allows you to quickly find assets with the lowest volatility when flats and triangles form on the chart, as well as assets with sweeping price movements when upward or downward trends dominate the market.
Low index values indicate that the market is experiencing a period of low volatility , a certain converging formation has emerged, and there is no pronounced directional movement. As a rule, this means that the market may soon exit the narrow price range by breaking through the nearest support or resistance level. At such moments, the market often looks like a compressed spring.
Such assets can be a worthy addition to your trading sheet - a list of assets that right now or in the near future may be interesting for trading on a breakout on the Daily, or intraday after exiting a sideways trend.
Depending on the cost of options, trading straddles and strangles may be relevant (the Theta and Alpha indices complement the Sigma index and simplify the process of finding entry points in the options market).
High index values indicate the presence of directed price movement , when there is a pronounced trend in the market, the price is in an impulse or corrective wave, and the market is in an active phase of movement.
Assets with a high Sigma index value are suitable for classic breakout or rebound trading on the Daily, as well as for day traders who intraday trade securities that are in a directional trend on the daily timeframe.
Options traders who trade uptrends and downtrends on the Daily can also use the high Sigma index selection to find optimal market entry points. Analysis of the Theta index and implied volatility will provide complete information on the advisability of such an entry point into the market.
Now a logical question arises: how many stocks from the list are worthy of attention and what index values can be considered high or, conversely, low. The answers to these questions can be obtained experimentally. According to our observations, the first 10 papers, located at the top and bottom of the screener, are the most interesting.
Let's look at several examples of using the index (to create a sample of securities for this article, we analyzed index values over 15 days).
Risk Warning
Of course, this is my subjective opinion. You may well rely on information flows that you trust, base your trading on expert opinions, and so on. The final choice is always yours.
Topic: Open interest and trading volume
In general, this story is intended for a newcomer to the stock market. I will try not to give recommendations that require significant effort on your part. At the same time, today I will generally refrain from making recommendations, since the information that I will provide today is taken for you from a source in which the author offers his subjective point of view on this issue. Therefore, on the one hand, it will be very easy to obtain data using the described method of setting up a stock screener. On the other hand, it will feel like magic. I would use it after deep study.
Search for flats and triangles using Herbalife as an example
The first example is Herbalife (HLF). As we can see in the chart below, almost all of September the price was in a very narrow flat ($66-$68). On October 4, 2021, the share price was $67.51, and the Sigma index was one of the lowest, the security was 5th in the list of Top 10 least volatile assets. The Sigma index value was 0.7.
As practice shows, the most attractive flats and triangles can be seen in securities with Sigma index values of 0.8 and below .
Low index values often indicate that the likelihood of the market leaving a given price range in the near future is high. For traders looking for such market conditions, there is an excellent opportunity to find an entry point when the price breaks through the nearest levels, or to look for an entry before the breakout occurs.
Chart 1. Herbalife (HLF). The Sigma index is 0.7 (5th place in the Top 10 least volatile assets).
Let's see how events developed in the future. Chart 2 shows the market state as of October 10th. A week later, the stock was already worth $76.84; at its peak, the price was approximately $80. At the same time, the Sigma index also changed and rose to 2.39.
Chart 2. Herbalife (HLF). The Sigma index is 2.39, the security has moved to the opposite part of the list (2nd place in the Top 10 most active securities).
The stock is no longer in a flat; on the contrary, there is an active bullish trend in the market and a price increase of more than 13% led to a threefold increase in the index (from 0.7 to 2.39). Herbalife in the screener table dropped to the opposite part of the list of assets according to the Sigma index and took 2nd place in the Top 10 most active securities.
This example clearly shows the main property of the Sigma index : assets with the highest index values are in an active trend, while the lowest index values show assets that are in flats and triangles and are often ready for active movement after breaking through the nearest levels.
Review of screeners - stock scanner for traders
This article offers a brief overview of the most famous free and paid screeners, since a stock scanner for traders is very important for collecting information in real time, as well as for tracking cryptocurrencies. All programs have a fairly convenient and intuitive interface, which makes it possible to easily follow the specific information that interests you.
FINVIZ stock scanner
FINVIZ ranks first in the list due to its huge selection of stock selection, very easy to use interface and full of functionality. The platform offers a well-composed list of both fundamental and technical selection filters. All results are shown in real time.
It is possible that your choice of ticker is immediately shown in the chart pop-up window in order to see what the chart is showing us. This is one of the features that distinguishes it from other scanners, which will be discussed below. Because of this focus on scanning quality and depth, FINVIZ should be the best ticker scanner for every investor.
Finviz
Google finance stock screener
The scanner provided by Google finance focuses on ease of use. The skills to apply such market scanning require little skill for the novice trader.
The main drawback is the preview, although there is a large selection of selection criteria. The scanner contains technical and fundamental filters of a fairly standard set.
The scan results with the latest news can be quickly viewed, which Google finance also presents for you. Some scanning features are presented by Yahoo finance, which we will look at below.
Google finance
Stock scanner for Yahoo finance traders
Every investor knows the capabilities of Yahoo finance. Yahoo offers two changes: advanced scanning, which operates in a separate window using Java, and basic scanning, which uses the main browser window.
An advanced scanner requires some skill on your part to use, but it does have a wide range of selection criteria. What really sets this scanner apart from others is the additional technical criteria that most scanners don't offer.
Charts can be saved on a computer or sent by email. Finally, with your selection results, you can simply click on any ticker and it will be shown on the corresponding Yahoo finance page (the interface has changed recently).
Free MorningStar Screener
MorningStar scanner (you need to create a free account and only then go to tickers >> tools >> screener) is very easy to use. Some traders may see its weakness in the depth of technical and fundamental selection criteria that are filtered, it operates on its own scoring system.
This free scanner shows investors a narrow score of three MorningStar ratings: Growth Rating, Earnings Rating and Financial Rating.
Once the criteria are selected, the results will be shown on a new page, which is a slight inconvenience, considering that you have to press the back button on the browser to return to your selection criteria and manage them again.
Overall, MorningStar's scanner is functional, but what it really offers investors is the ability to use several quality screening criteria by upgrading to a premium account.
MarketWatch
The MarketWatch Scanner has a very limited selection of fundamental and technical filters, but does provide users with a clean and very easy to use interface.
Overall, this screener is not very useful for investors looking for functionality. But it can definitely be used by investors to perform multiple ticker scans to build their list.
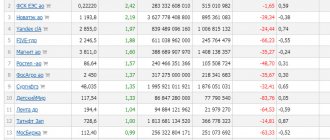
On this resource you can also monitor the “top gainers” and “top losers” before the market opens.
In 2014, the MarketWatch online scanner began providing its users with changes in cryptocurrency prices. Currently, 8 more altcoins have been added to the watch list and the most popular real-time e-money quotes are now in the scanner list.
VectorVest
The only analysis and portfolio management system that analyzes: the market, all sectors, ticker ratings (over 23,000) and charts, every day according to your own selection criteria in real time.
VectorVest provides the tools and techniques to test your ideas and establish your actions before you start trading.
Simplicity and automation make it easy to select tickers and strategies every minute. VectorVest provides objective guidance for independent investors. The software is paid, but the functionality is really great.
VectorVest
Trade Ideas and eSignal
It is worth paying special attention to this Trade Ideas Stock Scanner software, designed to help traders. This program has enormous customization capabilities for market scanning, also with the ability to customize and apply your own set of scripts.
To support users, there is a forum where you can find answers to questions about writing scripts and setting up scanners. The forum also has a chat where traders communicate and share information in real time (the forum is English-language).
Quite well-known software due to its capabilities, including integration into many trading terminals.
The graphic window has a fairly large number of various indicators that are used by almost every trader. Many novice traders and others use charts from eSignal, because... they are in many ways superior to the charts of most trading terminals.
eSignal
Search for flats and triangles using the example of Prospect Capital Corporation
Let's look at a second example: Prospect Capital Corporation (PSEC). During September, the security fluctuated in the price range of $6.6 - $6.8. On October 4, 2021, the share price was $6.74, the security was 4th in the Top 10 least volatile assets. The Sigma index value was 0.58.
Chart 3. Prospect Capital Corporation (PSEC). The Sigma index is 0.58 (4th place in the Top 10 least volatile assets)
This stock entered the Top 10 while the flat on the price chart had already been formed. At such times, the market may move in one direction within a few weeks. You can wait for a breakout of the level and trade when the market leaves the range, or analyze the Theta index and implied volatility for entry into a straddle or strangle from current prices. At such moments, there is often a great opportunity to profit from active price movement.
Chart 4 shows the market state as of October 13th. The market broke through the support level, came out of the flat downwards and began to actively decline. The share price is $6.22, while the Sigma index rose to 1.68. The stock fell by 8%, the market condition changed: the price was in a sideways trend, after the breakout the previously dominant downward trend continued. The Sigma index increased 3 times, and PSEC moved to the opposite part of the list, to 4th place in the Top 10 most active securities.
Chart 4. Prospect Capital Corporation (PSEC). The Sigma index is 1.68, the security has moved to the opposite part of the list (2nd place in the Top 10 most active securities).
What is a stock screener?
I've been running this blog for over 6 years. All this time, I regularly publish reports on the results of my investments. Now the public investment portfolio is more than 1,000,000 rubles.
Especially for readers, I developed the Lazy Investor Course, in which I showed step by step how to establish order in personal finances and effectively invest your savings in dozens of assets. I recommend that every reader complete at least the first week of training (it's free).
Stock screening is a service for searching (selecting) securities based on certain specified parameters. It is needed to simplify work on stock markets (such as the American stock market). For example, in front of you there is a bucket of coins, and you need to select the most valuable ones (for example, with a denomination of 5 kopecks, issued in 2004). What would you do? First, they would select all the 5-kopeck coins, and then look for the desired year among them. Or vice versa, they would select all the coins of 2004, and then look for coins of the desired denomination among them. Screener sites work on a similar principle, and the search performance is determined by how accurately you specified the query (set the filter).
A few examples of successful stock screeners for working with the NYSE:
- Google Finance Stock Screener;
- Finviz Screener.
These sites are more focused on the European and American markets, and at a minimum require knowledge of English. For the domestic stock market, you can use the screener on ru.investing.com, I’ll tell you about it below.
Search for flats and triangles using the example of Foot Locker
Let's look at another example of using the Sigma index to search for flats and triangles - the Foot Locker (FL) stock. At the end of September - beginning of October, the price was in a flat with a price range of $34 - $35. On October 4, 2021, the share price was $34.38. Foot Locker was the leader in the Top 10 least volatile assets. The Sigma index value was 0.78.
Chart 5. Foot Locker (FL). The Sigma index is 0.78 (1st place in the Top 10 least volatile assets).
Chart 6 shows the market state as of October 17th. The support level was broken and in 13 days the price dropped by 10% to $30.95. The Sigma index also changed and rose to 1.23, which indicates the presence of an active trend in the market.
Chart 6. Foot Locker (FL). The Sigma index is 1.23, the security moved from 1st to 194th place.
Service tariffs
A certain part of the information is provided by the service absolutely free, but for some you still need to pay. In total, Finviz has three tariff plans:
- free;
- registered;
- paid.
The cost of the " Paid " tariff is $25 per month . If you're trying to decide whether you really need finviz elite , then it makes sense to note that its main difference from the free version is the data latency. Therefore, if you want to use the site for real-time monitoring and screen companies while the exchange is open and actively trading, you will most likely still have to spend money on purchasing a paid version. Finviz elite will also be needed by those who are engaged in detailed analysis of stocks on small-scale charts with a time frame of less than 1 day.
If you are only interested in a rough selection of securities for market analysis, then the need for real-time data disappears by itself, and therefore the free version of the site will be quite sufficient for us. The service will provide you with information about companies, futures, and stock indices completely free of charge. In other words, you will get everything you need for global analysis .