China GDP
For several decades now, China has been asserting itself as a contender for economic dominance in the world. And in recent years these are no longer unfounded slogans. China has truly become the No. 1 economy. In any case, if you measure the scale of the economy through GDP (purchasing power parity, PPP).
| A country | GDP (billion US dollars), 2021 | World economic share |
| China | 23 393 | 17,39% |
| USA | 21 433 | 15,93% |
| India | 9 542 | 7,09% |
Source: International Monetary Fund (IMF)
An additional plus in China's macroeconomic indicators is its high GDP growth rate. Over the past few years, China's GDP has been growing at a rate of approximately 6% per year, which is very high for an economy of its size.
Other economic indicators
Let's take a quick look at other important economic indicators.
Debt load
This is probably one of the most negative aspects of the Chinese economy. The national debt is 51% of GDP, which is a lot, but not an exorbitant value (in the USA it is above 100%). Reliable figures on the debt burden of the corporate sector are difficult to come by. According to some estimates, in 2021 the debt of Chinese companies amounted to more than 150% (!) of GDP. This is already an alarming sign, especially for an investor. After all, by investing in Chinese stock indices, we are purchasing securities of public companies, which are the main holders of debt.
For comparison, debt / GDP in the corporate sector (early 2021 data):
- Russia – 29%
- USA – 48%
Inflation
Inflation has been quite successfully controlled by the Chinese Central Bank for the last 10 years. Average annual inflation for this period of time is 2%. This is a fairly comfortable level for the Chinese, which allows the Central Bank to keep interest rates low and reduce the negative effects on the economy from a high debt burden.
Currency
The Chinese yuan has been included in the IMF currency basket since 2021. At the same time, immediately after being included in the basket, the yuan overtook the pound sterling and the yen in weight. Today it is one of the most convertible and sought-after currencies in the world, although the yuan is still a long way from the dollar.
The Central Bank of China declares the free (market) formation of the yuan exchange rate. But a number of countries (primarily the United States) regularly doubt this, and they accuse China of waging currency wars. Considering the export orientation of China's economy, this is not too difficult to believe. The signs of exchange rate regulation are especially clear in the period before the yuan entered the IMF basket (until 2016). To do this, just look at the yuan exchange rate chart against the US dollar.
If the Central Bank of China really interferes in market mechanisms for regulating the exchange rate, then this is obviously a big “minus” for the investment attractiveness of Chinese assets.
Labor productivity
The “Chinese Miracle” is largely explained by the huge number of working-age population, the low cost of labor (although now this is no longer entirely true), and most importantly, the gradual increase in labor productivity. If OECD data is to be believed, productivity improvements are far from over. It still remains at an extremely low level, which means it will continue to gradually increase unless some external factors interfere with this process.
Oil prices
China is one of the largest importers and consumers of oil and petroleum products. In an external environment with low prices for raw materials, China is obviously among the countries for which the situation is favorable.
Which companies are included in the SSE Composite Index?
Legal entities applying for participation in the index are subject to fairly stringent requirements.
- First, shares of issuers must be issued only after approval by the Securities Administration Department of the State Council of the People's Republic of China.
- Secondly, the company’s authorized capital must be at least $4.5 million, and the number of shareholders must exceed 1 thousand people.
- Thirdly, the company must have been operating on the market for at least three years. Moreover, she cannot engage in illegal activities for three years.
Today the index includes shares of the Air China airline, banks (Bank of China, Bank of Communications, Hua Xia Bank), metallurgy enterprises (Aluminum Corporation of China and Baosteel), the online sector (CHINA UNICOM and Beijing Gehua CATV Network), and the oil industry (SINOPEC Shanghai Petrochemical Company), transport and railway companies (China Merchants Energy Shipping and Jiangxi Ganyue Expressway), energy and others.
China's blue chips form the SSE 50 index (shares of the fifty largest companies).
Price indicators
Good news (if it is news, of course) for investors. China is among the countries with the most undervalued assets today.
China occupies one of the first places in terms of cheapness of markets (2nd place after South Korea).
Schiller's Cyclic PE10 (CAPE) is 17.5.
For comparison: US CAPE – 30.6 (the most expensive market by this indicator)
The P/E of Chinese markets is 12.9.
For comparison: US P/E – 29.3
The weight of Chinese publicly traded companies in global capitalization is 3.6% and growing steadily (USA: 47.7%).
Index trading using CFDs
The AvaTrade brokerage platform provides the opportunity to enter into transactions with any indices and stocks using CFD contracts concluded for the difference in price. The principle of such agreements allows you to open orders without purchasing an asset, using wide leverage. With our help, you will be able to work on all popular trading terminals within the framework of effective technical and information support.
Open an accountDemo account
Register with AvaTrade brokerage company and start trading the China A50 index right now!
China Index Funds
In China, as in other markets, there is a real boom in the development of exchange-traded funds (ETFs). In 2021, there were a total of 374 different ETFs in China across three exchanges:
- Hong Kong Exchange
- Shanghai Stock Exchange
- Shenzhen Stock Exchange
This is, of course, much less than in the EU (more than 5,700 ETFs) and the US (more than 1,900 ETFs), but the number of ETFs in China is growing rapidly.
In this review, we will only consider funds that can be purchased on the NYSE, NASDAQ or Moscow Exchange (there is one such fund) due to their availability and ease of analysis.
There are no large or popular ETFs for Chinese bonds. Therefore, we will focus on equity funds.
Chinese stock ETF
In the table of exchange-traded funds, we included the world's most popular exchange-traded funds (ETFs) for shares of Chinese companies, as well as the FXCN fund of the management company FinEx, available on the Moscow Exchange.
| Ticker | Name | Capitalization, USD | Management Commissions (TER) |
| MCHI | iShares MSCI China ETF | 6.15 billion | 0,59% |
| FXI | iShares China Large-Cap ETF | 3.3 billion | 0,74% |
| GXC | SPDR S&P China ETF | 1.47 billion | 0,59% |
| CNYA | iShares MSCI China A ETF | 0.52 billion | 0,60% |
| P.G.J. | Invesco Golden Dragon China ETF | 0.20 billion | 0,70% |
| ECNS | iShares MSCI China Small-Cap ETF | 0.05 billion | 0,59% |
| FXCN | FinEx China UCITS ETF | 0.04 billion | 0,90% |
Note : the table does not include sectoral funds and actively managed funds
BlackRock (iShares) has the largest selection of Chinese stock ETFs.
It is easy to see that FXCN is inferior to other funds in terms of capitalization and has the highest commissions. But FXCN has an important advantage. When purchasing FXCN, Russian investors have access to tax benefits for long-term ownership (more than 3 years) or when purchasing through an individual investment account.
CNYA has a very short history (3+ years). Therefore, we will not consider its indicators. FXCN is not represented for the same reason. But in terms of indicators, it is identical to GXC and MCHI (up to the size of the commissions).
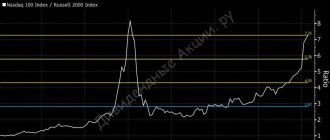
The image of the accumulated income clearly shows that the leader in the long term (9 years) was the Invesco Golden Dragon China ETF (PGJ). He was also a leader at many other periods of time. The outsider is ECNS, a small-cap fund.
| Characteristic | Period | iShares MSCI China Small-Cap ETF | iShares Trust - iShares China Large-Cap ETF | SPDR S&P China ETF | iShares MSCI China ETF | Invesco Golden Dragon China ETF | Inflation (USA) |
| Cumulative return | year to date | 8,15% | -2,93% | 16,38% | 16,16% | 27,04% | 1,29% |
| Average annual return | 1 years | 15,82% | 8,42% | 33,44% | 33,99% | 48,38% | 1,38% |
| Average annual return | 3 years | -1,27% | 1,13% | 7,06% | 7,18% | 7,55% | 1,79% |
| Average annual return | 5 years | 5,08% | 6,25% | 13,78% | 12,91% | 16,57% | 1,81% |
| Average annual return | 9.4 years | 1,10% | 1,87% | 6,40% | 5,89% | 8,26% | 1,62% |
| Dividend yield | 12 months | 2,75% | 2,67% | 1,17% | 1,09% | 0,21% | |
| Standard deviation | 9.4 years | 24,96% | 22,28% | 23,22% | 22,76% | 27,56% | |
| CVAR | 9.4 years | 16,02% | 12,88% | 13,32% | 12,93% | 14,78% | |
| Maximum drawdown | 9.4 years | -41,34% | -39,41% | -33,24% | -37,33% | -39,11% | |
| Maximum drawdown date | 9.4 years | 2011-09 | 2016-02 | 2016-02 | 2016-02 | 2012-07 | |
| date of creation | 2010-10 | 2004-11 | 2007-04 | 2011-04 | 2005-01 |
A special feature of PGJ is an index that consists only of shares of Chinese companies listed on the American stock market. In our opinion, this is the main reason for PGJ's more successful performance. Only the most competitive companies are listed in the US. In addition, Chinese companies are known throughout the world for their penchant for financial reporting manipulation. Financial reporting regulations in the US are much stricter than in China. Therefore, companies listed on the NYSE or NASDAQ behave more sustainably. Features of national financial reporting may also explain the weak performance of ECNS, which consists of small-cap stocks. If large companies in China often fudge numbers, what about small businesses? On the other hand, the weak results may also be explained by the tendency of the Chinese market to monopolize. In any case, ECNS is clearly not the best candidate for the portfolio yet.
Correlation of Chinese funds
The correlation was calculated for historical data over a period of 13 years (since 2007).
FXI, MCHI, GXC and FXCN are more than 90% correlated with each other and it’s clear why. The indices are quite similar to each other. ECNX and PGJ have a lower correlation, but also not very interesting - about 80%. Therefore, these assets do not appear in the correlation matrix to save space. Correlation information is presented for the most popular types of US and Russian funds that are used in investment portfolios:
- Chinese stocks (FXI)
- US stocks (SPY)
- US Bonds (BND)
- Shares of Russian companies (MCFTR)
- Russian bonds (RGBITR)
- Gold (GLD)
It is easy to see that Chinese stocks show a fairly low correlation with all other assets considered. The lowest correlation is with US bonds – 0.12.
Summarize
Despite the youth of the PRC stock system, its instability and the presence of restrictions for foreign participants, the development of China's stock exchanges is proceeding at a rapid pace. This is facilitated by the gradual liberalization of the country’s financial policy and its confident position in the export sector. The trade war with the United States, political conflicts and the coronavirus epidemic have weakened China’s position, but will not significantly slow down the implementation of its plans. Looking at the largest companies in China, we can confidently conclude that the development of state-owned and private manufacturing and service enterprises is moving at a strong pace.