To assess the effectiveness of investments, you must know what kind of return they will bring (or have brought). What if there are a lot of such investments? They need to be compared somehow. To understand what was more profitable. And in general, how can you calculate the profitability of a portfolio with various investments (bank deposits, bonds, stocks, etc.). For different amounts and different periods?
For example, which is more profitable? Invest 57 thousand for 3 months and earn 3 thousand. Or invest 75,000 for eight months and get 5,500?
How to find out the percentage of effective return on a portfolio if there were constant withdrawals and deposits of funds throughout the year?
So, let's go!
How to calculate profitability?
Why most investors often have a misconception about what the real performance of their investments is.
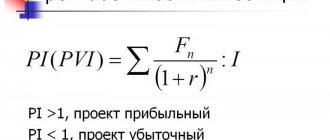
The difficulty is that most approaches to calculating profitability imply a simple formula:
$$ R =\frac{A}{B}$$
A – income received
B – starting investments
Let's imagine a life situation when a person invested 10,000 rubles in January, and 90,000 rubles in December. By the end of the year, there were 110,000 rubles in the investment account (securities increased in price). What is the return on investment? What to divide by what? If we take an income of 10,000 rubles and divide it by the sum of all investments - 100,000 rubles, we will get a very difficult to interpret result - 10%. After all, for most of the period there was only 10,000 rubles in the account, and the balance was added only a month before the end of the year...
Or an even more interesting example. In January, the investor deposited RUB 100,000 into a brokerage account, and in December withdrew RUB 90,000 from it. By the end of the year, the brokerage account contained an amount of 15,000 rubles. If you simply add up the additions and withdrawals, it turns out that the total investment is equal to 100,000 - 90,000 = 10,000 rubles. Dividing income by total investment, we get an overly optimistic 50%. Obviously, this cannot be done...
For more information on the topic of calculating profitability without additions and withdrawals, read the article: Correct calculation of average annual profitability in investments
Essence
The concept of the economic essence of the case is very significant for the investor, since it means giving the compilation of the stock assets included in the pool certain market indicators that do not work separately, only together.
Main objectives of the asset case:
- Guarantee a stable, specified level of income ;
- Minimize or maintain risk at a certain level;
- Solve problematic specific investment problems ;
- Significantly reduce or completely eliminate transaction costs .
Based on the type of income the asset pool is targeting, the latter often ends up being either a growth or income portfolio and a combination. A growth portfolio is formed by securities whose market prices are almost constantly growing. The purpose of this pool is to increase the total investment of an investor who has seen benefits in investment projects with income from purchased securities.
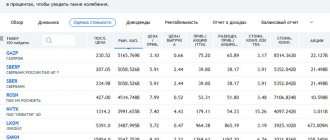
Investors who prefer a growth case are interested in buying shares of Tesla Motors, AMD, Google and other companies included in the NASDAQ Composite ( IXIC ).
Along with this, investors following an aggressive strategy are interested in assets from the energy and healthcare industries. Among my colleagues, there are investors who put money into biotech companies with high volatility , the prices of which vary from 4 to 7 percent per day .
IRR or Internal Rate of Return (IRR)
One of the simplest and most common ways to measure investment performance is to calculate IRR (Internal Rate of Return). IRR is not exactly profitability. Formally, IRR or is the interest rate at which the present value of cash receipts (write-offs) is equal to the size of the original investment. IRR is very common in business and finance. Using this value, for example, the profitability of business projects is calculated. The yield to maturity for bonds is calculated similarly IRR can be considered a kind of standard when measuring performance.
Another important advantage is that IRR is easily calculated in EXCEL and other spreadsheets.
If the IRR is less than the rate on deposits at Sberbank, then you need to think about whether everything is okay with the investment strategy.
Results
That’s all for today, dear friends, it seems like I haven’t missed anything. Please subscribe to my blog, read articles, reviews, reports on investments and financial freedom , which I think everyone should strive for. If there is anything you didn’t like or was unclear, please point it out in the comments, and I will definitely answer your question in the most comprehensive way.
If you find an error in the text, please select a piece of text and press Ctrl+Enter. Thanks for helping my blog get better!
Template for calculating IRR of investments in EXCEL
To quickly calculate the effectiveness of investments, we offer a simple template in EXCEL.
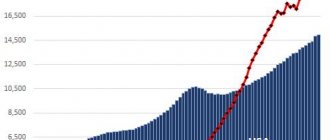
The template calculates IRR for each investment period, and for the last 6 periods (column “IRR for 6 periods”). The periods can be arbitrary: one month, one year. Moreover, the calculator uses the XIRR function, which can calculate IRR even for unequal periods. This means that in the “Date” column you can indicate any date, and not just the beginning of the month or, for example, the end of the year. It is most convenient to enter new data every time the portfolio is replenished or when funds are withdrawn. For interest, you can enter new data more often, even when there are no additions to your portfolio. For example, you can indicate dates when some significant changes occur in the portfolio size or simply with some specified regularity.
In addition to the IRR of the investment portfolio, in the template you can see the overall growth of the portfolio (how much the size of the portfolio differs from the volume of invested funds).
Download the portfolio performance calculator in EXCEL format
General concepts
A portfolio of securities is usually called a set of assets in the use of an individual or legal entity.
Main characteristics
- Number and total cost;
- Liquidity level;
- Potential risks;
- Types, categories.
Kinds
Depending on the direction, two types of portfolios : emission and investment in nature . An emission portfolio is a collection of shares or other assets issued by a given issuer.
An investment portfolio, as noted above, is considered to be a pool of assets used by an investor - a person who has invested capital in securities - for the purpose of earning money .
Accounting for investment results for complex portfolios
An important feature of the calculator is its ability to measure investment performance for widely diversified portfolios. There are often situations when an investor has several brokerage accounts (Russian and foreign), part of the money is placed in mutual funds through the Management Company. In addition, compulsory medical insurance (Impersonal metal accounts - used to purchase precious metals) can be opened, real estate can be purchased, and the like. In this case, calculating the investment result for the final portfolio can be quite problematic... The proposed calculator will help you cope with this task. It is enough to regularly (for example, once a year) calculate the total amount of all assets in the portfolio and enter additions and withdrawals into the table.
Structure
When creating a case, an investor needs to understand that he is selecting financial instruments of a certain yield. The approach to choosing stocks is purely individual , so it is very difficult to say unequivocally which pool is better and which is worse. Investing in shares of one investor differs significantly from the investment approach of another entrepreneur, because Everyone has their own investment goals
When I started working in the stock market, I was guided by the criteria of profitability, risk, period of holding a position, and individual preferences. Over time, I realized that constructing a high-performing portfolio is the result of a painstaking effort, which consists of finding a company that has fallen in value and has good earnings records, and also has a capitalization above $400 million, and then finding a more accurate entry point for the acquisition. companies for growth, that is, opening a long position. In order not to repeat the mistakes of others, always ask yourself the question, what result do you want to achieve?
Having answered this question for yourself, determine the risk threshold , set the amount of working capital for investment. I repeat: each investor is purely individual, chooses his own path and strategy, and is guided by criteria that apply exclusively to him. Despite this, investors are united by the important quality of dividing the case into component parts, each responsible for its own task. The list of components for investors is almost the same; exceptions here are rare.
Calculation of yield to maturity for bonds
Although this is not the main function of the calculator, it can be used quite simply to calculate the yield to maturity for bonds. The yield to maturity for bonds is defined precisely as the IRR of the entire cash flow.
To calculate the yield to maturity, it is necessary to enter the bond purchase amount and planned income in the form of dividends.
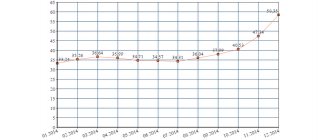
The example shows the yield to maturity forecast for a bond with a coupon of 40 rubles (twice a year) and a current value of 98% (980 rubles) and maturity in 2024. The bond is assumed to be held until maturity. In this case, only the last IRR value (at the time of maturity) is relevant, since it is very difficult to predict changes in the bond price. IRR over 6 periods doesn't make much sense for bonds either.
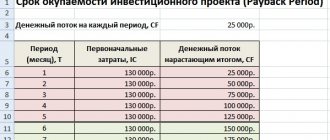
What is the discounted payback period of DPP
An investor, investing money in a project, assumes that it will pay off. The period of time during which the invested capital can be returned to the investor in full is called the payback period.
It can be defined by two methods:
- Simple. It involves finding the difference between the funds that were actually received from the implementation of the project and the money that was spent to start the project. In fact, the period is determined when the received income will exceed the actual income.
- Discounted. The calculation must take into account the change in the value of funds taking into account various factors. This could be inflation, exchange rates, some features of economic development, financial stability, etc.
Using a discounted payback period allows you to more effectively assess the feasibility of capital investments, taking into account all kinds of influencing factors.
If, when predicting profitability, you do not take into account inflation processes and currency exchange rate fluctuations, then you may not correctly assess the economic feasibility of investments.
Differences between discounted and simple payback periods
In practice, experts use both simple and dynamic payback periods. Both indicators do not give an accurate result, since it is impossible to take into account all influencing factors as accurately as possible. For example, the discount factor is taken to evaluate on average, just like the cash inflow by year is a rather subjective criterion.
The main differences between the two methods:
- The traditional option can be rationally used for short-term projects in a stable economic situation. A complex calculation option is necessarily used for long-term investments, when it is necessary to accurately and effectively assess risks.
- The simple method does not take into account inflation risks and additional influencing factors, and therefore does not provide an accurate forecast. The differentiated methodology takes into account the economic prerequisites for development and additional risks.
Taking into account such advantages, one might get the impression that the complex version of assessment is now widely used.
But that's not true
Many experts believe that in the future it is impossible to accurately and adequately assess inflation, and therefore there is no point in using a discount. There are supporters of both one and the other method. The choice of method is influenced by many factors, as well as the experience and expertise of the analyst.