- home
- >
- Forex
Chaikin Oscillator _
) was developed by trader Marc Chaikin
and
is an indicator of the moment of the Accumulation Distribution Line (
ADL
).
In other words, it is an indicator of an indicator. In the classic case, it is the difference between the 3 and 10 day exponential moving average ( EMA
) of the accumulation-distribution line. Its application in market analysis mainly comes down to predicting changes in the direction of the accumulation-distribution line, which usually precedes a change in trend direction. In addition, the Chaikin oscillator generates signals based on the intersection of the so-called zero line and bullish or bearish divergence.
Definition and formula
The Chaikin indicator is an oscillator that shows the development cycles of cryptocurrency prices. It was developed by famous trader Marc Chaikin. The concept of using this indicator is based on 3 rules:
- If a cryptocurrency or other asset closes above the average price of the day (half the sum of the maximum and minimum value for that day), this indicates accumulation, i.e., cash flow (investments of market participants) goes into the asset. And the closer the price closes to the maximum value reached for that day, the faster the accumulation went.
- If a cryptocurrency closes below the average line, then, on the contrary, there is a distribution. The closer the price eventually closed to the minimum value, the more intense this process was.
- If an asset grows steadily throughout the day (or other period), this indicates that the volume of investments in it is also growing, as well as vice versa. If growth is strong enough, investors are confident in their investment. But if there is a sharp drop, this indicates “panic” selling. They will continue until the price stabilizes and goes up again - then another accumulation will begin.
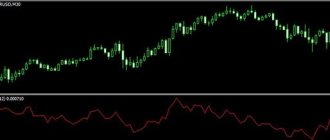
Thus, the description of the concept is associated with 2 situations: cash flow (investors’ investments) can go into or out of an asset. In the first case, there is a steady growth of the cryptocurrency, in the second there is an equally confident drop in price. The Chaikin oscillator allows you to graphically determine in which case this or that situation will occur:
- If it is above the zero line (green), this indicates that market participants are confidently investing in the asset (buying it), but a price reversal is expected in the future.
- If the indicator, on the contrary, lies in the lower zone, this means that the cash flow is coming from the asset - accordingly, you should expect a price increase.
The indicator calculation takes place in 4 stages. The first of them determines the cash flow multiplier (MFM), which is also called the Chaikin cash flow. This is a conditional value, which represents the following ratio:
Here:
- Сt is the price at which the candle closed at a specific point in time t;
- Ht is the maximum price value at the same moment t;
- Lt – minimum price value at time t.
At the second stage, the volume of cash flow is calculated:
here Vt is the trading volume at time t.
At the third stage, the lines of distribution and accumulation of ADL at moment t are determined:
Based on this, the value of the Chaikin oscillator (CO) is calculated:
It is determined on the basis of 2 exponential moving averages EMA - one with a period of 3, the other - 10. In the classic version, prices are calculated for 3 days and 10 days, respectively, but these parameters can be changed at the discretion of the trader, depending on the features of his strategy.
Example 1
There is a positive divergence on the daily chart of Alcoa shares. Subsequently, a divergence signaling a change in trend confirms the entry of a long position.
Another situation for a buy signal is when the line crosses the zero mark from bottom to top.
Rules of application: entry signals
The indicator can be used mainly in a trending market with fairly high volatility, since in this case the pattern works quite well. In the case of a flat (sideways) movement, the oscillator will give quite a lot of false signals. Therefore, at such moments it is better not to trade.
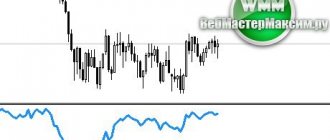
Crossing the zero line
The main signal is the crossing of the zero line:
- Crossing from bottom to top – buy BUY.
- Crossing from top to bottom – SELL.
From this figure it can be seen that quite a lot of false signals arise, since during the day a cryptocurrency can make a large number of rises, pullbacks and other waves. Therefore, it makes sense to increase the period of the oscillator - for example, by 2 times (instead of the default settings of 3 and 10, respectively, 6 and 20). Then we get this picture:
It is obvious that the accuracy of the signals has increased, although their total number has decreased. To confirm the forecast, you can use additional signs - for example, divergence.
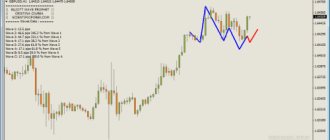
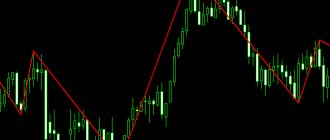
Divergence
Divergence is a fairly powerful trading signal that is typical for all oscillators. It represents the discrepancy between the indicator reading and the actual price movement - for example:
- The indicator line goes up and makes 2 successively increasing minimums, and the asset, on the contrary, makes 2 successively decreasing minimums.
- The indicator line begins to gradually fall and makes 2 successively decreasing maximums. In this case, the asset, on the contrary, makes 2 successively increasing maximums.
As you can see in the figures, divergence allows you to predict a reversal of the current trend. Moreover, in some cases, the reversal occurs relative to the rollback. For example, in the top figure you can see that a general upward trend is developing.
Then the price falls for a while, but the Chaikin oscillator shows divergence. Therefore, as a result, we can count on a reversal of the trend relative to the rollback, i.e., a continuation of the current upward trend.
Note! In both cases, it is advisable to wait for confirmation of the signals - the indicator crossing the zero line. If a downward trend emerges, it crosses it from top to bottom, and an upward trend – from bottom to top.
Setting stop-loss and take-profit
Setting these levels is usually done according to the classical rules:
- Stop loss is fixed at the maximum or minimum that the price formed shortly before the opening of the transaction. As a rule, it is better to carry it out with a small margin, so that the total risk of possible loss is no more than 2-3% of the deposit amount.
- Profit can be taken at the moment when the oscillator generates an opposite signal. For example, if an uptrend was developing, the Chaikin indicator crossed the zero line from bottom to top. As soon as there is a reversal, you can close the order.
Expiration
Like money management, this is one of the main concepts in trading. Expiration (from the English Expiration, “expiration, end”) - the deadline for the end of the transaction, when trading participants learn the results of the forecasts, and, accordingly, funds will arrive in their account. By working with expiration correctly, you can improve your performance several times. Conversely, not paying attention to it will reduce your chances of being productive. To ensure that your options trading brings a stable income, work with expiration consciously.
Types of options:
- Ultra-short options (express) - 60 seconds - 5 minutes.
- Short-term options – 15 minutes – several hours.
- Medium-term options – from 6 hours to a day.
- Long-term options – one day – several months.
Is it possible to extend the expiration of options?
You can extend the expiration if suddenly during trading you realize that your forecast was incorrect. Please remember that not all brokers allow this.
Expiration rules:
1. If you are just starting to work in binary options, we recommend using long terms of transactions. Such expiration will allow you to minimize the risks of express expiration. 2. If you are thinking about reducing risks, choose your broker carefully. We recommend working in a terminal where an increase in the expiration period is allowed. This will prevent you from losing money if you realize that you made an incorrect forecast of market dynamics. 3. If you are thinking about how to get quick income, we recommend using short-term (minute - several hours) expiration. Such an expiration can give you earnings literally in a minute, but remember that express expiration is reminiscent of a lottery due to the unpredictability of the outcome. 4. If you are thinking about how to get a stable profit, we recommend using long-term expiration. This choice will help you take a high-quality approach to predicting transactions and get a decent income.
Expiration in strategies with CHO
Strategy when crossing the signal line
Short-term trading : allowed; Due to unpredictable results, it resembles a lottery. Recommended expiration : from 30 minutes to several hours; During this time, you will be able to analyze market opportunities, look at indicator signals and place a bet. Long-term expiration : also recommended; you will be able to use not only technical analysis, but also connect macroeconomic data (news, economics, politics) to your work.
Strategy for divergence and convergence
Short-term trading : allowed; when using additional indicators it will bring good income. Recommended expiration : from 5 minutes to 30 minutes; you will have time to observe the dynamics of the trend and market mood, study the signals of oscillators. Long-term expiration : also recommended; you will be able to use advanced capabilities to make the right decision: strategies, oscillators, external situations affecting market dynamics: news, economics.
Strategy “CHO + Stochastic”
A simple strategy, the signals of which, thanks to Stochastic, are high-quality and profitable. The strategy requires Stochastic and the Chaikin indicator. A trend reversal signal will be a reversal and intersection of the fast Stochastic lines, which coincide with the CHO reversal, which should also be confirmed by the slow Stochastic.
Short-term trading : not recommended; resembles a lottery, so be careful when making decisions. Recommended expiration : from 1 hour to several hours; So, you will be able to understand the dynamics of the market, use technical analysis, and study the behavior of oscillators. Long-term expiration : recommended; in this case, you will be able to receive high-quality signals and their confirmation from oscillators, connect all your experience and be able to make good money.
Strategy “CHO + Bollinger Bands”
The Chaikin indicator is commonly used with other trading instruments. This strategy, which requires CHO oscillators and Bollinger Bands, will provide high-quality trend confirmation signals. The main source of decision making is Bollinger Bands, CHO serves as support to confirm the strength of the trend.
Short-term trading : not recommended; The results resemble a lottery, be careful when making decisions. Recommended expiration : from 1 hour to several hours; So, you will be able to understand the dynamics of the market, use technical analysis, study signals and the behavior of oscillators. Long-term expiration : recommended; in this case, you will receive high-quality signals and their confirmation from oscillators, you will be able to use all your experience for the right decision and earn money.
You can get acquainted with all the expiration options; for this we recommend using the platform of the trusted broker Finmax by going to finmaxbo.com. The advantage of the platform is that you have a choice of expiration from 30 seconds to six months. The platform is convenient and intuitive, here you can get the most from options trading.
How to install an indicator in the terminal
The Chaikin indicator can be found in any version of the terminal - MT4 and MT5, as well as on many broker platforms (demo and real trading accounts). To install it on your desktop, you need to open the program. The further sequence of actions is as follows:
- Go to the “Insert” section.
- Then to "Indicators".
- Select "Oscillators".
- After that add “Chaikin Oscillator”.
The oscillator can also be added to a live chart. To do this you need:
- Click on the icon to add an indicator.
- Select it from the list.
- Add to screen.
It is also possible to download the indicator online. To add it to the terminal, you need to copy the resulting file and paste it into the “Indicators” folder. To do this, the user opens the terminal, goes to the “File” menu section, then “Open data directory”. After this, you need to select “MQL4” or “MQL5” and find the desired folder there.
Note! The default oscillator settings are 3 and 10. But it is best to double them to 6 and 20, respectively. After this, you need to test the accuracy of the signals on a demo account in order to develop a clear strategy.
Trading strategies based on the Chaikin oscillator
Almost no indicator is used separately, since there is no universal way to analyze the market. Therefore, the Chaikin indicator is in most cases used together with other instruments.
These can be not only indicators, but also important price support/resistance levels. In the case of news trading, it is important to take into account the latest publications - for example, on US oil reserves, unemployment rates, etc.
Chaikin indicator + MA
To determine the trend and price location, moving averages MA are often used, and the longer their period, the more accurate the incoming signals. For example, if you use a line with a period of 100, you can determine a fairly long trend that will develop over the next few hours or even days.
You can apply a trading strategy like this:
- Signal to buy BUY: the candles have broken through the MA from bottom to top, the Chaikin indicator has reached the bottom and turned upward or has already crossed the zero line in the upward direction.
- Signal to sell SELL: the candles have broken through the MA from top to bottom, the Chaikin indicator has reached a peak and is also turning down or has already crossed the zero line in a downward direction.
Note! An additional signal confirming the forecast - the candles tried to test the support or resistance level 2-3 times (or more), but were unable to break through it - the price returned and followed the trend.
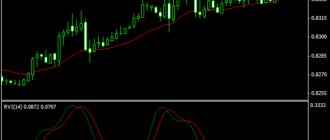
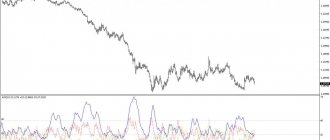
Chaikin indicator + Stochastic
Another well-known oscillator is Stochastic. When adding, it is better to replace the basic settings with longer periods - for example, instead of 5, 3, 3, respectively, 25, 15, 15. Then the signals will become more accurate. The entry rules are as follows:
- Buy BUY: the oscillator has crossed the zero line from bottom to top, stochastic is leaving the lower zone.
- Selling SELL: the oscillator crosses the zero line from top to bottom, the stochastic leaves the upper zone.
As you can see, oscillators can give signals at different times, which is normal. The trader just needs to wait for confirmation and open an order.
Read more in our material: Stochastic indicator - settings and strategies for trading.
Important! Instead of Stochastic, you can use any other oscillator - for example, the popular indicators MACD, RSI, AO, etc. The rules of the strategy will be exactly the same. You can also look at divergence signals using them.
Chain indicator + Bollinger Bands
You can find the Bollinger Bands indicator in the “Trend” category. It is often used in various trading systems, including oscillators. The rules of the strategy are quite simple:
- Buy BUY: candles touched the lower border of the channel 1 or several times, the oscillator crosses the zero line from bottom to top.
- Selling SELL: candles touched the upper border of the channel 1 or several times, the oscillator crosses the zero line from top to bottom.
Thus, the Chaikin oscillator gives fairly accurate entry signals, but only in a trending market and provided that its basic period settings are increased by at least 2 times.
It is advisable to use the indicator together with other tools, including focusing on important price levels. Then the trading strategy will give the best results.
Money management
Despite the fact that the concept of money management is better known to professional traders who are thinking about generating a stable income, options beginners are also recommended to use its basics as early as possible. Money management is an effective strategy for managing a personal account, which helps solve such important issues as competently working with a deposit, preserving and increasing funds on it, and a strategy for reducing losses on the account. The basic rules of money management will make trading effective and, importantly, profitable:
Trade with a minimum of funds : spend a minimum of money on trading; bet on the option about 5% of the amount in the account; participate in lots whose cost is less than the amount of funds in your account; choose a broker that guarantees the best result. These provisions will help you maintain funds on deposit.
Transfer a minimum amount of funds to a deposit : work with minimum amounts; do not put all your capital on an option; Determine for yourself the amount of free limit that you can spend on trading and do not go beyond it. These provisions will help preserve your capital.
Trade with a minimum of assets : start trading with 2-3 assets; only when you get comfortable with the system, increase the number of assets; the more assets you use, the greater the load on the deposit, the more difficult it is to track the status of the deposit. These provisions will help you organize your work effectively and make a good profit.
Trade without emotions : the most important thing in trading is the mood; any excessive emotions interfere with concentration, which will affect the outcome of the auction; treat trading as a serious job where you will need analytics and informed decisions; Always remember the risks. These provisions will teach you to build a conscious attitude towards trading.