Technical Summary - Widget from Investing.com Russia.
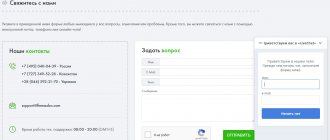
Online economic calendar from Investing.com Russia, a leading financial portal
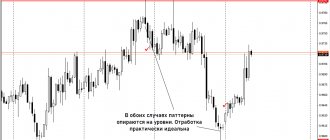
Twice a year WF holds a landmark competition for Binguru. For many years now, our guys have been frolicking there for the sake of bravery and significant prizes.
This is not for you to press a button on a live chart.
Register: CASH WARS 2021: competition for traders on demo accounts from WForex
How to participate wisely, read the article How to win a trading competition.
Live Chart: Tools
The first is the live chart itself; detailed instructions for using it are at the bottom of the page, under the video. The dots on the chart are the ideas of all traders who use the full version of the chart. This way you can “consult” with your colleagues in absentia. Green dots are popular ideas for price increases. Red ones are for decline. Yellow - special ideas, without pronounced movement. If the dots are bothering you, just click on the light bulb icon.
Like the markets themselves, live charts and tables operate Monday through Friday.
On weekends, when there is no trading, you can work with rand and crypto indices from Binary and Intrade.
Economic news
Below the live chart on the right is a table of economic news. News with 3 "heads" always affects the market, be very careful with them. The table presents actual data (Actual) , previous (Prev.) and Forecast .
If the forecast diverges greatly from the actual data when news comes out, the market often explodes with a strong reaction. You can trade it, but it’s wiser to skip it and enter a little later, when passions have subsided. You can read more about this in the Schools website.
Technical signals
To the left of the news there is a table of technical signals. It is a mechanical system based on 20 indicators that indicates the direction of the market. Accordingly, the instructions Actively Buy and Actively Sell indicate trends - upward (hence the recommendation to buy) and downward. The table allows you not to litter the chart with similar indicators, because it will show the direction of the market anyway.
Community Outlook
The latest table (Community Outlook) allows you to study what the retail market is currently inclined to do (data aggregated from almost 60 brokers). Let’s say, if 85-90% of the market bets on EURUSD, it is quite possible to expect a reversal, because this is the basis of market dynamics - if there are all buyers (even in the retail segment), then there are no sellers and vice versa.
It also allows you to enter against the crowd and use a variety of related strategies. By hovering your mouse over the desired asset, you will see the overall market sentiment as a percentage, or you can evaluate it directly using the color indicator. Short (short) are transactions for a decrease in price, Long (long) - for its growth. Columns Avg. Short (Long) Price - where the crowd thinks the price will go from its current value (indicated in the Current Price column).
Basics of working with a live schedule
Advanced version of live chart
Brief characteristics of widgets
At the top of the page you saw several information and analytical tools of the live chart:
- in the upper part there is the graph itself, we will talk about it below;
- below is a creeping line displaying tickers, quotes and price changes of the main trading assets;
- Below the ticker is a standard economic calendar. There is a set of filters; you can configure the display of only “strong news” for the desired countries;
- under the economic calendar there is a window with technical analysis and trading recommendations. The analysis is performed based on a set of indicators, recommendations range from “Active Sell” to “Active Buy”;
- under technical analysis there is a screener window, it displays information in percentage terms on the change in the currency pair, this can be used in trading;
- Below is the Community Outlook table, the information is broadcast from myfxbook.com. This table shows the opinion of the “crowd”; data is taken from several dozen of the largest brokers. The table shows the ratio of sellers and buyers, and in the columns Avg. Short and Avg. Long – levels to which, according to traders, the chart will reach.
The live chart for binary options and forex contains auxiliary tools , none of which provide reasons for immediate entry into the market.
Corporate US market
A corporate bond is a bond issued by corporations (legal entities) to finance their activities. The purposes of the collected funds can be varied: from modernizing production to refinancing previous debt.
The security of this security lies in the fact that the issuer who issued it retains complete control over the company, which provides additional confidence that interest and principal will be repaid at maturity.
Several obvious advantages of corporate bonds:
- some are almost as safe as bank deposits;
- return on interest payments and discounts may significantly exceed income on deposits;
- the high liquidity of these assets allows them to be sold on the secondary market at any time;
- predictability of interest income and terms.
On May 16, 2021, Federal Farm Credit Banks issued a 3.04% 4-year bond. The company has the highest reliability rating because... is federal.
And not so long ago, Apple issued 30-year bonds with a yield of 4%. These bonds are considered riskier because... placed for a long period of time and there is no confidence that nothing will happen to the company during this time.
Settings and types of charts
Live Chart supports all possible chart types:
- bars;
- regular Japanese candles and Hollow candles (empty candles). Hollod candles differ from ordinary ones only in that the bodies of the candles are not filled with color;
- Heikin Ashi is a specific type of candles, the influence of price noise is reduced. In MetaTrader, for example, this type of chart is not included in the list of standard ones;
- line and zone – pricing information is shown as a line. The zone is different in that the space under the line is filled with color;
- baseline – a regular line chart, but the trader can change the position of the horizontal level himself. The price chart will be colored red or green depending on where the line chart is located relative to the line. The graph isn't particularly helpful;
- Kagi – a rarely used chart type. Looks like a continuous line consisting of vertical and horizontal segments;
- line break – an exotic type, the time factor is excluded in its calculation. A bit reminiscent of Renko, there are no shadows on the “bricks”;
- renko – unlike a linear breakthrough, the size of the bricks is the same. When calculating, the factor of time and volume is excluded;
- tic-tac-toe. This type of chart is rarely used, looks unusual, and is practically not used when working with binary options;
- range. It was added on June 21, 2021, and eliminated the time factor 100%. In some of the types described above, the influence of the time factor is reduced, but not completely eliminated; here, time is not taken into account in the calculations. In range charts, the constructions are affected only by changes in the price of the asset. For range there is no such thing as a timeframe; instead, the range multiplier is selected in the terminal settings. This is exotic and rarely used by traders.
Timeframes in live chart from Trading View
There are many more of them compared to conventional trading terminals. In addition to standard time intervals, a trader can independently add the ones he needs (both in minutes, hours, and in ranges).
In addition to standard time intervals, second intervals are available; you can work with candles corresponding to 5-15 seconds. This increases the importance of a live chart for binary options; for turbo options with expirations of 1-2 minutes, second candles may be needed.
To add the desired custom timeframe, you need to select a time unit at the bottom of the list of time intervals and set your own timeframe. You can make, for example, 18-minute or 7-hour candles.
Both options are available only to registered traders with Pro status. Access to all charting features from Trading View is paid, but this is not a problem. The developers provide free access for a month - this is enough to test the live chart in order to use it in the future on binary options and Forex.
Municipal
Securities issued by city and local governments in the form of loans against municipal property to finance projects. The government of states and large cities issues such bonds.
The yield on these bonds is believed to be 1-2% higher than Treasury yields. They also have a high reliability rating. Despite the recent recession, the US has maintained better employment than, for example, Europe. It is this factor that shows the creditworthiness of municipalities.
Selecting the right tool
Trading View supports hundreds of financial instruments - currency pairs, stocks, futures for oil, gas and other commodity market instruments, CFDs, indices. For convenience, all tools are divided into categories.
For each instrument, not only its full name is shown, but also its ticker, as well as the source where the information comes from. Shares of the same company can be traded on different platforms, you can choose the one you need.
In the “All Exchanges” section, you can limit the search for the desired asset to a specific exchange. Trading View supports several dozen stock exchanges, the largest Forex brokers, and cryptocurrency exchanges.
Who can use TradingView?
TradingView is right for you if:
- You have a sufficient deposit amount.
- You trade on different markets at the same time.
- Are you a swing trader or position trader?
You have a sufficient deposit amount
Then an annual subscription to the TradingView platform will be a great investment for you. But to do this, you will need to have a deposit of at least $5,000. Then the subscription will cost you only a few percent per annum.
You trade on different markets at the same time
TradingView provides charts and tools for forex, stocks, futures, indices, and more.
So if you trade many markets, TradingView will make your life a lot easier because you now only need one platform to analyze your charts.
Are you a swing trader or position trader?
Swing traders and position traders rely primarily on technical analysis to make trading decisions. And TradingView offers one of the best charting and technical analysis platforms on the market. TradingView is also quite suitable for intraday traders.
Set of indicators
This is one of the main features of online live charting for binary options. Usually in online terminals the choice is limited to 10-20 standard indicators (moving averages, a pair of oscillators, Bollinger bands). In Trading View, the number of indicators is in the dozens.
For convenience, all indicators are divided into 5 categories:
- Built-ins – standard, time-tested indicators. These are algorithms built-in by developers, among them there are standard (Stochastic, relative strength index, moving averages) and custom ones;
- Candlestick Pattern s – a new category, this includes tools that make it easier to find candlestick patterns on the chart;
- Public Library is the most interesting section; all indicators created by traders themselves flock here. In addition to the name, the number of likes is displayed opposite each of the algorithms; you can evaluate the popularity of the indicator in the trading environment;
- My Scripts – trader’s scripts; algorithms created by the trader himself are saved here;
- Volume Profile – volume indicators that require Pro status to work.
There is no need to study the entire list of indicators. In the search bar, you can start typing its name and the search will automatically return a list of tools whose names match the entered query.
I also recommend reading:
What are bond funds? Types and profitability
Some investors prefer a gradual increase in savings rather than explosive capital growth (with possible risks of falling portfolio value). For them […]
How can a Russian buy?
Investments in US bonds are not at all highly profitable, but they are very liquid and reliable. In order to be able to buy them, you first need to open a brokerage account. At the same time, the service of buying bonds of another country is a completely non-trivial task, which is why most Russian brokers do not do this.
When choosing a broker that provides access to Western financial markets, it is necessary that he has the appropriate license and FCA regulation. Moreover, a serious broker will not be registered in the Cayman Islands, Cyprus or Russia. Although we have several large brokers (FINAM, BCS), it will be difficult to work with them in Western markets due to weak legal regulation and a long chain of branches from Russia to the USA.
Therefore, it is better to consider Western companies, for example, Interactive Brokers (IB) - this is one of the most popular and largest US brokers, which provides access to global financial markets.
1. Why do you need a broker:
- Maintaining records of funds transferred by the investor;
- Without it, it is impossible to register on the exchange and receive special codes;
- Provides information on the progress of trading;
- Sells and buys what you think is necessary;
- Makes settlements on transactions - transfers money and securities;
- Provides all information on cash flows and transactions in the form of reports;
- Issues the necessary certificates: on the purchase of securities, on the payment of taxes;
- Withholds and transfers taxes on profits and dividends to the state.
2. We conclude an agreement for brokerage and depository services. These services are required and go together.
3. The broker opens an account in his accounting system and registers it on the exchange. After you have received a notification about opening an account, you can transfer money to the broker.
After these short procedures, we install the software (it will be provided by the broker) - a trading terminal for working via the Internet. But for some establishments, trading can take place through the website.
IMPORTANT! Before making real trades, practice on a demo account. Its peculiarity is that all movements on the stock exchange are displayed in real time, and the money there is “training”. If you make a mistake on such an account, you will not incur losses.
The broker will provide reports for review at the end of each trading day, if transactions have been made.
Another important point is withdrawing money from a brokerage account. You can withdraw them all, but not immediately after completing the transaction, because... The exchange takes 2-3 days to transfer funds.
Graphical analysis on a live chart
Trading View offers dozens of tools that facilitate chart analysis for successful trading of binary options and more; in this regard, the online live chart is head and shoulders above MT4 and other desktop terminals from binary options brokers. The menu is on the left side of the terminal:
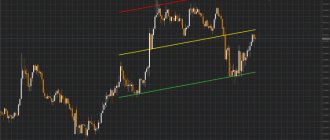
- trend line tools – everything related to the simplest constructions (levels, trend lines). There are modified versions of familiar tools, for example, in addition to the standard trend line, there is an info line. The information window shows the angle of inclination, the number of candles, and the price change during this time in points and percentages;
- Gann and Fibonacci tools – all Fibonacci and Gann instruments are available. Including such as the square, box and Gann fan, Fibonacci spiral;
- geometric shapes – a set of geometric shapes that a trader can use when marking a chart;
- text – the name speaks for itself. There are tons of different text labels;
- patterns – this group of tools does not identify patterns independently, but only helps to perform marking. If you select, for example, Head and Shoulders, then you only need to specify reference points, the pattern and neck line will be built automatically;
- prediction and measurement – a group of tools for measuring various characteristics, for example, price changes over a certain period of time;
- icons – a set of various icons.
For convenience, you can disable all graphical constructions using the combination Ctrl + Alt + H. There are other settings, for example, you can activate the Strong Magnet or Weak Magnet mode - due to this, graphical tools will be “magnetized” to OHLC prices when marking.
The plots do not disappear from the chart; if you close the browser and then open the chart of the desired instrument again, the marking will be saved. Information about elements added to the chart is stored on Trading View servers, so it does not matter which PC the user is working from.
Home area
If you have never used TradingView before, everything probably seems too unusual and inconvenient to you now. However, the platform interface can be easily customized to your taste. To do this, right-click in the main area and select “Settings...”. A new window will open where you can change all the settings:
You can customize the display of the price line, adjust the color scheme, switch from a light theme to a dark theme, etc. I highly recommend taking some time to customize the display of your charts. This is your personal trading space, so you should make it as convenient as possible for yourself.
If you want to start with a clean slate and remove all indicators and drawing tools from the chart, right-click in the main area of the chart and select “Remove all drawing tools” or “Remove all indicators”. This will remove everything from your charts except the candles.
The right-click context menu contains many functions that you will find useful. One of these functions is the “Reset Chart State” function. If you have changed the scale of your chart, you can return to the default scale as well as the current candle.
Another convenient function in the context menu is the “Add Alert” function. It allows you to create an alert based on the current price at the location where you right-clicked. A new window will open in which you can change all the settings to your liking.
As you can see, TradingView allows you to configure alerts to be sent via email or SMS.
Also with a right click you will add the current tool to your watchlist. To do this, click “Add XXX to the list of quotes.”
Non-standard live chart capabilities from Trading View
The live chart has several additional features. Not all of them you will use in trading, but you need to know about these opportunities. They will be useful not only in Forex and binary options, but also in the stock and cryptocurrency markets.
Creating synthetic graphs
Synthetic instruments are understood as instruments formed from 2 or more standard ones. Due to this, you can obtain synthetic charts that are not available in standard MetaTrader, QUIK or Ninja Trader.
Trading View's live chart allows you to perform arithmetic on standard instruments to produce synthetic charts. This can be used in trading by plotting, for example, spread charts, or expressing the value of the underlying asset in any currency.
The simplest example is that the revenue side of the Russian budget still largely depends on the price of oil. Despite the fall in the price of oil in dollars, the same fall does not occur in rubles. When oil declines, the ruble falls, which compensates for the fall in oil prices. The trading idea is to look for points where the price of oil in rubles drops to a minimum and work with the expectation that the ruble will weaken at these moments. In terminals, the price of oil is usually quoted in dollars.
Using the live chart from Trading View, you can create a synthetic BRNRUB chart (Brent oil price in rubles). To do this, BRNUSD is multiplied by USDRUB, resulting in a BRNRUB chart.
This method is useful when dealing with highly correlated assets. For example, there is a high inverse correlation between USDCHF and EURUSD, you can plot the spread and look for entry points when the chart reaches extreme values.
The only drawback is that without Pro status, only time frames D1 and older are available for synthetic charts.
Creating alerts
This is a standard option for desktop terminals, but is not always found on online platforms. A live chart for binary options and Forex allows you not only to create alerts, but also offers the most flexible settings for it. You can configure the sending of notifications for any occasion, from the price reaching a certain level to the exit or entry of the chart into the channel.
The corresponding button is located on the toolbar.
Compared to its analogues, the live chart stands out due to its abundance of settings:
- there are a lot of conditions for triggering an alert. In the form, you can select as a condition the intersection of an arbitrary level, entry and exit from a channel, change in the value of an asset by a certain percentage;
- you can select the frequency of operation – once or every time the conditions specified in the settings are met;
- The alert's lifetime and notification sending method are also set . This could be a regular sound signal, sending an email or push notification;
- You can specify arbitrary text in the Message field, and a set of special tags allows you to create any notification format.
We recommend using alerts for everyone without exception. You can use a live chart for binary options and go about your business as soon as the alert is triggered - the trader manually enters into a deal.
I also recommend reading:
TOP 5 strategies for binary options on Stochastic
The stochastic oscillator, developed by George Lane, has been in use since the middle of the last century. Along with moving averages, this is one of the first indicators […]
Comparison of graphs
In one window you can compare charts of two or more different assets. There is a “Compare/Add” button on the toolbar. If the base chart is displayed in the form of, for example, Japanese candles or bars, then all added instruments will be shown as lines of different colors.
This function is useful when working with correlated instruments or for assessing the potential of two instruments that are similar in terms of profitability. The same information can be analyzed in the form of numbers, but comparing graphs is more clear.
Social trading
Forex offers copying trades. BO brokers sometimes include a so-called “Social Radar” in their terminals. Trading View has developed a free service for trading ideas.
Any trader can create his own ideas, justify them, and they will be visible to other traders. On the graph, ideas are displayed as colored dots.
If you move the cursor to a point, the nickname of its author will appear in a pop-up window. If you click on this window, a detailed description of the trading idea will open - a ready-made script for trading.
You can compile a list of selected authors of trading ideas and use their theoretical calculations to complement your own market analysis.
Screener from Trading View
A screener is a tool for selecting financial instruments, mainly used when working with stocks. Thousands of securities are traded on exchanges; the screener, using a number of filters, allows you to select 10-20 instruments.
The developers have created 3 types of screeners:
- for shares. The settings have all possible types of filters. If we compare it with an analogue from Investing or Finviz, the only difference is in navigation and ease of perception of information. Functionality is approximately at the same level;
- for the Forex market. The choice of currency pairs is small compared to the stock market; a screener is needed not for selecting financial instruments, but for obtaining general information. Information is displayed in 3 modes – Performance, Oscillators and Trend Following. Performance – provides information on the price change as a percentage. Oscillators – recommendations from the point of view of a set of oscillators, Trend Following – recommendations on trend indicators. investing.com has something similar in the “Technical Analysis” section;
- for cryptocurrencies. The principle of operation is the same as that of the screener for the Forex market, but the information is provided on crypto assets.
Forex Charts - How to add Mini Chart tool in MT4 trading platform
The Mini Chart tool allows you to display a smaller chart on top of your main MetaTrader chart.
To add the Mini Chart indicator to your MT4 trading chart:
- Click on the Navigator shortcut located on the MT4 platform toolbar in the top left corner.
- Go to the "Indicators" section
- Select or drag the Admiral Mini Chart indicator onto the chart
- Be sure to check the "Allow changes to signal parameters" checkbox
- Click "OK"
So, you have transferred the MetaTrader 4 Supreme Edition Mini Chart indicator to your trading chart!
By default, the timeframe on the mini chart is the same as the timeframe on the MT4 trading chart you are adding the indicator to.
Scenarios for using a live chart
This tool can be used both as an auxiliary tool and as an analogue of a familiar trading terminal. For example, a live chart for binary options
can be used to search for signals, and then switch to the broker’s terminal and enter into transactions. Online platforms of BO brokers have extremely poor functionality; it is impossible to perform a full-fledged market analysis on them. For convenience, you can divide the screen into two parts and open the chart from Trading View in one, and your broker’s terminal in the other.
The live graph can also be used for training. Clicking on “Paper Trading” will open a demo account with virtual $100,000. This money can be used to trade directly through the Trading View chart.
If the broker is supported by Trading View, then you can work on a real account through a live chart. This can be done both on tradingview.com and through the broker’s website. Currently, the chart from Trading View is owned by the broker Intrade Bar.
Why should I use TradingView?
Most brokers make money when traders lose money. It is a fact. From their point of view, there is no incentive to provide traders with a convenient trading platform that would have the most modern tools and advanced functionality. This would only improve traders' trading performance and lead to a decrease in brokers' profits. Of course, not all brokers operate this way, but for many of them this business model works quite well.
On the other hand, the profit of companies that create charting platforms is based on providing traders with the maximum number of useful tools for chart analysis. The better and more convenient it is to work with charts, the more users will use this platform.
Brokers who work like kitchens focus on making profits generated from traders' losses. Online platforms aim to provide traders with the best experience in charting and using charts. As a trader, you obviously want to make money. Would you use your broker's software if you knew it was preventing you from making money? Most likely no.
TradingView helps you take your trading to the next level by offering a variety of charting and technical analysis tools. For these reasons and many more, I believe TradingView is one of the best charting platforms currently available to traders.