Perfect Pin Bar Strategy
The name of the strategy speaks for itself. Trading is based on the simplest reversal pattern; you need to wait for the formation of a pin bar, preferably as close as possible to the ideal one, and buy an option in anticipation of a reversal. Expiration period - 1...5 candles , usually the reaction to a reversal candle appears immediately.
For additional insurance, you can use horizontal levels. If the pattern is supported by strong support or resistance, the strength of the signal increases.
You need to take into work only those pin bars that correspond to significant extremes. If the chart is flat and something resembling this pattern appears, ignore it.
Compared to Forex trading, a trader working with BO is in a more advantageous position. To make a profit, he does not need a full-fledged reversal; a small movement after the pin bar is enough.
It is not recommended to use pin bars with abnormal shadow sizes .
Such movements indicate the emotional nature of the market movement; trading at such moments turns into a lottery.
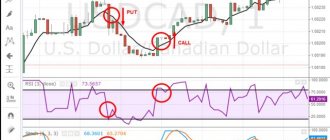
Two candles strategy
Two candle strategy
is based on the assumption that on the chart there are rarely areas for a long time in which candles of different colors alternate through one and resemble a zebra. Such situations can arise during a strong flat, but if you limit yourself to trend fragments only, you can build a good trading system.
The rules of the strategy are as follows:
- you need to wait for the candle color to change;
- as soon as the color changes, a trade is opened in the same direction as the previous candle. If a doji has formed, you can take into account the color of the candle before it. Expiration is always equal to one candle.
It is clearly seen that most of the losing trades occur when working against the intraday trend. If you exclude such transactions from your work, the win rate will increase from 60-65% to at least 70+%.
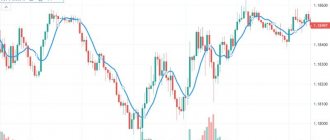
Three candle strategy
The trading strategy for binary options three candles is a little similar to the previous system, but differs in more stringent filtering of entry points. If the forecast turns out to be correct, then the formation of the pattern and the trading itself takes only 3 candles, hence the name.
The following requirements are put forward for the first 2 candles:
- at the first, a local extremum is formed. The color of the body of the first candle is opposite to the direction of movement before it. In a rising market the body is black, in a falling market it is white;
- the second candle should be the same color as the first, it confirms the reversal. If a signal is being prepared to buy a Put option, then the Low and Close price of the second candle must be lower than the Low and Close of the first;
- At the opening of the third candle, an option is bought; the expiration date is always set to 1 candle.
As an option for additional filtering, you can include a fractal indicator in the system. In this case, you need to take into work only those signals that were formed at local extremes, marked by the fractal indicator. True, the strategy in this case will cease to be indicator-less.
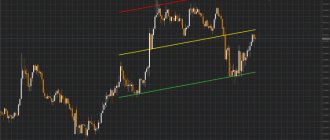
Bullish and bearish engulfing strategy
This binary options strategy is based on a standard candlestick pattern in which one candle completely engulfs the other. In Price Action, a similar model is called Rails. It is possible to get a win rate of 70+% due to a number of additional filters.
We do not trade directly after the formation of a pattern; we need to wait for the movement to develop, get a pullback, and only after that the deal is concluded :
- after absorption, 3 candles of the corresponding color should form in a row. For example, during a bullish reversal, you need 3 consecutively rising white candles to appear (you need to focus on the closing price);
- after this series, a correction candle needs to appear; only the color of its body is taken into account. In the bullish engulfing example, after a series of 3 white candles, a candle with a black body should appear;
- immediately after the correction candle closes, a trade is opened in anticipation of the continuation of the main movement. Expiration is set equal to 1 candle. Signals are activated only if all conditions are met during the first 5 candles after the engulfing pattern.
Some patterns are guaranteed to be missed, but for the remaining ones the win rate is above 65%. Conveniently, structures of this type are most often formed during the European and American sessions.
What is candlestick analysis of binary options?
Candlesticks as a method of displaying prices began to be used quite a long time ago, but not all over the world, and the name “Japanese candlesticks” did not appear for this method of display for nothing. The Japanese trader H. Munehisa was the first to use candlestick charts in trading, and the rest of the world learned about this method of display only at the end of the 20th century. Before the candlestick chart, the most popular chart was the bar chart:
In the USA, candlestick charts became known thanks to the financier of the large American bank Merrill Lynch, Steve Nison, and his book “Japanese Candlesticks”. At that time, this book was one of the most popular books in trading circles.
Candlestick analysis itself involves searching for candlestick patterns, which usually consist of 2-3 consecutive candles, but before moving on to the patterns themselves, it’s worth understanding the structure of candlesticks:
As you can see in the image above, each candle has a body (open to close) and shadows (price highs and lows). Closing up or down doesn't matter since all candles are built the same way.
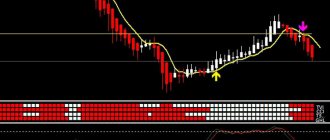
Strategy 5+ candles
Candlestick analysis provides good entry points, but the trader turns out to be dependent on the configuration of the candles. If the same pin bar does not follow the rules, a cautious trader will ignore it and may miss out on a profitable entry point.
In this candlestick strategy for binary options, we are not tied to the relationship between the individual elements of the candles. Instead, the number of candles of the same color formed in a row is counted. The idea is that such recoilless movements never last long, which means a rollback is inevitable. For an option to be closed in the money, it is enough for the chart to move at least 2-3 points in the desired direction.
The strategy is called 5 candles, but there is no strict connection to the number of candles of the same color in the sequence. You can play it safe and enter the market only after 7 or 9 candles, this will reduce the frequency of trading, but increase the win rate.
To enter the market, you just need to find a sequence of at least 5 candles of the same color on the chart . After closing the fifth in a row, you can open a deal in anticipation of a rollback, lasting at least 1 candle. It is better not to experiment with expiration and set it equal to one candle.
Martingale fits well into this strategy. The longer the chain of candles of the same color is, the higher the probability of movement in the desired direction.
If you decide to use Martingale, practice on a demo account first. This tactic leads to an exponential increase in the load on the deposit, so money management must be observed especially strictly.
TOP 3 best brokers this year
| QUOTEX | " WEBSITE |
| POCKETOPTION | " WEBSITE |
| FINMAX | " WEBSITE |
The article will give a definition of Japanese binary options. Let's consider the strategy of the Japanese Martin. We will try to explain how to read and trade strategies using Japanese candlesticks.
In general, be sure to read this material carefully, since the knowledge gained here will help you understand about 30-40% of the options market.
Strategy for lazy traders
Typically, when trading binary options, traders choose small time frames, they are attracted by the opportunity to make quick money. This strategy, like the others, is based on candlestick analysis, but is intended for the daily timeframe. It takes a few minutes to analyze the market; if the rules are followed, a deal is opened with expiration at the end of the day; if not, you just have to wait.
Strategy rules:
- after a correction candle, 2 trend candles are formed. The first is large, confirming the resumption of the trend, the second is somewhat smaller. For example, in a growing market a small black candlestick is formed, then a large white one and then another white one, but smaller;
- At the close of the second trend candle, an option is bought in anticipation of continued movement. Expiration is always equal to one candle.
The main disadvantage of this candlestick strategy for binary options is the low trading intensity. When working with one currency pair, transactions will not even be concluded every week.
It is also important to choose a broker who does not reduce payments at night. Transactions are concluded at the close of the daily candle (that is, outside the European and American sessions), the payment for the transaction is fixed at this moment. If it is below 75-80%, trading is not recommended.
Results
Making money using candlestick strategies is quite simple and accessible even to beginners in the world of trading. Japanese candlesticks are a powerful market analysis tool. If a candlestick pattern is correctly identified by a trader, there is an extremely high chance of it being executed correctly.
Candlestick analysis makes it possible to completely abandon the use of market indicators.
The disadvantages of candlestick strategies include significant time spent on market analytics behind the monitor screen. There is also a high probability of subjective interpretation of candlestick chart patterns (one trader sees a “Shooting Star”, while another thinks it is an ordinary candle).