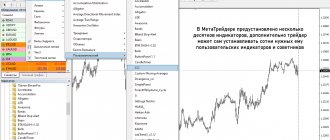
Probably all traders know what channels are and why they are needed in trading. But building channels is sometimes difficult, since it is not always clear what the current market situation is and what will happen next. And here the Linear Regression Channel indicator for binary options can come to the rescue.
This indicator automatically builds channels on the chart, dividing the range into two. As a result, we get the support level, resistance level and the 50% level in between.
What is Forex Linear Regression?
Linear regression creates a model of the relationship between two variables with a given set of values. The indicator tries to do this by finding a line of best fit between them. In the case of linear regression Forex trading, the two variables that we (as professional traders) are interested in are time and price. Of course, there are also many other meanings.
By observing data over a period of time, we get an idea of future performance, given that we can find a line of best fit that matches our expectations. This is because the line of best fit is what traders commonly call a trend. However, most regression indicators do not stop there.
They usually also provide data that helps indicate support and resistance levels. The result is achieved through the application of probability theory. Using the obtained values, traders can assume that price indicators will decline, distributed around this middle line.
If the price moves a significant distance from the center line, this data may not be taken into account in the statistics. At these levels we determine support or resistance values.
So, how can we determine at what points the price indicators will be minimum or maximum? One way is to use the statistical concept of the normal distribution and its accompanying measure of standard deviation.
To better understand the essence of the standard deviation strategy, let's take a quick look at what we mean by these terms. The normal distribution is a distribution of probable values, which is represented by a bell-shaped curve, as shown in the figure below:
The greatest density of probable values is concentrated around the middle line. This is the median, which is represented by the dotted line μ in the graph above. It is important to note that all normally distributed values are arranged symmetrically. Therefore, the median is exactly in the center.
Standard deviation is another statistical measure that measures the spread of values in a data set. The larger the standard deviation, the wider the bell curve. The mathematical formula that is used to construct this curve is relatively complex. But the concept it represents is actually quite simple.
The further we move away from the middle of the bell, the less likely X values will appear. This means that most X values are one standard deviation on either side of the mean. In fact, with a normal distribution, we would expect about 68% of the data values to fall within this range.
Two standard deviations on either side of the median cover approximately 95% of all values. The “tails” of the curve are extremely rare values. Why are these values still important to us? Because we can assume that in the future they may move closer to the median, and then they will represent more valuable information.
When trading with the indicator we are looking at, this concept is applied to market prices. Parallel regression lines are drawn on either side of the line of best fit. These lines help provide a rule of thumb for where we might expect nearby prices to be located.
Let's look at using the regression channel indicator in practice with the MetaTrader 4 (MT4) trading platform.
Trading tactics “Linear Regression”
As you may have guessed, Linear Regression is a trend indicator. Its main task is to indicate the current trend. Its direction and strength, and also signal market corrections. We understand the direction by analyzing the slope of the indicator's center line. If the indicator is directed upwards, the trend is positive; on the contrary, it is negative. The current strength of the movement is indicated by the location of prices in the channel. If prices touch the upper border of the channel over three candles, there is a strong upward movement. And vice versa, down. A correction in the market may be indicated by a rebound from the channel border and a reversal of price movements against the main direction. In this case, upon reaching the opposite boundary of the channel, the movement, as a rule, resumes. But, as with other indicators, you cannot use signals from this alone to enter the market. You always need confirmation.
Linear regression - How to use the linear regression channel indicator
Source: MetaTrader 4 - Linear Regression Channel in MetaTrader 4
The Dynamic Linear Regression Channel indicator comes standard with MetaTrader 4. The image above shows how to download the Linear Regression Channel indicator using the MT4 Insert tab. Note that you can also select the Standard Deviation option.
The linear regression indicator is very easy to download onto your chart in MT4.
To add your chosen Linear Regression Channel MT4 indicator to your chart, follow these steps:
➡️ Click on the part of the chart where you want to start your analysis
➡️ Move the cursor to the right until you reach the point where you want to end the analysis.
➡️ A linear regression channel will automatically appear on the graph between the two points.
Source: MetaTrader 4 - chart H4 EUR/USD - Linear Regression Channel Indicator. Data range: 09 Jul 2021 to 07 Oct 2021, accessed 21 Jan 2021. Please note that past performance is not a reliable indicator of future performance.
The image above shows the linear regression channel depicted by the blue dotted line on the EUR/USD four-hour chart. The median line is the line that combines the closing prices during the selected period. The trend lines above and below are the same distance from the center line.
They are parallel to each other and represent one standard deviation from the midline. The rules for trading on the regression channel are quite simple. The strategy is based on the expectation that once the price reaches the outer level, there is a good chance that it will return to the median line. Thus, the upper line represents the resistance level, and the lower line represents the support level.
The best line determines the direction of the trend. So, the method of using this indicator is to assume a continuation of the trend and then trade in the direction of the trend. As long as the trend continues, we can consider the midline to be the equilibrium point. It is obvious that when trading along median lines, gaps periodically occur, which lead to the formation of a new trend.
Therefore, any time the price moves outside the channel, caution should be exercised. If the price stays outside the channel for a long time, it may mean the formation of a new trend. This is why you should use regression trend analysis carefully and manage your risks responsibly.
It's also worth noting that you are not limited to using just one regression channel. You can add lines to the standard deviation that are multiples of the number of standard deviations from the median. To do this:
➡️ First, plot the channels in the same way as using the linear regression indicator.
➡️ Then you need to set the indicator parameters settings.
➡️ To do this, select “Graph”, “Objects” and “List of objects”.
➡️ Then, from the list of objects, select “StdDev Channel” and “Edit”.
Source: MetaTrader screenshot - selection of parameters on the H4 EUR/USD chart, Data range: from June 27, 2021 to September 25, 2019, accessed January 21, 2021. Please note that past performance is not a reliable indicator of future performance.
In the image above, the deviation value is 2.00. In addition, a tick o, due to which the curves can diverge indefinitely to the right of the graph. Next, a second regression channel is added with two standard deviation lines on either side of the midline.
We can also draw smaller channels within a larger one to identify smaller trends within the overall larger trend.
If you are interested in exploring regression trading further, there are other, more complex versions that you can experiment with. Moving average regression and polynomial Forex regression are some of them.
The moving linear regression channel and polynomial regression channels are analysis tools that address the areas mentioned above. You can also download more advanced custom indicators in MetaTrader 4.
Why not try the MetaTrader 4 Supreme Edition plugin to gain access to even more advanced trading tools? It is an ideal plugin for MT4 with its own package of indicators and a variety of trading tools. In addition, Supreme Edition is also available for MetaTrader 5.
SUPREME EDITION
Appearance of the Linear Regression indicator
The indicator consists of three lines. The central line is constructed based on regression analysis, and the other two (channel boundaries) are equally distant from it and parallel to it. In fact, this indicator is a graphical analysis tool, therefore it does not have additional set parameters, but is simply built according to a formula. The main idea is that you can take any period on the price chart and build a corresponding channel based on the candlestick values. A channel is built based on the closing prices of the candles.
About us: Admiral Markets
As a regulated broker, we provide access to the most popular trading platforms in the world. You can trade CFDs, shares and ETFs with us.
This material does not contain, and should not be interpreted as containing, investment advice, investment advice, or an offer or solicitation of any transactions in financial instruments. Please note that such trading analysis is not a reliable indicator for any current or future trading as circumstances may change over time. Before making any investment decisions, you should seek advice from independent financial advisors to ensure you understand the risks.
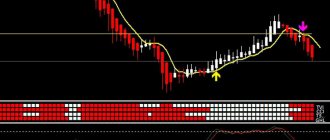
Trade based on “Linear Regression”
Conditions for opening a position:
- The trend is upward. The middle line of the indicator is growing.
- The price approached the lower border of the channel and broke through it.
- We place a pending buy order 2 points higher from the maximum price of the candle at which the downward channel breakdown took place.
- If, within four candles, the order does not work, we delete it. As you can see in the picture, the order was opened on the third candle after the signal.
- Stop Loss is set five points lower than the previous minimum value.
- We close the deal with a profit as soon as the price closes above the upper border of the channel.
For a sale transaction, the conditions are similar, but vice versa.
Note. For more stable trading, use clear money management rules and, as mentioned above, confirming signals from other indicators.
Settings
One of the pre-required parameters for calculating CCI is the time interval, which plays a key role in enhancing the accuracy of CCI. Since he tries to predict the cycle using Moving Averages, the more accurately the period of the Moving Average (for averaging the price) is matched to the cycle, the more accurate the calculations will be. This is true for most oscillators. Therefore, although most traders use the default parameters to calculate CCI, a more accurate time frame reduces the number of false signals.
Here are four simple steps to determine the optimal calculation interval (for the daily scale):
- Open the daily chart of the instrument;
- Determine the location of two highs or two lows on the chart;
- Take into account the time interval between these two highs or lows (cycle length);
- Divide this time interval by three to obtain the optimal time interval to use in the calculation (1/3 cycle).
It is best to use a time frame for this indicator not lower than H1; on lower time frames the indicator gives many false signals. It works best on a sideways trend (not to be confused with a flat), but on a pronounced trend, signals against the trend should be considered false or warning. Many traders say that CCI gives the best signals on the EURUSD pair. I don’t presume to say this, but if you decide to use this indicator in trading, I think it’s worth starting your research with this pair. Well, as always, here’s another banality, which for some reason many people often forget: the <insert absolutely any name, in this case CCI> indicator should under no circumstances be used alone. I mean, it’s not worth trading on it in a group with friends, but in conjunction with other signals, other indicators.