For correct and profitable binary options trading, it is necessary to use approaches such as money management and risk management, and for successful forecasting and making accurate transactions, one cannot do without a suitable type of analysis, one of which is technical.
Technical analysis of binary options has many types and methods of use, but its essence always comes down to determining entry points into a transaction, and in the case of trading on the Forex market, exit points.
Basics of Technical Analysis
Technical analysis of binary options is used to predict future price changes based on past data. Based on three postulates.
The price takes everything into account . The chart already reflects all events: political, economic and macroeconomic news. Using technical, there is no need for fundamental market analysis.
Prices move according to a trend —movement in a certain direction. The trend can be upward or downward. The trader’s task is to find it and enter the market.
History is cyclical . If quotes have broken through or bounced off a certain level in the past, this will most likely happen again in the future.
Technical analysis with indicators
Mathematical algorithms track quotes and provide market signals. The tools help in determining the direction and strength of a trend, the degree of overbought or oversold of an asset, and possible turning points.
Indicators help in technical analysis. But experienced traders never rely solely on them, but use the data obtained as an additional source of information.
They are conventionally divided into two main categories: trend oscillators, which follow the price, and oscillators, which lead it.
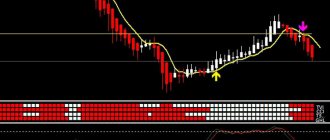
Trending . Usually installed on a chart, showing the direction and strength of the trend. The main tool is the moving average line, which determines the price movement over a certain interval. For example, an MA with a period of 10 will draw a line based on the average data for the last 10 candles.
Moving average on the chart
Most other trend indicators are based on the Moving Average.
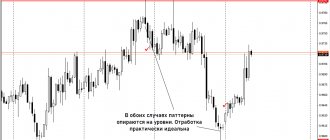
Oscillators . Monitor supply and demand levels. Displayed below the graph, showing movement in the corridor, usually with boundaries from 0% to 100%.
Leading tools draw overbought and oversold levels of an asset when the price is too high or low. Leaving the zones may indicate a reversal. Oscillators work better in a flat, since during a strong trend the indicator can remain in the corridor without showing a reversal.
Oscillators on the chart
Trading against the trend is risky. Using oscillators, a trader can learn about market strength and direction so that when a new trend appears, he can confidently enter a trade at an early stage.
Technical analysis without indicators
The system for working with a chart without additional tools is called Price Action. Traders make decisions based on candlestick patterns that are formed as a result of changes in supply and demand. For some speculators, this is enough to conduct accurate technical analysis on binary options.
A little history
The basics of technical analysis appeared in the 17th century. Some provisions were formulated by Joseph de la Vega. He used them for the Dutch market. In the 18th century, a Japanese rice trader, Homma Munehisa, developed Japanese candlesticks, which are also used by modern stock speculators.
In the 19th century, Charles Dow created the basis of the system and identified several fundamental concepts, including the “market trend.” However, Robert Edwards is considered the founder of the system. He and John Maggi wrote a book that was published in 1948 and became a real sensation, even now it is relevant and used by stock speculators.
The publication describes the basic principles of technical analysis, examples that help to identify a number of recurring trends and take advantage of them to make a profit.
Graphs and their types
The main ways to display the dynamics of quotes in the terminal: line, Japanese candles, bars.
Line graphs are the simplest. Each point is the closing time of a certain period. For example, on the H1 timeframe, the chart will display the price at the last second of each hour. The line does not provide information about the movement of quotes within these 60 minutes.
Linear graph type
Japanese candlesticks show four prices of each period: open, close, high and low, which gives more information about the behavior of players in the market.
Consists of body and shadows. The body shows the range between opening and closing. Shadows reflect the maximum and minimum movements of quotes.
Combinations of candlesticks create figures and patterns that traders use when working with the Price Action system.
Japanese candles
Bars show the same thing as candles - the differences are only visual.
Bars
Options Analyzer
Special programs will help you work with BO.
With its help, virtually every trader gets new opportunities. It is, in fact, a special program that is extremely easy to use even for novice users.
The main goal is to significantly simplify the work with the trading platform of a particular broker.
Thanks to high-quality software of this format, the user will be able to save his own time on regularly viewing current news, studying complex strategies, and the like.
You can use a reliable analyzer that will provide relevant results. In the right hands, it can turn out to be a stable trading tool.
THE MAIN THING is to choose an adequate program for the job.
Trend
Uptrend on the chart
Trend is the movement of quotes in one direction. It determines the general mood of the market. Can be rising or falling. An uptrend occurs when a new high and low are formed above the previous ones. Descending - when the extremes are updated lower.
There is also sideways movement - flat, when the price does not have a specific direction.
Support and resistance levels
Support and resistance are areas upon reaching which the price usually rebounds in the opposite direction. This is the basis of technical analysis, confirming the postulate that the market is cyclical.
Price corridor on the chart
The support line is built based on two lows. Resistance - to the maximum. The closer the price is to the levels, the higher the probability of a rebound. Going beyond the limits indicates a possible change in trend if the price lingers behind the line.
Volumes
Volume is an important technical analysis tool that allows you to understand whether a price movement has real strength. It increases each time a buyer and seller enter into a deal.
OBV line on the chart
Indicators summarize buying and selling activity, determining the strength of market participants. If the price and volumes grow in parallel, then the asset is in a strong trend movement. The divergence indicates weakness in the impulse.
In the binary options market, volumes play a secondary role. Traders usually enter into transactions on currency pairs that are not traded on the same exchange, so there is no exact volume for them.
Features of choosing an analytical method
If you are new to BO trading, believe me, my tips will be more than useful for you!
First of all, every newcomer to this market must choose a high-quality method that will allow him to adequately predict the state of the market and all other details.
Novice traders usually have limited knowledge in terms of analysis and tools for carrying it out.
Therefore, we must gradually master new methods and try to implement them into work as harmoniously as possible. Do not forget about many nuances, including the absence of haste, complete adequacy and responsibility.
There are several most popular types of analysis:
- Fundamental.
- Technical.
- Evaluation method based on news, etc.
Each option has its own nuances. Therefore, according to the specific needs of the trader, it will definitely be possible to choose the ideal method that will bring him positive results.
We must also learn to choose time scales. The psychological component is also very important. The user should consider market analysis as a useful tool.
It is IMPORTANT here to perceive all the information that was received as objectively as possible. This will allow you to make the right decisions. Having basic knowledge plays an important role.
Some newcomers do not know the basic rules of work and do not follow generally accepted rules. Due to the desire to make money quickly and lack of experience, significant errors, subjectivity, etc. may be made. Therefore, analytical actions must be approached soberly and prudently.
Technical analysis figures
They are formed by price movements on the chart. Consist of one or more Japanese candles. Patterns can indicate a possible correction or its completion, continuation or change of trend, the strength of bulls and bears.
A triangle is a pattern indicating a continuation of a trend. Formed when support and resistance lines converge. Can be symmetrical, ascending and falling.
Symmetrical, ascending and falling triangle
A flag is a continuation pattern that moves counter to the trend over a shorter time frame. Consists of two elements:
- flagpole - one or more large candles closed in the same direction;
- flag - movement in the opposite direction with obvious support and resistance levels.
Falling and rising flags
If the pullback lasts more than 20 candles, it may not be a flag, but a reversal and the beginning of a new trend. The ideal entry point is a local extremum before the breakdown. But for beginners it is better to trade when the impulse has already been confirmed.
Head and shoulders is a reversal pattern consisting of three waves. Can form in bullish and bearish markets.
Example of a bullish and bearish reversal
The figure shows how buyers or sellers are losing power. The second shoulder indicates the end of the trend, since bulls or bears can no longer update new extremes. After breaking through the point where the formation of the first shoulder begins, the pattern can be considered complete.
Double top and double bottom is another reversal pattern. Interpretation of a double top: the price reaches a peak and rolls back to a support level. This is followed by an attack by the “bulls”, which again lifts it up before the collapse of quotes. The second pattern works exactly the opposite.
Example of Double Top and Double Bottom patterns