19752
0
Author of the article:
Sultanov Iskander Anvarovich
Founder of Projectimo.ru
Recent publications by the author:
Systematic labor standardization project
Implementation of a project to transfer accounting to outsourcing
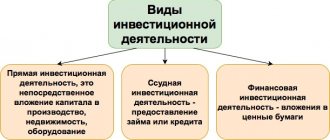
Anticipation of significant changes in investments
The key indicators used to develop a financial and investment strategy and financial and economic analysis of its execution, as is known, are based on the methods of accrual and cash flows. Return on investment is an indicator that uses primarily the accrual method and serves as a parameter for assessing investment decisions at the corporate level and the level of a local investment project. Due to its specifics, it stands somewhat apart from the “golden” five criteria for the economic efficiency of investments: NPV, IRR, MIRR, PP and PI.
EBIT (Earnings Before Interest & Tax)
Definition
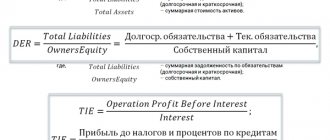
Operating profit before interest and taxes (EBIT) is a financial and analytical indicator of Form 2 (Income Statement), equal to the volume of profit before interest on borrowed funds and taxes. This indicator is also called operating profit and is used in calculating some financial performance ratios.
EBIT Formula
EBIT = Revenue - COGS - Operating Expenses EBIT = Revenue - Cost - Selling and administrative expenses EBIT = Profit (loss) before tax (line 2300) + Interest payable (line 2330) EBIT = Profit from sales (line 050 f . No. 2) + Interest on loans and borrowings included in the cost EBIT = Net profit + Income tax expenses - Reimbursed income tax (+ Extraordinary expenses) ( - Extraordinary income) + Interest paid - Interest received
Conclusions about what a change in indicator means
If the indicator is higher than normal
Not standardized
If the indicator is below normal
Not standardized
If the indicator increases
Positive factor
If the indicator decreases
Negative factor
Notes
The indicator in the article is considered from the point of view not of accounting, but of financial management. Therefore, sometimes it can be defined differently. It depends on the author's approach.
In most cases, universities accept any definition option, since deviations according to different approaches and formulas are usually within a maximum of a few percent.
The indicator is considered in the main free online financial analysis service and some other services
If you need conclusions after calculating the indicators, please look at this article: conclusions from financial analysis
If you see any inaccuracy or typo, please also indicate this in the comment. I try to write as simply as possible, but if something is still not clear, questions and clarifications can be written in the comments to any article on the site.
Best regards, Alexander Krylov,
The financial analysis:
- Absolute economic indicators of an enterprise's activity Absolute economic indicators of an enterprise's activity are indicators that allow us to judge several things: The size of the enterprise and the scale of its activities The level of income and expenses...
- Key performance indicators of an enterprise Key performance indicators of an enterprise are indicators that allow us to judge several things: The size of the enterprise and the scale of its activities The level of income and expenses About ...
- Relative economic indicators of the enterprise’s activity Relative indicators of the enterprise’s activity are indicators that allow one to judge the efficiency of work. The initial data for the preparation of such indicators can be taken from the balance sheet and report on ...
- III. CAPITAL AND RESERVES Section III Capital and Reserves is the third section of the balance sheet. But what is more important is the first section of financial sources, that is, the liability side of the balance sheet. By this he...
- Horizontal and vertical analysis of the balance sheet and income statement (profit and loss) Good afternoon, my dear reader. In this article we will consider such a topic as horizontal and vertical analysis of the balance sheet and financial results statement (income and...
- I. NON-CURRENT ASSETS Non-current assets are property used in the activities of an enterprise for more than a year. Its value is transferred in parts to the cost of finished products. A sign of assets is the ability to generate income for the organization.…
- Balance sheet liability The balance sheet liability is the second part of the balance sheet. It contains a list of those financial resources that were used to acquire property, that is, assets that...
- V. CURRENT LIABILITIES Section V. Current liabilities is the fifth section of the balance sheet. At the same time, it is also the third section of the liability side of the balance sheet, which shows the sources of financing for the property. AND…
- IV. LONG-TERM LIABILITIES Section IV. Long-term liabilities are the fourth section of the balance sheet. At the same time, it is also the second section of the liability side of the balance sheet, which shows the sources of financing for the property. AND…
- Balance sheet asset A balance sheet asset is a part of the balance sheet containing data on the assets of the enterprise, that is, on its property. The balance sheet asset reflects property, property rights and cash...
EBITDA (Earnings Before Interest, Taxes, Depreciation and Amortization)
Definition
Operating profit before taxes, depreciation and amortization and interest on loans (EBITDA) is a financial and analytical indicator that reflects the financial performance of a company, excluding the influence of the effect of capital structure (interest paid on borrowed funds), tax rates and depreciation. EBITDA allows you to determine the efficiency of a company’s activities, regardless of its debt to various creditors and the state, as well as the depreciation method. The indicator is useful when comparing companies in the same industry but with different capital structures. It allows you to compare companies with different accounting policies (for example, regarding depreciation or revaluation of assets) and different tax conditions.
EBITDA Formula
EBITDA = Revenue - Expenses (excluding tax, interest, depreciation and amortization) EBITDA = Profit (loss) before tax + (Interest payable + Depreciation of fixed assets and intangible assets) EBITDA = Profit from sales (line 50 F. No. 2) + Depreciation charges (Form No. 5) EBITDA = Profit (loss) from sales (line 2200) + Interest payable (line 2330) + Depreciation charges EBITDA = EBIT + Depreciation charges for tangible and intangible assets - Revaluation of assets = Net profit + Income tax expense - Income tax refunded (+ Extraordinary expenses) (- Extraordinary income) + Interest paid - Interest earned EBITDA = Operating profit + Depreciation
What does Return on Average Capital Employed tell you?
Return on average capital employed (ROACE) is a useful ratio when analyzing businesses in capital-intensive industries such as oil. Companies that can generate higher profits from fewer fixed assets will have a higher ROACE than companies that are not as efficient at converting capital into profits. The formula for calculating the ratio uses EBIT in the numerator and divides it by average total assets minus average current liabilities.
Fundamental analysts and investors like to use ROACE ratios because they compare a company's profitability to the total investment made in new capital.
Brief information
- Return on average capital employed (ROACE) is a financial ratio that shows profitability compared to the investments a company has made in itself.
- Fundamental analysts and investors like to use ROACE ratios because they compare a company's profitability to the total investment made in new capital.
- ROACE differs from ROCE because it takes into account the average of assets and liabilities.
EBITDAR (Earnings Before Interest, Taxes, Depreciation, Amortization and Rent/Restructuring Costs)
Definition
Operating profit before taxes, interest on loans, depreciation and lease payments/restructuring costs/operating lease expenses (EBITDAR) is a financial and analytical indicator that reflects the financial result of the company, excluding the influence of the capital structure effect (interest paid on borrowed funds). funds), tax rates, depreciation and lease payments/restructuring costs/operating lease expenses. Depending on the company and the goals of the users, the indicator may include either rental costs, restructuring costs, or operating lease costs, but always only one type of expense. EBITDAR expands EBITDA by adding an additional lease or restructuring item to better reflect financial performance. Sometimes this indicator is called operating cash flow.
EBITDAR formula
EBITDAR = EBITDA — rent/restructuring costs = Revenue — Expenses (excluding tax, interest, depreciation, amortization and rent/restructuring costs) EBITDAR = EBITDA — Rent expenses/Operating leasing expenses/Restructuring expenses
NOPAT (Net Operating Profit After Tax)
Definition
Net operating profit after taxes (NOPAT) is the after-tax operating profit excluding accrued interest on loans and borrowings received. When calculating it, all income and expenses of the enterprise reflected in the income statement, including income tax, are taken into account. To determine NOPAT, interest payable must be added to the net profit of the reporting period.
NOPAT Formula
NOPAT = EBIT x (1 - Tax Rate) NOPAT = EBIT x (1 - Tax Rate) Net Profit (NOPAT) = Profit before Tax - Income Tax (before interest on borrowed capital) NOPAT = (Net Profit + Interest on borrowed capital + Tax shield effects on borrowed capital)
Bottom-up calculation method NOPAT = Operating profit after depreciation and amortization + Implied interest expense on operating leases + Increase in LIFO reserve + Increase in bad debt reserve + Increase in net capitalized research and development - Cash operating taxes, where: Operating profit after depreciation and amortization – operating profit after depreciation; Implied interest expense on operating leases – estimated interest expenses on operating leases; Increase in LIFO reserve – increase the LIFO reserve; Increase in bad debt reserve – increase in reserve for doubtful debts; Increase in net capitalized research and development – increase in net capitalized research and development; Cash-operating taxes – operating taxes calculated using the cash method.
Calculation method "from top to bottom": NOPAT = Sales + Implied interest expense on operating leases + Increase in LIFO reserve + Other income - Cost of goods sold - Selling, general and administrative expenses - Depreciation - Cash operating taxes, where: Sales - sales ( sales revenue); Implied interest expense on operating leases – estimated interest expenses on operating leases; Increase in LIFO reserve – increase the LIFO reserve; Other income – other income; Cost of goods sold – cost of goods sold; Selling, general and administrative expenses - commercial, general and administrative expenses; Depreciation - depreciation; Cash-operating taxes – operating taxes calculated using the cash method.
Adjustments
Regardless of the approach chosen, the following adjustments must be taken into account when assessing NOPAT.
Income and losses from discontinued operations
If a company has assets held for sale, any gains or losses they generate must be accounted for separately. Since they will not recur in the future, their value must be subtracted in the calculations.
Write-off of assets
In accounting, the write-off of assets occurs by reducing the amount of equity capital by the corresponding amount. If such a write-off was included in the item of operating expenses, then its amount must be returned (added back) when calculating after-tax operating profit.
Change in off-balance sheet reserves
Any change in the value of off-balance sheet reserves must be added to NOPAT. For example, an increase in the reserve for doubtful debts does not mean that the company will necessarily receive less revenue, that is, its formation underestimates the amount of operating income and net profit.
Implied interest on operating leases
Unlike a finance lease, an operating lease is an example of off-balance sheet financing. Under accounting standards, assets provided by the lessor under operating leases are on the lessor's balance sheet, but they generate economic profit in the same way as assets under a finance lease. Therefore, we must add the implied operating lease interest to the after-tax operating profit.
Changes in deferred tax liabilities
Deferred tax liabilities arise as a result of discrepancies between accounting and tax accounting standards when taxable income in tax accounting is less than in accounting. In other words, it represents the amount of taxes that will be paid in the future. Therefore, the increase under this item must be deducted to arrive at the exact amount of taxes paid. Accordingly, the reduction under this article should be added.
Tax shield from non-operating expenses
Non-operating expenses that reduce the tax base reduce the amount of taxes actually paid. This distortion is eliminated by adding the tax shield to after-tax operating profit.
Tax Shield = Deductible Non-Operating Expenses × Tax Rate
EBIAT (Earnings Before Interest After Taxes)
Definition
Earnings before interest and after taxes (EBIAT) is a financial and analytical indicator equal to the volume of earnings before interest after taxes. The fundamental difference between NOPAT = EBIT x (1 – t) and EBIAT is that when calculating EBIT x (1 – t), income tax at a nominal rate is taken on all profits before interest, and when calculating EBIAT, what is actually paid by the company is deducted income tax, which is slightly lower due to the fact that interest payments were charged to cost. Thus, EBIT x (1 – t) is less than EBIAT by the amount (1 – t) xi, where i is interest payments.
EBIAT formula
EBIAT = Revenue - Cost of Goods Sold - Expenses (including taxes and excluding interest) EBIAT = Income - COGS - expenses (including taxes and excluding interest)
OIBDA (Operating Income Before Depreciation And Amortization)
Definition
OIBDA (Operating Income Before Depreciation and Amortization) should be distinguished from EBITDA because the starting point of the indicator is operating income, not net income. Thus, OIBDA does not include non-operating income, which typically does not repeat from year to year. It only includes income generated through regular transactions and is not affected by non-recurring charges, such as those associated with exchange rate differences or tax credits. OIBDA is calculated as operating profit before depreciation (MA + intangible assets), impairment of non-current assets (fixed assets, goodwill and other intangible assets) and loss (profit) from the disposal of fixed assets.
OIBDA formula
OIBDA = Operating Income + Depreciation + Amortization + Tax + Interest OIBDA = Operating Income + Depreciation of Fixed Assets and Intangible Assets
EVA (Economic Value Added)
Definition
Economic value added (EVA) is a business's profit from ordinary activities, less taxes, reduced by the fee for all capital invested in the business. EVA is the real economic profit that belongs to shareholders after deducting all operating expenses (including taxes) and financing costs. The indicator is used to assess the efficiency of an enterprise from the position of its owners, who believe that the activity of the enterprise has a positive result for them if the enterprise managed to earn more than the return on alternative investments. This explains the fact that when calculating EVA, not only the fee for using borrowed funds, but also equity capital is deducted from the amount of profit. It can be argued that this approach is more economic than accounting.
Interpretation of the EVA indicator: - If EVA>0, then capital is used efficiently. — If EVA=0, then investors received a rate of return that compensated for the risk. — If EVAs part of company value management, EVA is used: when drawing up a capital budget, when assessing the performance of departments or the company as a whole, when developing an optimal and fair bonus system for management.
Thus, EVA: is a tool for measuring the “excess” value that is created by investments; — indicator of the quality of management decisions; - a tool for determining the rate of return on capital (ROC) - the part of the cash flow that is earned through investments is allocated; — allows you to determine the value of the company; — serves to evaluate the effectiveness of individual divisions of the company
EVA formula
EVA = NOPAT - WACC*IC EVA = EBIT - CE * WACC EVA = (ROCE - WACC) * CE, where: NOPAT - net operating profit after taxes; WACC—weighted average cost of capital; IC is invested capital. EBIT - net income from interest and tax payments; CE - own working capital (capital employed). ROCE (return of capital employed) = EBIT / Capital Employed - Return on capital employed
Equity EVA = (ROE-Cost of Equity) * (Equity Invested) , where: ROE – return on equity Cost of Equity – cost of equity capital Equity Invested – invested equity capital
Calculation and adjustment of NOPAT and IC
Goodwill
According to the accounting policy of OJSC NLMK, goodwill is not amortized, but is revalued every year, which is reflected in the line “losses from impairment of assets”. Since this item is not operating, like the item “expenses to increase liabilities for asset retirement,” they were not taken into account when calculating EBIT. That is, EBIT was calculated as revenue reduced by the amount of production costs, administrative and general business expenses, commercial expenses, and taxes other than income tax. Therefore, the estimated EBIT does not coincide with the operating profit from the company's profit and loss account. NOPAT was calculated as EBIT multiplied by the effective tax rate.
Depending on the purposes of the calculation, you can adjust NOPAT and IC for goodwill, or not adjust it. We calculated IC with and without goodwill. We will use IC without goodwill in our calculations. We do not adjust NOPAT because goodwill is not amortized.
IT
Next, we adjust the calculated NOPAT and IC to NOPAT by adding the change in net NOPAT to NOPAT and net NOPAT to invested capital. Net IT is the amount of IT minus the amount of IT.
Reserves
Since all major items in the balance sheet are presented net, that is, less reserves, no adjustments are required.
Operational leasing
The company has no assets under operating lease, only finance lease, therefore no adjustments are required.
R&D
The company does not disclose information on R&D expenses (although it is known that NLMK has certain R&D activities, these are “design and survey work” for the Zhernovskoye-1 field), therefore, in the absence of the necessary data, we do not adjust NOPAT and IC for expenses for R&D.
Determining the discount rate
Let's find the discount rate WACC (calculation for 2011 is described)
· Let's determine the rate on borrowed capital.
To do this, we will use the synthetic credit rating method, according to which the rate on borrowed capital is found according to the formula:
,
where krf
– risk-free rate,
spread_country
– default spread of the Russian Federation and
spread_company
– default spread of a specific company.
We found the risk-free rate as the rate on 10-year US government bonds, its value was 1.75%. We took the Russian default spread from the Damodaran website, its value is 1.6%. To calculate the company's default spread, the interest coverage ratio (corresponding to the AAA rating) was calculated. However, Russia is subject to a sovereign ceiling rule, according to which securities of companies from developing countries cannot be rated higher than the country itself. Therefore, we took the company's default spread to be 1.6%. In general, the dollar rate on borrowed capital turned out to be 4.95%.
· Let's determine the rate on equity capital. To do this, we apply the CAPM model:
The country's risk-free rate and default spread have already been found. We found the company's beta using the industry unleveraged beta from Damodaran's website. It is equal to 1.25. Since the company does not detail in its reporting the nature of its costs, whether they are fixed or variable, we cannot adjust the unleveraged industry beta for operating leverage. But we can adjust it for financial leverage using the Hamada formula. We got a leveraged beta that turned out to be 1.66. According to the company's accounting policy, debt is reflected on the balance sheet at fair value, which means we can take this value to calculate beta and, further, WACC.
As a market risk premium, we took the arithmetic average difference in yield on US government bonds and US stocks from A. Damodaran's website over the past 10 years (5.79%). Based on the data obtained, the cost of equity capital was calculated:
ke levered = 12.94%
Adding all the components of the CAPM model, we got a WACC of 10.6%.
Further, using the formula EVA = NOPAT – IC∙WACC, economic added value was calculated, which in 2011 amounted to 395,020.46 thousand US dollars.
conclusions
Currently, the EVA concept is a very promising but not yet established concept. Its empirical testing yields conflicting results in both developed and emerging markets. This is largely due to an unstable conceptual framework - scientists calculate EVA components in different ways, which makes the research results not entirely comparable. There are also difficulties with a lack of data, narrow samples and, as a result, low-quality results.
A practical calculation of EVA for a Russian company showed that such a calculation is only possible if the company is chosen correctly, because a lot of additional data is needed. It is difficult to assess whether this calculation provides additional significant information for the analysis of NMLK (in the absence of comparable information for other companies).
Bibliography
1. Emelyanov A.M., Shakina E.A. (2008), Main stages in the evolution of cost management concepts, 4(8) (2008) 79-87
2. Ivashkovskaya I.V. Managing company value: a challenge to Russian management // Russian Journal of Management No. 4, 2004
3. Sitnik P.E. Using economic profit indicators to construct a regional rating of Russian non-public companies // Journal of Corporate Finance No. 4(8), 2008
4. Smirnova I.A. Assessment of changes in shareholder value of Russian companies: comparison of value-oriented and accounting indicators // Financial management No. 1, 2007
5. Osipov M.A. Using the concept of economic added value (EVAtm) to assess company performance // Corporate Finance Management, No. 1, 2005
6. Cheremushkin S.V. EVA and adjustments of accounting indicators in order to measure the actual financial performance of a commercial organization // Financial management. - 2008. - No. 5.
7. Schneider L.I. Economic value added: taking into account adjustments when calculating profit and capital // Kuban State University, Professional system of financial analysis, 2010
8. Ahmad Ismail, (2006) Is economic value added more associated with stock return than accounting earnings? The UK evidence, International Journal of Managerial Finance, Vol. 2 Iss: 4, pp. 343 – 353.
9. Anderson.A., Bey R., Weaver S. Economic Value Added Adjustments: Much to Do About Nothing // WP-Lehigh University, 2004
10. Haddad F. (2012), The Relationship between Economic Value Added and Stock Returns: Evidence from Jordanian Banks, International Research Journal of Finance and Economics, 89 (2012) 6-15.
11. Lovata L., Costigan M., (2002) Empirical analysis of adopters of economic value added, Management Accounting Research, 13, 2002, 215–228.
12. McIntyre E, Accounting choices and EVA // Business Horizons, No. 1, 1999
13. Rostami K., Margavi A., Samadi S., Omrani H., Asadzadeh H., Nazari H. (2012), Comparing Economic Value Added with Earnings-Price Ratio and Book-to-Market Ratio in Preparing the Optimal Portfolio: Evidence from Iran, European Journal of Economics, Finance and Administrative Sciences, 44 (2012) 100-107.
14. Russ R., Economic Value Added: Theory, Evidence, A Missing Link // Journal of Applied Corporate Finance, No. 1, 2001
15. Stewart III, GB The Quest For Value // Harper Business. NY, 1991.
16. Stewart III, GB EVA: Fact and Fantasy // Journal of Applied Corporate Finance, Vol. 7, No. 2, 71-84, 1994
17. Teker D., Teker S., Sönmez M. (2011), Economic Value added Performance of Publicly Owned Banks: Evidence from Turkey, International Research Journal of Finance and Economics, 75 (2011) 132-138.
18. Cheremushkin S. (2008), What's wrong with the Economic Value Added, Mordovian State University named after NP Ogaryov, (2008), 1-50.
19. Chikashi Tsuji (2006) Does EVA beat earnings and cash flow in Japan? Applied Financial Economics, Vol.16, pp. 1199-1216.
20. Worthington, A. and West, T. (2004) Australian Evidence Concerning the Information Content of Economic Value-Added, Australian Journal of Management, Vol. 29(2), pp. 201-224.
SVA (Shareholder Value Added)
Definition
SVA (Shareholder Value Added) is the capitalized change in the present value of operating cash flow, adjusted by the present value of the investments in non-current and working capital that caused the change.
Application of the SVA indicator as part of assessing the performance of a company: - to assess the value of the company; — to assess the effectiveness of ongoing investment projects; — to evaluate strategies (using SVA, the expected effect of implementing a new strategy is calculated); — to determine CEO remuneration (managers’ remuneration is “linked” to the specific results of implementing their strategy).
The formula for calculating the value of a business when using the SVA indicator: Company value = Market value of invested capital at the beginning of the year + Accumulated SVA value of the forecast period + Market value of securities and other investments
Formula SVA
1 way to calculate SVA: SVA = Change in value of invested capital, where: Value of invested capital = accumulated present value of cash flow + Present value of residual value
Method 2 for calculating SVA: SVA = Present value of residual value - Present value of strategic investments, where: Residual value = capitalized change in net income (NOPAT), Present value of strategic investments = present value of change in invested capital.
MVA (Market Value Added)
Definition
The market value added (MVA) indicator allows you to determine the excess of the company's market capitalization over the value of equity capital (presented in the balance sheet). The market capitalization of a business is the product of the number of shares of a business issued and their market price. MVA focuses on the market capitalization of a company, which is more meaningful for public companies listed on stock exchanges. The price of shares in such cases more accurately determines the wealth of shareholders than profit. In the most general sense, market added value is understood as the difference between the amount of growth in the market value of capital achieved over a period and the amount of invested capital.
MVA formula
MVA = Market Value of Debt + Market Value of Equity - Total Adjusted Capital MVA = Market Value of Equity - Total Adjusted Capital MVA = Market capitalization of the company - Net asset value (equity) on the company's balance sheet MVA = Market value of debt + market capitalization - total capital * * it should be noted that the balance sheet estimate of total capital must be adjusted to eliminate distortions caused by accounting methods and certain accounting principles. These amendments will be discussed in more detail when describing the EVA indicator.
Difference between ROACE and ROCE
Return on capital employed (ROCE) is a closely related financial ratio that also measures a company's profitability and efficiency in the use of its capital. ROCE is calculated as follows:
ROCE=EBITCapital Employed\begin{aligned} &\text{ROCE} = \frac{ \text{EBIT} }{ \text{Capital Employed} } \\ \end{aligned}ROCE=Capital Employed
Capital employed, also known as funds employed, is the total amount of capital used to generate profits by a firm or project. It is the value of all assets used in a business or business unit and can be calculated by subtracting current liabilities from total assets. ROACE, on the other hand, uses average assets and liabilities. Averaging over a period smooths out the numbers to eliminate the impact of extreme events such as seasonal surges or downturns in business activity.
Cash Value Added (CVA) or Residual Cash Flow (RCF)
Definition
The Cash Value Added (CVA) model includes only cash items, i.e. Earnings Before Depreciation Interest and Tax (EBDIT), adjusted for non-cash expenses), working capital movements and non-strategic investments. The sum of these 3 items is Operating Cash Flow (OCF). OCF is compared to a cash flow requirement, the Operating Cash Flow Demand (OCFD). The OCFD represents the pattern of cash flows required to meet the investor's financial requirements for a company's strategic investments, i.e., the cost of capital.
CVA formula
Direct method: CVA = AOCF – WACC * TA, where: AOCF (Adjusted Operating Cash Flows) – adjusted operating cash flow; OCF = EBIT + Depreciation - Taxes WACC - weighted average cost of capital; TA – total adjusted assets. Or CVA = CF - Depreciation - Capital Charge
Indirect method: CVA = (CFROI - Cost of Capital) * Gross Investment, where: Capital charge = cost of capital * gross investment CFROI = (CF - Depreciation)/ Gross Investment Depreciation = [WACC/ (1+WACC)n - 1 ]* TA CF = Adjusted profit + interest expense + depreciation Gross Investment = Net Current Assets + Historical initial cost
CVA = Sales x ((Sales – Cost)/Sales – Working Capital Movement/Sales – Non Strategic Investment/Sales) – OCFD / Sales
In the current practice of financial management, the model is simplified and looks like: RCF (CVA) = AOCF – WACC x TA, where: AOCF (Adjusted Operating Cash Flows) – adjusted operating cash flow; WACC – weighted average cost of capital; TA – total adjusted assets.